2957
Evaluation of Lesion Tissue Composition in Patients with Juvenile Osteochondritis Dissecans (JOCD) of the Knee Using T2* Mapping at 3T1Center for Magnetic Resonance Research, University of Minnesota, Minneapolis, MN, United States, 2Department of Radiology, University of Minnesota, Minneapolis, MN, United States, 3Department of Veterinary Clinical Sciences, University of Minnesota, St. Paul, MN, United States, 4Division of Biostatistics, School of Public Health, University of Minnesota, Minneapolis, MN, United States, 5Department of Orthopaedic Surgery, University of Minnesota, Minneapolis, MN, United States
Synopsis
Clinical MRI of patients with juvenile osteochondritis dissecans (JOCD) relies on morphological, spin echo imaging with long echo times that cannot unambiguously distinguish between the cartilaginous, fibrous and osseous tissues within lesions. This 3T study evaluates 34 JOCD lesions from 25 patients using morphological MRI and T2* mapping. JOCD progression was associated with a significant T2* decrease in progeny and interface. Additionally, significantly lower T2* in stage IV progeny and parent bone of stable lesions suggests increased bone density compared to the healthy, control bone. T2* mapping provides quantitative evidence of disease progression which may help inform clinical JOCD management.
INTRODUCTION:
Juvenile osteochondritis dissecans (JOCD) is a developmental joint disorder in children. Non-operative therapy of stable, symptomatic JOCD lesions for 6-12 months fails in about 50% of patients, and unstable lesions are then treated surgically1. Unfortunately, predictors such as age, lesion size, or presence of cysts, fails to reliably predict which lesion will heal and which not1. Clinical, morphological MRI relies on spin echo sequences with long echo times (TE) that cannot unambiguously differentiate between the cartilaginous, fibrous and osseous tissues within JOCD lesions2. T2* mapping has been previously used to evaluate cartilage3, fibrous tissue4 and trabecular bone5. T2* mapping may therefore provide more comprehensive assessment of JOCD lesion composition.The purpose of this study is to evaluate differences in T2* values between: (i) different lesion regions, (ii) disease stages, (iii) and between stable and unstable JOCD lesions.
METHODS:
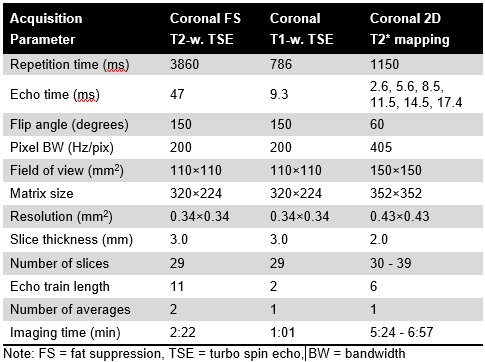
This retrospective, IRB-approved study analyzed morphological and T2* MRI data acquired between 2015 and 2020. Twenty-five patients with JOCD and open femoral growth plate (median age, 12.1 years; 16 boys) were included. In this cohort, 34 knees had JOCD lesions (26 at medial and 8 at lateral femoral condyle), and 13 knees were lesion- and symptoms-free and served as controls.All images were acquired on a 3T MRI (Siemens, Erlangen, Germany) using 1Tx/15Rx phased-array knee coil (Quality Electrodynamics, Mayfield Village, OH). The protocol included morphological, T1- and T2-weighted images for the evaluation of lesion stability as described previously6. A multi-echo gradient recalled echo (GRE) sequence was acquired to calculate T2* relaxation times and to provide short TE images with inverted, CT-like contrast. MRI acquisition parameters are listed in Figure 1. Each lesion was assigned to one JOCD stage according to previously described staging system7 based on short TE GRE images with CT-like contrast.
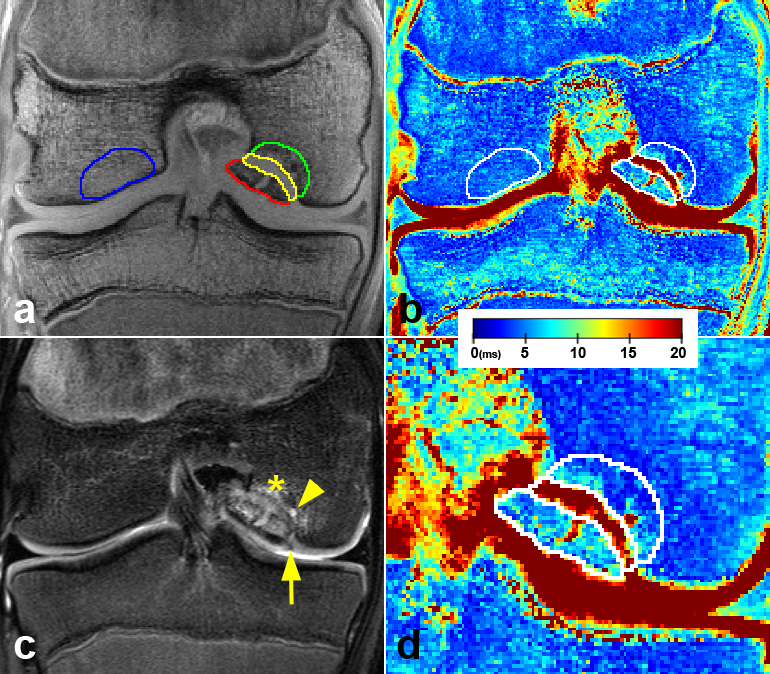
T2* values were calculated by fitting the signal decay of the multi-echo data with a mono-exponential least-square fitting routine in Matlab. Median T2* values were measured in four 3D-regions segmented on T2*-weighted images with the shortest TE using ITK-SNAP. Three regions were segmented within JOCD lesion: (i) within the progeny, (ii) in the parent bone adjacent to progeny, (iii) in the interface between the progeny and the parent bone. One region was selected in the healthy trabecular bone on the condyle opposite to the lesion and served as control (Figure 2). Additionally, 10 randomly selected JOCD knees were also evaluated by the second reader. For statistical analyses, mixed effects regression models followed by Tukey’s post-hoc tests, Spearman rank correlations (ρ) and coefficients of variation (CV) were calculated.
RESULTS:
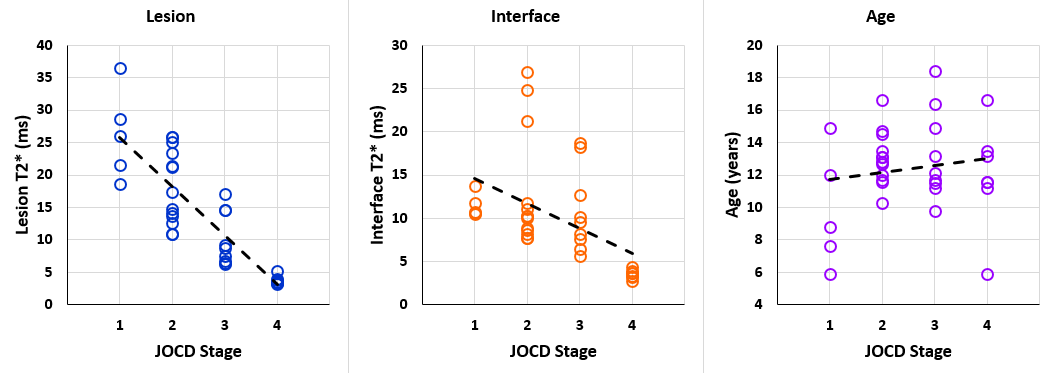
For the evaluation of differences between the JOCD stages and between the different regions, all JOCD lesions were classified into stages: I (n=5), II (n=13), III (n=9), and IV (n=7). Additionally, 11 unstable and 11 stable lesions matched for JOCD stage were compared.Comparison between JOCD Stages. Progeny and interface showed significantly higher T2* at stages I and II compared to stage IV (all p≤0.02). Additionally, significant correlations between the T2* values and the JOCD stage were observed in the progeny (ρ=-0.871; p<0.001) and interface (ρ=-0.649; p<0.001) (Figure 3). No correlations were found in other evaluated regions or between T2* and age.
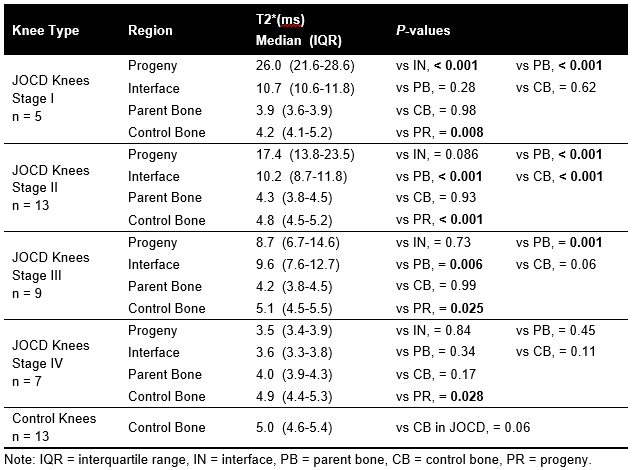
Comparison between Regions. Progeny showed significantly higher T2* than control bone at stages I, II and III (all p≤0.025), but significantly lower T2* than control bone at stage IV (p=0.028) (Figure 4). The interface and the parent bone T2* were not significantly different from the control bone at stage IV.
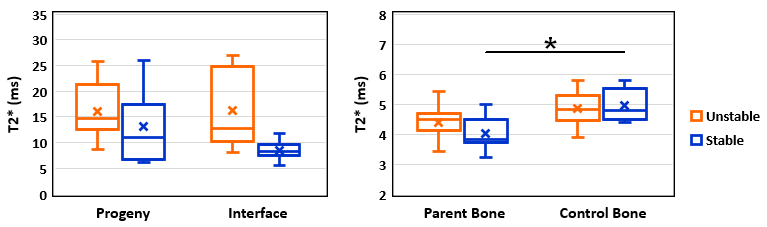
Stable vs. Unstable Lesions. T2* was significantly lower in the parent bone than in the control bone of patients with stable lesions (p=0.009), but not in patients with unstable lesions (p=0.14) (Figure 5). Although interface and parent bone T2* were higher in unstable than in stable lesions, no significant differences in regions were observed between unstable and stable lesions (all p≥0.27). The mean CVs between the two readers ranged from 2.0% in the control bone to 6.9% in the interface.
DISCUSSION:
The progeny T2* at stage I was similar to previously reported T2* of cartilage3 and fibrous tissue4, while the progeny T2* at stage IV was similar to the T2* of healthy trabecular bone. A decrease of T2* in progeny and interface with increasing JOCD stage can be explained by the progressive ossification of lesion7. Higher interface T2* in unstable lesions are likely due to the presence of fluid in the interface that was detected with morphological MRI in 8 of 11 unstable lesions. Significantly lower T2* in stage IV progeny and parent bone of stable lesions is signaling a different composition compared to the healthy, control bone. Previously reported negative correlations of T2* with bone density5 therefore suggest increased bone density in stage IV (healed) progeny and parent bone of stable lesions. Previous histological studies also showed increased bone density in areas of active JOCD lesion repair8.CONCLUSION:
T2* mapping is a reproducible, clinically applicable method that allows evaluation of all JOCD lesion tissues, quantitative measurement of lesion ossification, and assessment of bone density, which are potential predictive markers of JOCD lesion healing. When confirmed in follow-up studies, new T2* biomarkers may help inform clinical management (non-operative versus surgical treatment) of JOCD patients.Acknowledgements
This study was supported by the NIH, NIAMS grants (R01 AR070020, K01 AR070894, T32 AR050938) and NIBIB grant (P41 EB027061).References
1. Krause M, Hapfelmeier A, Moller M, et al., Healing predictors of stable juvenile osteochondritis dissecans knee lesions after 6 and 12 months of nonoperative treatment. Am J Sports Med. 2013; 41(10): 2384-2391.
2. Zbojniewicz AM, Stringer KF, Laor T, Wall EJ. Juvenile Osteochondritis Dissecans: Correlation between Histopathology and MRI. Am J Roentgenol. 2015; 205(1): W114-123.
3. Ludwig KD, Johnson CP, Zbyn S, et al. MRI Evaluation of Articular Cartilage in Patients with Juvenile Osteochondritis Dissecans (JOCD) using T2* Mapping at 3T. Osteoarthritis Cartilage. 2020; 28(9): 1235-1244.
4. Mamisch TC, Hughes T, Mosher TJ, et al. T2 star relaxation times for assessment of articular cartilage at 3 T: a feasibility study. Skeletal Radiol. 2012;41(3):287-292.
5. Maris TG, Damilakis J, Sideri L, et al. Assessment of the skeletal status by MR relaxometry techniques of the lumbar spine: comparison with dual X-ray absorptiometry. Eur J Radiol. 2004; 50(3): 245-256.
6. Kijowski R, Blankenbaker DG, Shinki K, et al. Juvenile versus adult osteochondritis dissecans of the knee: appropriate MR imaging criteria for instability. Radiology. 2008; 248(2): 571-578.
7. Ellermann J, Johnson CP, Wang L, et al. Insights into the Epiphyseal Cartilage Origin and Subsequent Osseous Manifestation of Juvenile Osteochondritis Dissecans with a Modified Clinical MR Imaging Protocol: A Pilot Study. Radiology. 2017; 282(3): 798-806.
8. Krause M, Lehmann D, Amling M, et al. Intact bone vitality and increased accumulation of nonmineralized bone matrix in biopsy specimens of juvenile osteochondritis dissecans: a histological analysis. Am J Sports Med. 2015; 43(6): 1337-1347.
Figures