2956
Deep Cartilage UTE-T2* Shows Compositional Heterogeneity in Patients with Degenerative Meniscus Tears1Orthopaedic Surgery, Stanford University, Stanford, CA, United States, 2Veterans Affairs Palo Alto Health Care System, Palo Alto, CA, United States
Synopsis
This study evaluated deep cartilage and meniscus UTE-T2* against spatially targeted arthroscopic assessments in patients with degenerative meniscus tears to further inform interpretation and utility of in vivo UTE-T2* for different degrees of pathology. While arthroscopic evaluation confirmed that UTE-T2* was elevated in menisci with degenerative fraying and tears, increasing intra-operative cartilage grade was not associated with strictly increasing cartilage UTE-T2*. Instead, in osteoarthritic disease states where the articular surface of cartilage is disrupted, this report suggests that mono-exponential deep cartilage UTE-T2* may not be a reliable indicator of tissue pathology.
Introduction
Utility of compositional MRI UTE-T2* for evaluation of cartilage and meniscus subsurface properties has been shown in pre-osteoarthritis (pre-OA) where patients largely retain intact articular surfaces and the underlying tissue is still relatively healthy.1-6 Compared to pre-OA, patients seeking treatment for degenerative meniscal tears (DMT) exhibit a wider range of cartilage disease.7 Evaluation of deep cartilage and meniscus UTE-T2* against spatially targeted arthroscopic assessments in DMT patients may further inform interpretation and utility of in vivo UTE-T2* for different degrees of pathology. The hypothesis of this study is that articular cartilage and meniscus damage in osteoarthritis (OA) manifest as elevated UTE-T2*. Thus, increasing intra-operative cartilage grade and worsening meniscus status will be associated with increasing UTE-T2* values in deep cartilage and menisci of DMT patients.Methods
Sixty-six subjects (32 DMT, mean age 49±15yrs; 34 uninjured controls, mean age 26±7yrs) participated in these IRB-approved studies and underwent 3T MRI (GE Healthcare) with an 8-channel knee coil. UTE-T2* maps were calculated via mono-exponential fitting T2*-weighted images acquired at eight TEs (32μs -16ms, non-uniform echo spacing) using a radial-out 3-D Cones acquisition.8 Deep articular cartilage (extending from the bone-cartilage interface through half the cartilage thickness) was manually segmented in 4 regions to central, weight-bearing medial and lateral femoral and tibial cartilage (cMFC, cLFC, cMTP, cLTP).4 Anterior and posterior meniscal horns were segmented from medial and lateral compartments (AMM, PMM, ALM, PLM).6 UTE-T2* maps and mean values were calculated with MRIMapper (MIT). In DMT subjects, targeted intraoperative arthroscopic exams, within a median of 11 days following the pre-operative MRI, were conducted in areas corresponding to MRI study regions and were evaluated using a modified Outerbridge scale: (0-normal; 1-softening; 2-partial thickness defect, superficial fissures; 3-fissuring to subchondral bone; 4-exposed subchondral bone). UTE-T2* values were compared to the surgeon’s assessment of meniscus status or grade of cartilage damage as the standard. Normality of all data sets was examined with Shapiro Wilts tests. ANOVA (or Kruskal-Wallis for non-normally distributed data) was used to assess UTE-T2* differences by meniscus status (intact, frayed or torn), by DMT cartilage grade (0,1,2,3,4), and by cartilage status (control, DMT-intact but softened (grade 1), DMT-disrupted (grade 2+)). Bonferroni adjustment accounted for multiple comparisons in post-hoc pairwise analyses.Results
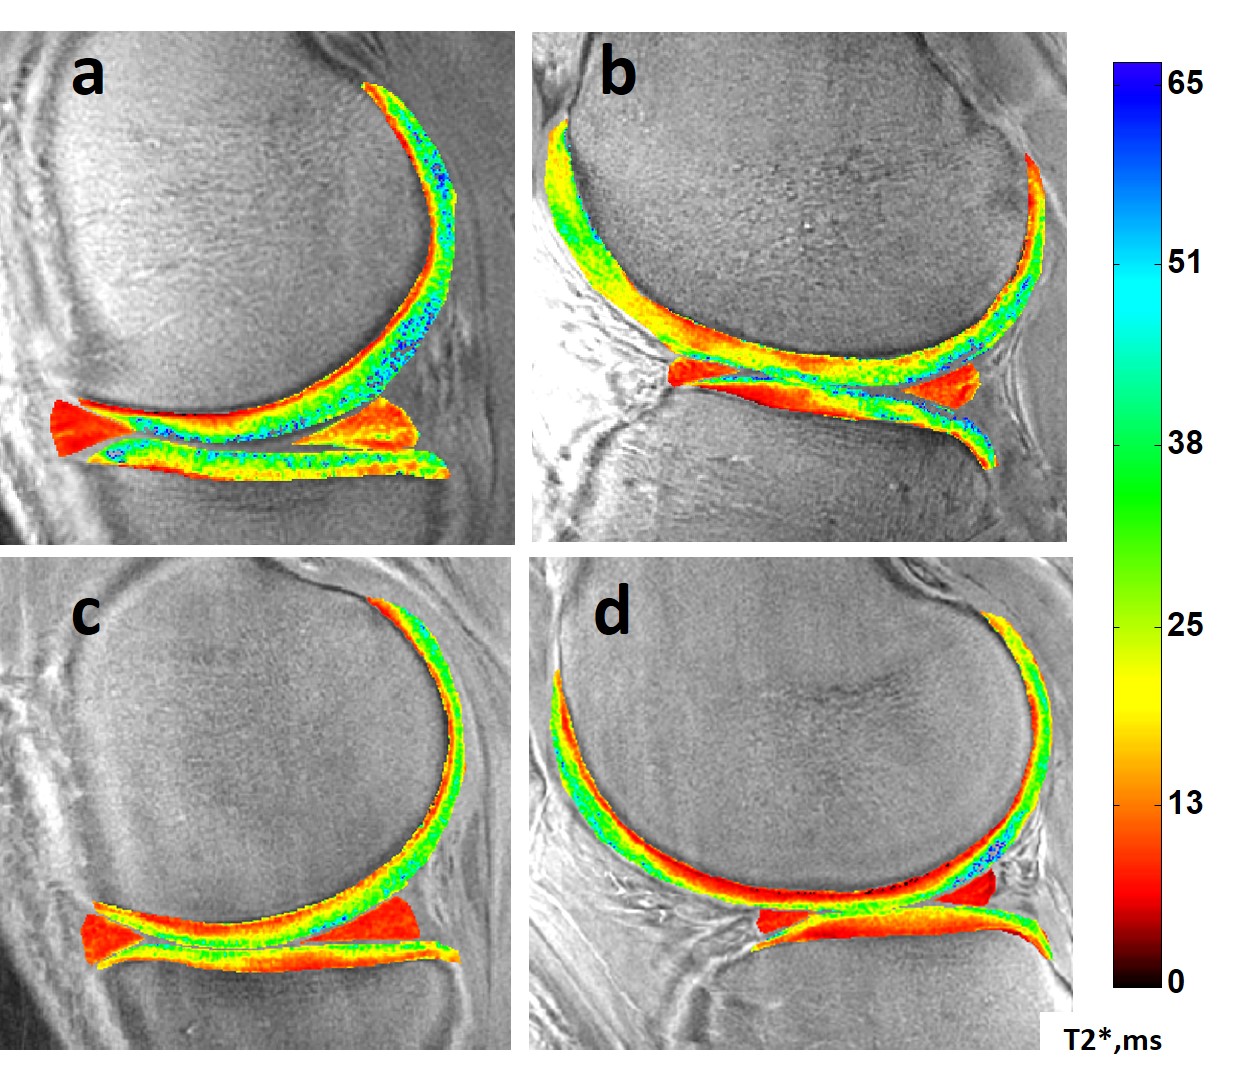
The distribution of arthroscopically confirmed meniscus pathology is shown in Table 1 along with UTE-T2* meniscal indices, determined by averaging UTE-T2* values across anterior and posterior horns of each meniscus. Torn medial, lateral menisci had 37%, 53% higher UTE-T2* indices, respectively, than intact menisci, and there was a trend for higher UTE-T2* values in torn menisci compared to frayed, Table 1. Medial and lateral meniscal indices of controls (n=34) are 39%, 45% lower than those of DMT subjects (n=33; p<0.0005, 0.0005).The distribution of Outerbridge cartilage grades, mean UTE-T2* values for each grade, and differences between grades are shown in Table 2. Additional analyses by cartilage status found that mean deep cartilage UTE-T2* beneath disrupted articular surfaces (grades 2+) was not elevated compared to control levels in any region (p>0.05), Figure 1. Although differences by status did not reach statistical significance, in 3 of 4 regions examined, mean UTE-T2* values of DMT subjects were higher in cartilage that was softened-but-intact and were lower in cartilage with a disrupted articular surface, compared to control levels, Figure 1. Sample DMT and uninjured UTE-T2* maps are shown in Figure 2.
Discussion
Arthroscopic evaluation confirms that UTE-T2* is elevated in menisci with degenerative fraying and tears. This finding extends previous observations of elevated meniscal UTE-T2* observed in ACL-injured patients at heightened risk of developing OA1; 6 to the DMT population where quantitative measures to objectively stratify intrasubstance pathology are lacking.9; 10 Further, it suggests that elevated UTE-T2* in intact menisci might be a precursor to subsequent degenerative fraying or tear. In DMT subjects’ deep cartilage, however, increasing intra-operative cartilage grade was not associated with increasing UTE-T2*. Instead, DMT cartilage with disrupted articular surfaces exhibited variable UTE-T2* values with mean levels similar to or lower than controls. Several prior reports noted decreased T2* with histologically11; 12 and arthroscopically13 confirmed cartilaginous degeneration. While T2* decreases observed in femoral acetabular impingement have been attributed to delamination and subsequent fibrocartilage transformation,14 such phenomena are not commonly described in idiopathic knee OA. Therefore, relatively low UTE-T2* values in deep knee cartilage of DMT patients found to have articular disruptions at arthroscopy may be due to an escape of mobile water from deep cartilage that occurs with the breach of superficial cartilage. Such an escape may cause greater weighting of mono-exponentially calculated UTE-T2* values toward the remaining immobile collagen-bound water protons that exhibit very short T2* relaxation decays.12; 15 Multicomponent T2* analyses may permit better understanding of the deep molecular changes accompanying surface disruptions. The distinction between surface-intact pre-OA and more advanced disease with cartilage surface disruption is important to delineating the potential limitations of UTE-T2* which has been shown to indicate subsurface changes in pre-OA patients whose articular surfaces remain largely intact.1-6Conclusion
In OA disease states where the articular surface is disrupted, this report suggests that mono-exponential deep cartilage UTE-T2* may not be a reliable indicator of tissue pathology.Acknowledgements
NIH RO1 AR052784 (PI – CR Chu) and DOD W81XWH-18-1-0590 (PI-CR Chu) and GE Healthcare for MRI scan time and sequence supportReferences
1. Chu CR, Williams AA, West RV, et al. 2014. Quantitative Magnetic Resonance Imaging UTE-T2* Mapping of Cartilage and Meniscus Healing After Anatomic Anterior Cruciate Ligament Reconstruction. The American Journal of Sports Medicine 42(8):1847-1856.
2. Titchenal MR, Williams AA, Chehab EF, et al. 2018. Cartilage Subsurface Changes to Magnetic Resonance Imaging UTE-T2* 2 Years After Anterior Cruciate Ligament Reconstruction Correlate With Walking Mechanics Associated With Knee Osteoarthritis. Am J Sports Med 46(3):565-572.
3. Williams AA, Titchenal MR, Andriacchi TP, et al. 2018. MRI UTE-T2* profile characteristics correlate to walking mechanics and patient reported outcomes 2 years after ACL reconstruction. Osteoarthritis Cartilage 26(4):569-579.
4. Williams AA, Titchenal MR, Guha A, et al. 2018. MRI UTE-T2* Shows High Incidence of Cartilage Subsurface Matrix Changes 2 Years After ACL Reconstruction. Orthopaedic Research Society, New Orleans, LA, USA:Paper #0173. Notified of high review score and eligible for an award to be determined at the 2018 ORS Annual Meeting.
5. Williams AA, Erhart-Hledik JC, Asay JL, et al. Patient Reported Outcomes and Knee Mechanics Correlate to Patellofemoral Deep Cartilage UTE-T2* 2 years after ACL Reconstruction. Am J Sports Med, in press.
6. Williams A, Qian Y, Golla S, et al. 2012. UTE-T2 * mapping detects sub-clinical meniscus injury after anterior cruciate ligament tear. Osteoarthritis Cartilage 20(6):486-494. 5823016
7. Noble J, Hamblen DL. 1975. The pathology of the degenerate meniscus lesion. J Bone Joint Surg Br 57(2):180-186.
8. Gurney PT, Hargreaves BA, Nishimura DG. 2006. Design and analysis of a practical 3D cones trajectory. Magn Reson Med 55(3):575-582.
9. Englund M, Guermazi A, Lohmander SL. 2009. The role of the meniscus in knee osteoarthritis: a cause or consequence? Radiol Clin North Am 47(4):703-712.
10. Howell R, Kumar NS, Patel N, et al. 2014. Degenerative meniscus: Pathogenesis, diagnosis, and treatment options. World journal of orthopedics 5(5):597-602.
11. Bittersohl B, Miese FR, Hosalkar HS, et al. 2012. T2* mapping of hip joint cartilage in various histological grades of degeneration. Osteoarthritis Cartilage 20(7):653-660.
12. Williams A, Qian Y, Bear D, et al. 2010. Assessing degeneration of human articular cartilage with ultra-short echo time (UTE) T2* mapping. Osteoarthritis Cartilage 18(4):539-546.
13. Ellermann J, Ziegler C, Nissi MJ, et al. 2014. Acetabular cartilage assessment in patients with femoroacetabular impingement by using T2* mapping with arthroscopic verification. Radiology 271(2):512-523.
14. Kohl S, Hosalkar HS, Mainil-Varlet P, et al. 2011. Histology of damaged acetabular cartilage in symptomatic femoroacetabular impingement: an observational analysis. Hip Int 21(2):154-162.
15. Reiter DA, Magin RL, Li W, et al. 2016. Anomalous T2 relaxation in normal and degraded cartilage. Magn Reson Med 76(3):953-962.
Figures