2954
Examining short-term longitudinal and activity-based variability of femoral cartilage T2 relaxation times in healthy subjects
Lauren Watkins1,2, Andrew Schmidt1, Elka Rubin1, Marco Barbieri1, Arjun Desai1,3, Valentina Mazzoli1, Marianne Black1, Garry Gold1,2, Brian Hargreaves1,2,3, Akshay Chaudhari1,4, and Feliks Kogan1
1Radiology, Stanford University, Stanford, CA, United States, 2Bioengineering, Stanford University, Stanford, CA, United States, 3Electrical Engineering, Stanford University, Stanford, CA, United States, 4Biomedical Data Science, Stanford University, Stanford, CA, United States
1Radiology, Stanford University, Stanford, CA, United States, 2Bioengineering, Stanford University, Stanford, CA, United States, 3Electrical Engineering, Stanford University, Stanford, CA, United States, 4Biomedical Data Science, Stanford University, Stanford, CA, United States
Synopsis
Subtle variations in T2 relaxation times may be related to the risk of early osteoarthritis and progression. It is important to estimate T2 variability in healthy individuals as a basis for cross-sectional and longitudinal comparisons. We examine short-term T2 variability in femoral articular cartilage of healthy volunteers over 5 days and 5 weeks and consider the impacts of physical activity. Over both periods, mean T2 change, variance, and CVRMS were small and comparable between knees and cartilage subregions. There was a moderate positive correlation between T2 changes and weekly rated perceived exertion over 5 weeks
Introduction
Osteoarthritis (OA) is a debilitating disease associated with progressive degeneration of articular cartilage in the knee. Studies of quantitative MRI parameters have shown that increases in T2 relaxation times of 9.4-14.1% have been associated with OA progression of OA over a year1,2. Furthermore, individuals with ACL injuries, who are at an increased risk for developing OA, have regions of altered T2 relaxation times as early as 3 months following ACL reconstruction surgery3. Given that small persistent changes in T2 relaxation times over a short period may be related to OA risk, it is important to estimate the variability in these measurements in healthy individuals as a basis for cross-sectional and longitudinal comparisons. Further, there is a lack of knowledge about the impact of everyday physical activity on T2 variability. Intra-session and diurnal variability of several T2 MRI sequences have been examined, with a root mean squared coefficient of variation (CVRMS) ranging from 0.1 – 7%4-6. Longitudinal, short-term variability in healthy subjects has been studied less. Here, we examine the short-term variability of T2 relaxation times in the femoral articular cartilage of healthy, active volunteers daily over 5 consecutive days and weekly over 5 consecutive weeks.Methods
Both knees of three healthy subjects (3 female, age 27.3 ± 2.5 y, BMI 21.23 ± 2.61 kg/m2) were scanned using a bilateral quantitative double-echo in steady-state (qDESS) sequence7,8 on a 3T MR scanner (GE Healthcare) with dual 16-channel flexible coil-arrays. Subjects were scanned at the same time on 5 consecutive days, as well as once weekly for 5 weeks (Figure 1). Subjects’ hours of physical activity, step counts, and Rate Perceived Exertion (RPE) scores for the day and week prior to each scan date were recorded. Femoral articular cartilage on each knee was automatically segmented and subdivided into 6 subregions (anterior/central/posterior for medial and lateral sides, Figure 2B) from day 1 qDESS images using a deep learning-based algorithm and manually corrected as necessary9. All subsequent images for the left and right knees were independently registered to day 1 images using Elastix10. Cartilage T2 relaxation times (ms) were calculated by analytically inverting the qDESS signal model11 for the entire cartilage surface, as well as within each subregion. The mean, standard deviation, and limits of agreement of day-to-day and week-to-week changes in T2 relaxation times were calculated with day 1 as a reference. The root mean squared coefficient of variation (CVRMS, %) was used to assess daily and weekly variability in T2 relaxation times. A Spearman correlation coefficient was used to examine correlations between activity measures and changes in T2 relaxation times, pooled over both knees, over 5 days and 5 weeks (alpha = 0.05).Results
2D projections of femoral cartilage T2 relaxation time maps and difference maps with reference to day 1 are shown in Figure 2. Longitudinal T2 relaxation times within each subregion are shown in Figure 3. The mean change in T2 relaxation time over the entire cartilage surface across both knees of all subjects was -0.7 ± 1.7 ms with a CVRMS of 3.7% over a period of 5 days (Figure 4). Over 5 weeks, the mean change in T2 relaxation time was -0.9 ± 1.2 ms with a CVRMS of 2.7% (Figure 4). Variance over 5 weeks was 1.5 ms2 in the left knee and 0.8 ms2 in the right knee. There was a significant moderate positive correlation between week-to-week changes in T2 relaxation times and weekly RPE (rho = 0.4429, p = 0.0143). However, there was no significant correlation between T2 changes and hours of activity, step count, or RPE for the 24 hours prior to the scan (Figure 5).Discussion
Across the entire cartilage surface, the mean change in T2 relaxation times was less than 1 ms over both 5 days and 5 weeks. The variance and CVRMS over both periods were similar and comparable between subregions. Both 5-day and 5-week CVRMS in this preliminary study are within the range of intra-session variability of T2 measurements (CV 3%7). The short-term variability observed in this study is lower than long-term variability of T2 relaxation times in healthy subjects from prior literature: Mosher et al. observed a CVRMS of 4-14% in healthy and OA subjects over a period of 2-63 days (median 18) using a multisection multiecho sequence12, and Jordan et al. observed a CVRMS of 6.4% over 1 day, 9.3% over 5 months, and 10.7% over a year in healthy subjects scanned using a qDESS sequence13. While there was no correlation between T2 changes and hours of exercise, step counts, or RPE for the day prior to the scan for either time period, over 5 weeks there was a moderate positive correlation between T2 changes and the perceived intensity of physical activity for the week prior to the scan. This suggests that T2 is relatively robust to healthy individuals’ activity levels, but further study is necessary to identify the relevance of a subject’s physical activity on longitudinal studies of cartilage T2.Conclusion
We demonstrated short-term stability of T2 relaxation times in healthy subjects acquired using a simultaneous bilateral qDESS sequence. Physical activity had a very small impact on short-term changes in cartilage T2.Acknowledgements
We receive research support from the Precision Health and Integrated Diagnostics Center at Stanford University, GE Healthcare, Philips, and NIH grants R01-AR077604, R01-EB002524, R01-AR074492, K24-AR062068, and R00-EB022634.References
- Stahl R, Blumenkrantz G, Carballido-Gamio J, et al. MRI-derived T2 relaxation times and cartilage morphometry of the tibio-femoral joint in subjects with and without osteoarthritis during a 1-year follow-up. Osteoarthris Cartilage. 2007; 15:1225-1234.
- Li X, Ma C, Link T, et al. In vivo T(1rho) and T(2) mapping of articular cartilage in osteoarthritis of the knee at 3T MRI. Osteoarthritis Cartilage. 2007; 15:789-797.
- Black M, Yoon D, Young K et al. Detecting early changes in ACL-reconstructed knee cartilage: cluster analysis of T2 relaxation times in superficial and deep cartilage and ADC analysis. Proc Intl Soc Mag Reson Med. 2019: abstract #1322.
- Glaser C, Mendlik T, Dinges J et al. Global and regional reproducibility of T2 relaxation time measurements in human patellar cartilage. Magn Reson Med. 2006; 56(3):527-534.
- Li X, Wyatt C, Rivoire J, et al. Simultaneous acquisition of T1p and T2 quantification in knee cartilage: repeatability and diurnal variation. J Magn Reson Imaging. 2014; 39(5):1287-1293.
- Kessler D, MacKay J, McDonald S et al. Effectively measuring exercise-related variations in T1p and T2 relaxation times of healthy articular cartilage. J Magn Reson Imaging. 2020; 52(6): 1753-1764.
- Chaudhari A, Black M, Eijgenraam S, et al. Five-minute knee MRI for simultaneous morphometry and T2 relaxometry of cartilage and meniscus and for semiquantitative radiological assessment using double-echo in steady-state at 3T: Biomarker acquisition with 5-minute DESS. J Magn Reson Imaging. 2017; 47(5): 1328-1341.
- Kogan F, Levine E, Chaudhari A et al. Simultaneous bilateral knee MR imaging. Magn Reson Med. 2018; 80(2): 529-537.
- Desai A, Barbieri M, Mazzoli M et al. DOSMA: A deep-learning, open-source framework for musculoskeletal MRI analysis. Proc Intl Soc Mag Reson Med. 2019: abstract #1106.
- Klein S, Staring M, Murphy M et al. Elastix: a toolbox for intensity based medical image registration. IEEE Trans Med Imaging. 2010; 29(1): 196-205.
- Sveinsson B, Chaudhari A, Gold G et al. A simple analytic method for estimating T2 in the knee from DESS. Magn Reson Imaging. 2017; 38: 63-70.
- Mosher T, Zhang Z, Reddy R et al. Knee articular cartilage damage in osteoarthritis: analysis of MR image biomarker reproducibility in ACRIN-PA 4001 multicenter trial. Radiology. 2011; 258(3): 832-842.
- Jordan C, McWalter E, Monu U et al. Variability of CubeQuant T1p, quantitative DESS T2, and cones sodium MRI in knee cartilage. Osteoarthritis Cartilage. 2014; 22(10): 1559-1567.
Figures
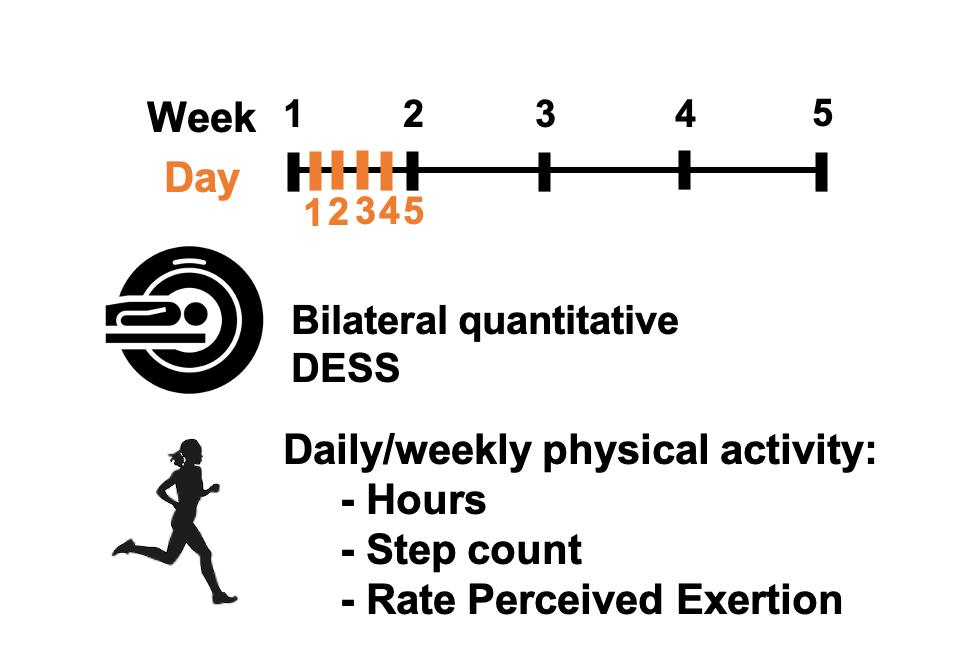
Both knees of 3 healthy female subjects were scanned using a bilateral quantitative double-echo in steady-state (qDESS) sequence on a 3T MRI system. Subjects were scanned daily for 5 consecutive days and weekly for 5 consecutive weeks. At each timepoint, the subjects recorded their hours of physical activity, step count, and Rate Perceived Exertion (RPE) for the 24 hours and week prior to the scan date.
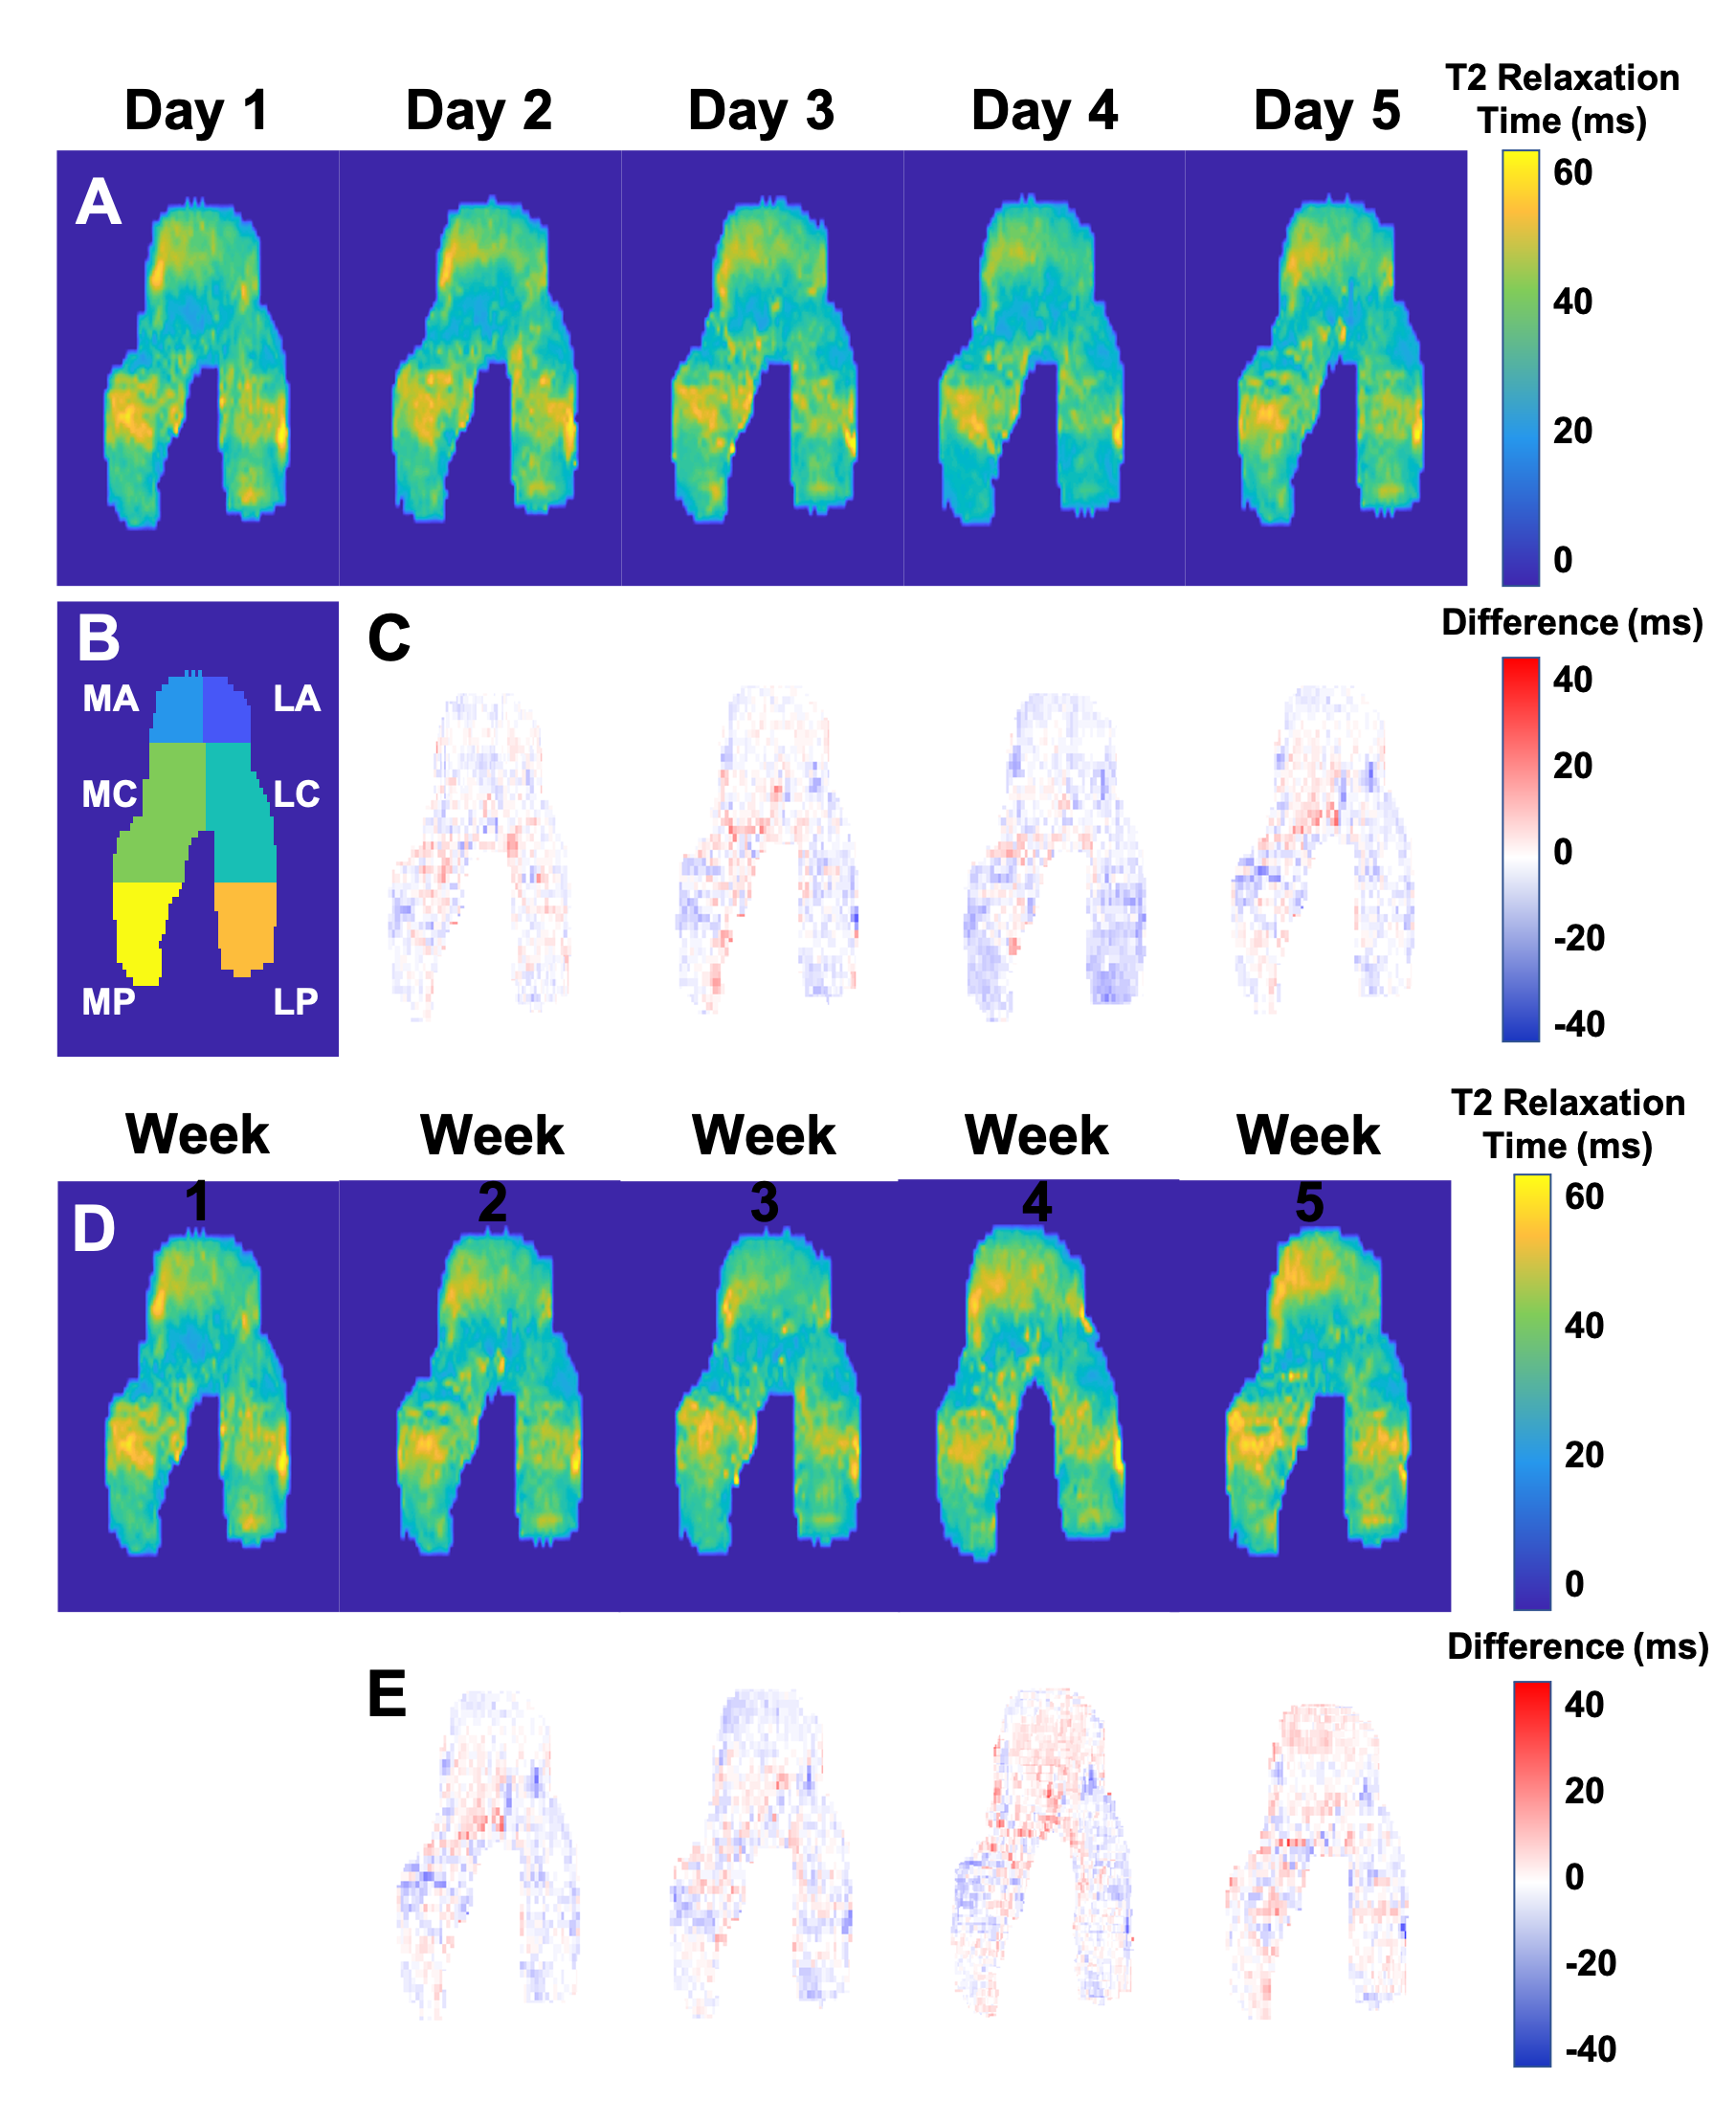
Representative 2D projections of femoral articular cartilage T2 relaxation time maps for the right knee (left not shown) of a subject scanned daily for 5 days [A] and weekly for 5 weeks [D]. Differences in T2 values at each timepoint were calculated with reference to the day 1 scan [C, E]. Variability between timepoints was calculated across the femoral surface, as well as within the anterior (A), central (C), and posterior (P) regions of the medial (M) and lateral (L) portions of the femur [B].
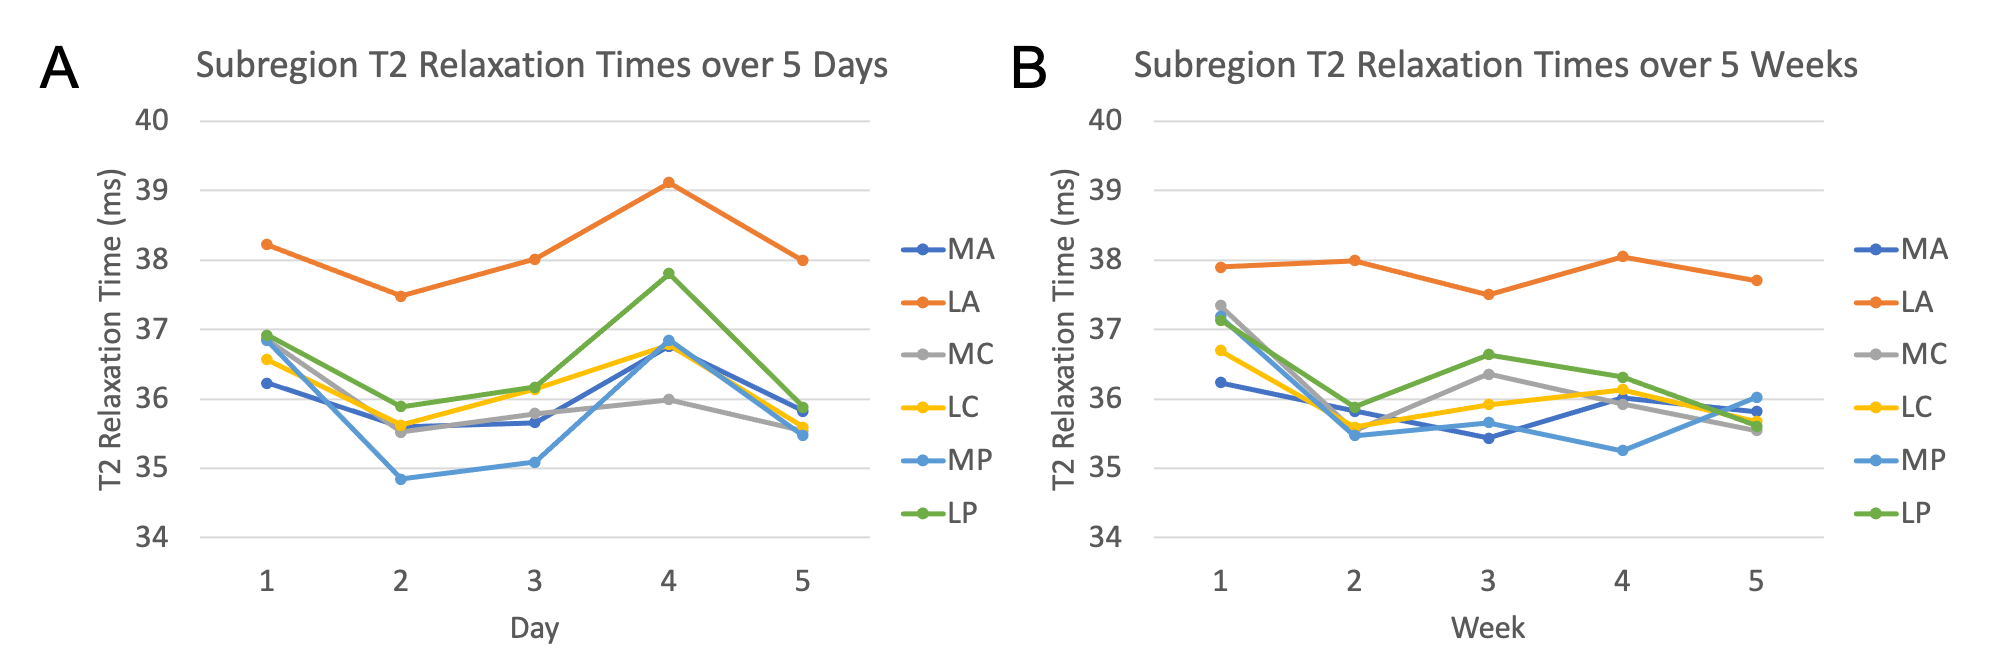
T2 relaxation times were calculated for six subregions of the femoral articular cartilage: the anterior (A), central (C), and posterior (P) regions of the medial (M) and lateral (L) sides of the cartilage surface. Mean T2 relaxation times within each subregion, averaged across all subjects and both knees, were relatively stable over a period of 5 consecutive days [A] and 5 consecutive weeks [B], with the highest T2 values in the lateral anterior subregion at all timepoints.
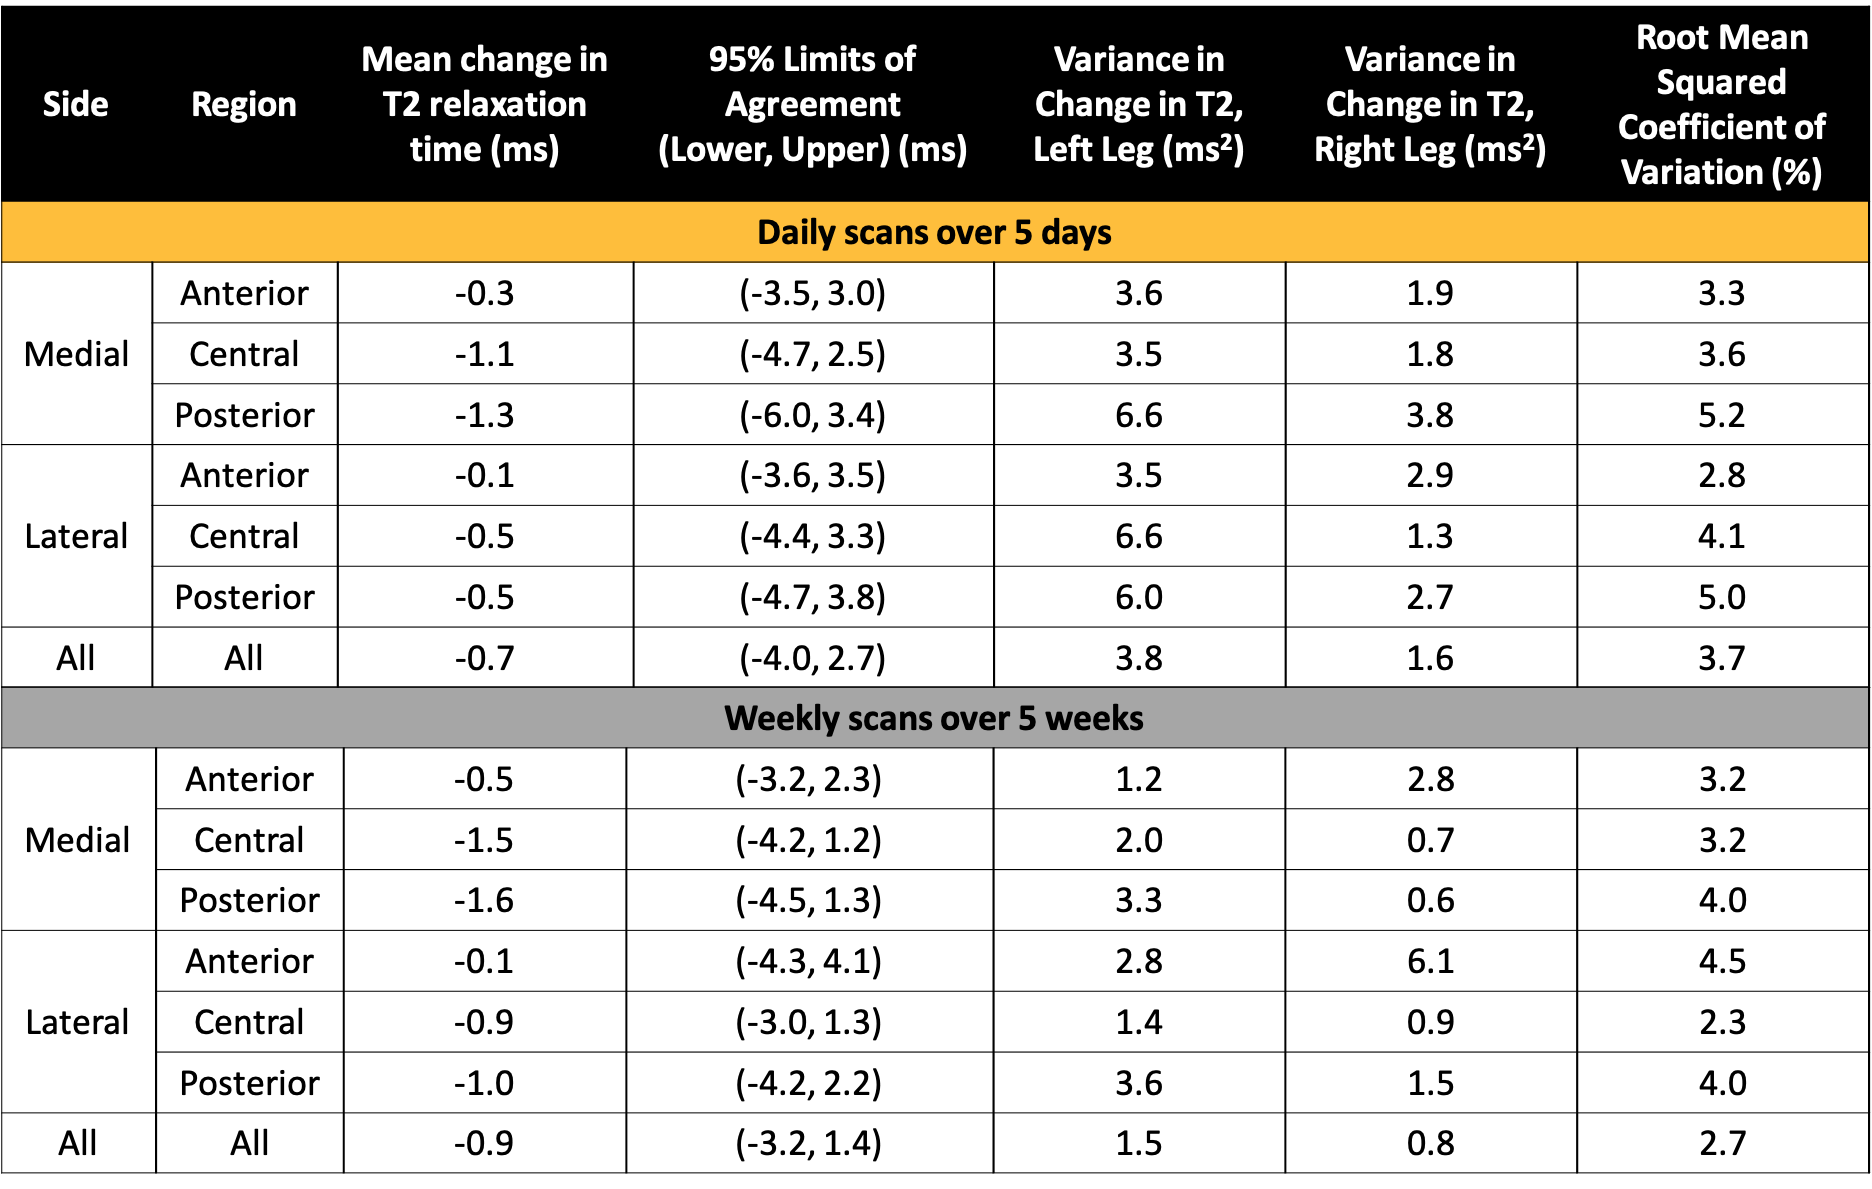
Descriptive statistics for subjects scanned daily for five consecutive days (top) and weekly for five consecutive weeks (bottom).
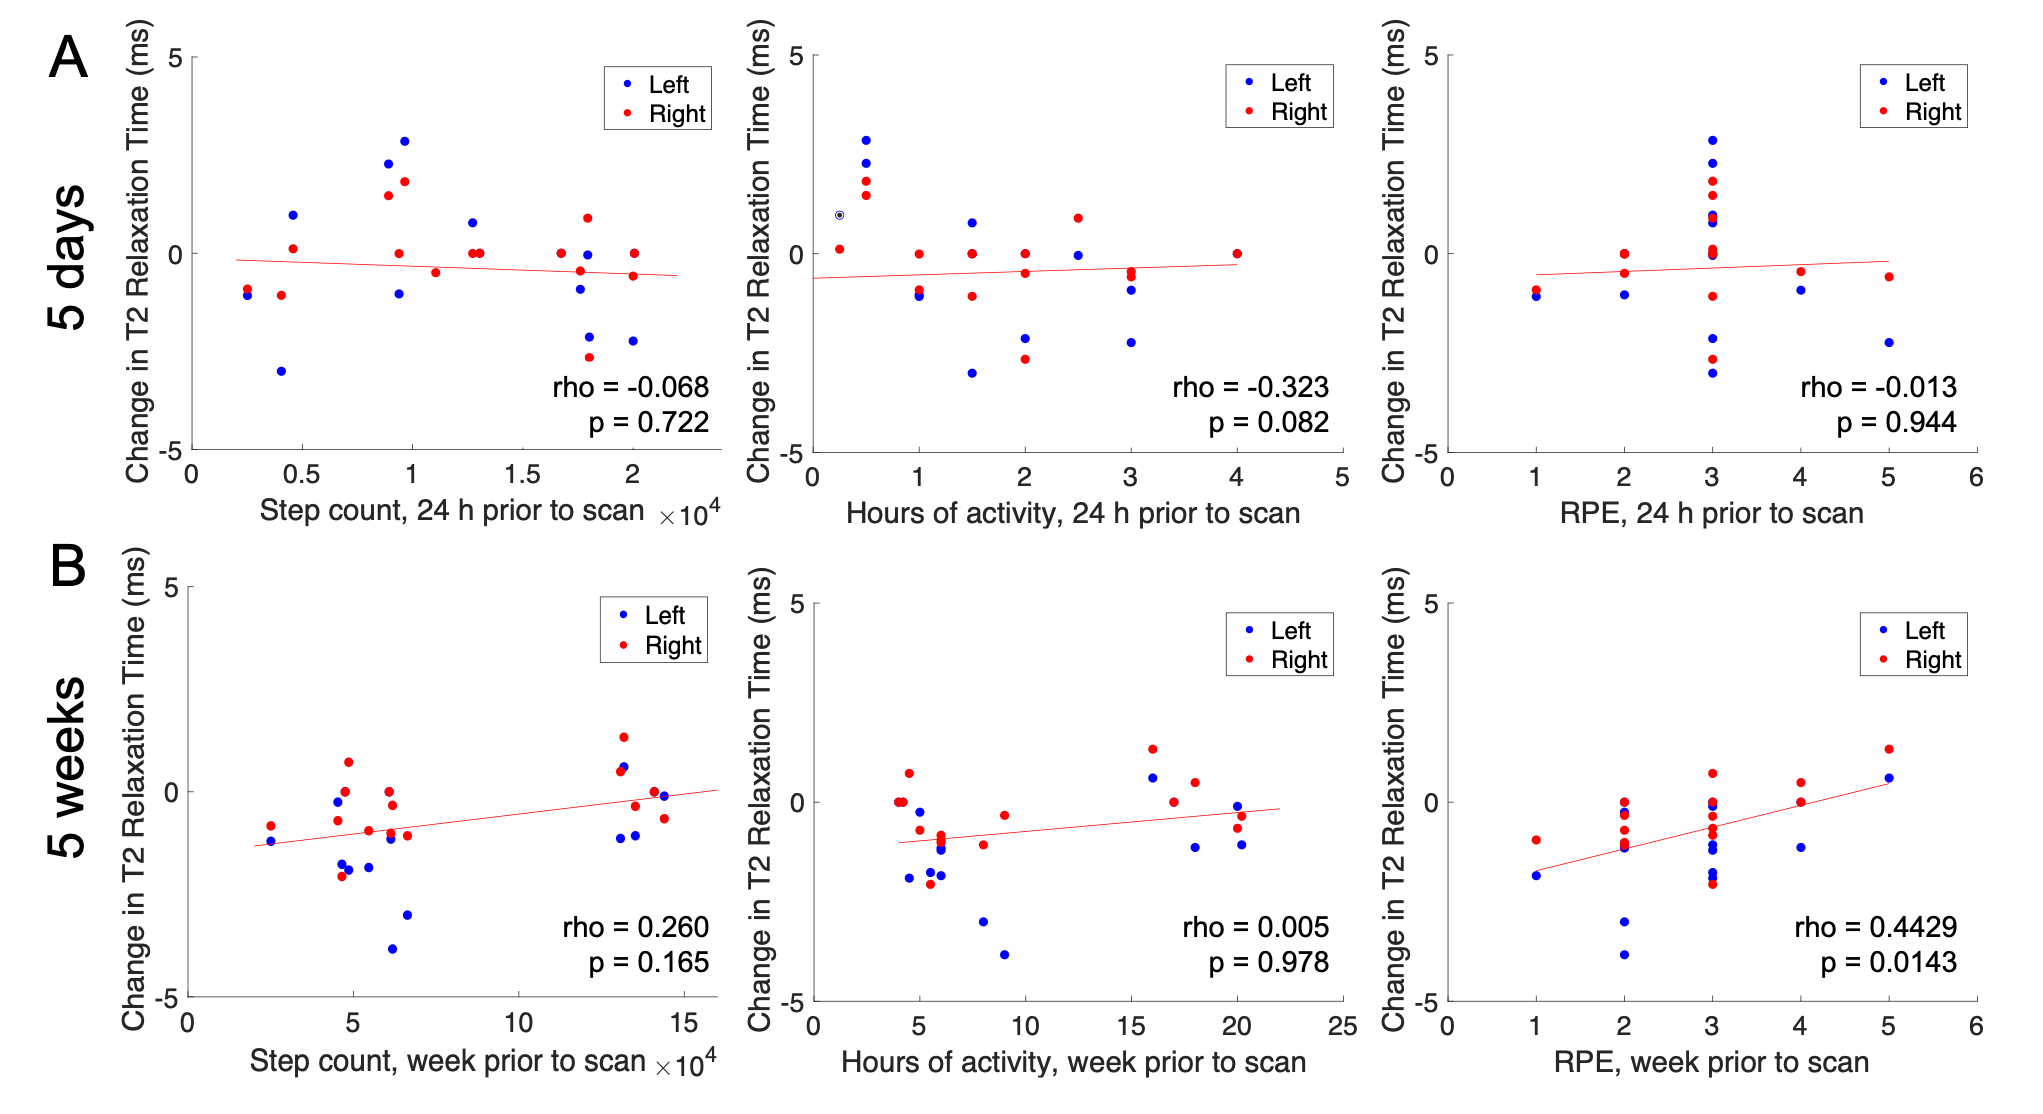
A Spearman’s correlation coefficient (rho) was used to examine relationships between T2 changes and physical activity. For subjects scanned once daily for 5 days [A], there were no significant correlations between changes in T2 and step count, hours of exercise, or Rate Perceived Exertion (RPE) in the 24 hours prior to the scan. For subjects scanned once weekly for 5 weeks [B], there was a significant correlation between the change in T2 and RPE for the 7 days prior to the scan.