2952
Decreased collagen content in tendons of patients with osteoporosis and osteopenia detected with ultrashort echo time cones MRI1Radiology, University of California, San Digeo, La Jolla, CA, United States, 2Orthopaedic Surgery, University of California, San Digeo, La Jolla, CA, United States, 3Radiology Service, VA San Diego Healthcare System, San Diego, CA, United States, 4Radiology, VA San Diego Healthcare System, La Jolla, CA, United States
Synopsis
Bone and tendon comprise a highly interactive mechanical unit. Investigating tendons quality during osteoporosis and osteopenia progress is of great interests. Clinical MRI sequences are not often capable of directly visualizing tendon because of the tissue’s short T2. Ultrashort echo time (UTE) MRI combined with magnetization transfer (MT) modeling (UTE-MT) has demonstrated promise as a quantitative technique that is resistant to the magic angle effect. Lower leg tendons in osteopenia and osteoporosis patients were compared with healthy subjects via UTE-MT. Macromolecular fraction (MMF) obtained from UTE-MT modeling showed a significant reduction in osteopenia and osteoporosis patients compared with healthy subjects.
INTRODUCTION
Bone and tendon comprise a highly interactive mechanical unit 1–3. Anabolic hormone levels and inflammatory cytokine activity in addition to anabolic or catabolic molecules secreted by either of these tissues can affect cell activity in the other 4–7. Bone loss in osteoporosis (OPo) and in its earlier stage disease, osteopenia (OPe), may be coupled with reduction in tendon quality. Using quantitative non-invasive methods to evaluate tendon quality during disease progression is of critical interest for improving the diagnosis and treatment of OPe and OPo.Tendons are comprised of a predominantly parallel arrangement of collagen fibers. Clinical magnetic resonance imaging (MRI) sequences are not often capable of directly visualizing tendons. Fortunately, ultrashort echo time MRI (UTE-MRI) with TE<50 μs can be used to image the tendons for quantitative assessment 8,9. UTE-MRI combined with magnetization transfer (MT) modeling (UTE-MT) has recently been introduced as a technique for indirect measurement of macromolecular proton fraction (MMF)—a measure of collagen content—in different musculoskeletal tissues. Two-pool UTE-MT modeling has demonstrated promise as a clinically compatible quantitative technique that is resistant to the magic angle effect, a phenomenon which has posed technical challenges to the development of quantitative MRI methods 10,11. UT-MT provides multiple parameters, including MMF, macromolecular relaxation time (T2mm), and exchange rates, and has recently been used to detect age-related changes in tibialis tendon 12.
This study investigated differences in lower leg tendon quality between healthy control (Ctrl), OPe, and OPo subjects using UTE-MT.
METHODS
The lower legs of 30 healthy control (Ctrl, 36±19 years, subjects under 40 or postmenopausal with T-score>-1), 14 OPe (n= 14, 72±6 years, -1>T-score>-2.5), and 31 OPo (73±6 years, T-score<-2.5) female subjects were imaged on a 3T clinical scanner (MR750, GE Healthcare Technologies, WI) using an eight-channel T/R knee coil. Institutional review board approval and written informed consent were obtained for all recruited subjects. The imaging slab was centered at the tibial midshaft. To measure T1 as a prerequisite for two-pool MT modeling, an actual flip angle-variable repetition time (AFI-VTR) sequence (AFI: TE=0.032ms, TRs=20,100ms, FA=45˚; VTR: TE=0.032ms, TRs=20, 80, 150ms, FA=45˚) was performed 13. Additionally, a 3D-UTE-Cones-MT sequence (pulse power=500°, 1000°, and 1500°; frequency offset=2, 5, 10, 20, and 50kHz; FA=7˚; 9 spokes per MT preparation) was performed for two-pool MT modeling 14–16. Field-of-view, matrix dimension, pixel size, slice thickness, and total scan time were 14cm, 160×160, 0.87mm, 5mm, and 32 minutes, respectively.For each subject, average MMFs in the anterior tibialis tendon (ATT), posterior tibialis tendon (PTT), and proximal Achilles tendon (PAT) were estimated using UTE-MT modeling performed on a representative slice. Student’s t-test was used to compare between healthy Ctrl, OPo, and OPe cohorts. P-values <0.05 were considered significant. All analyses were performed using MATLAB (Mathworks, MA, USA).
RESULTS
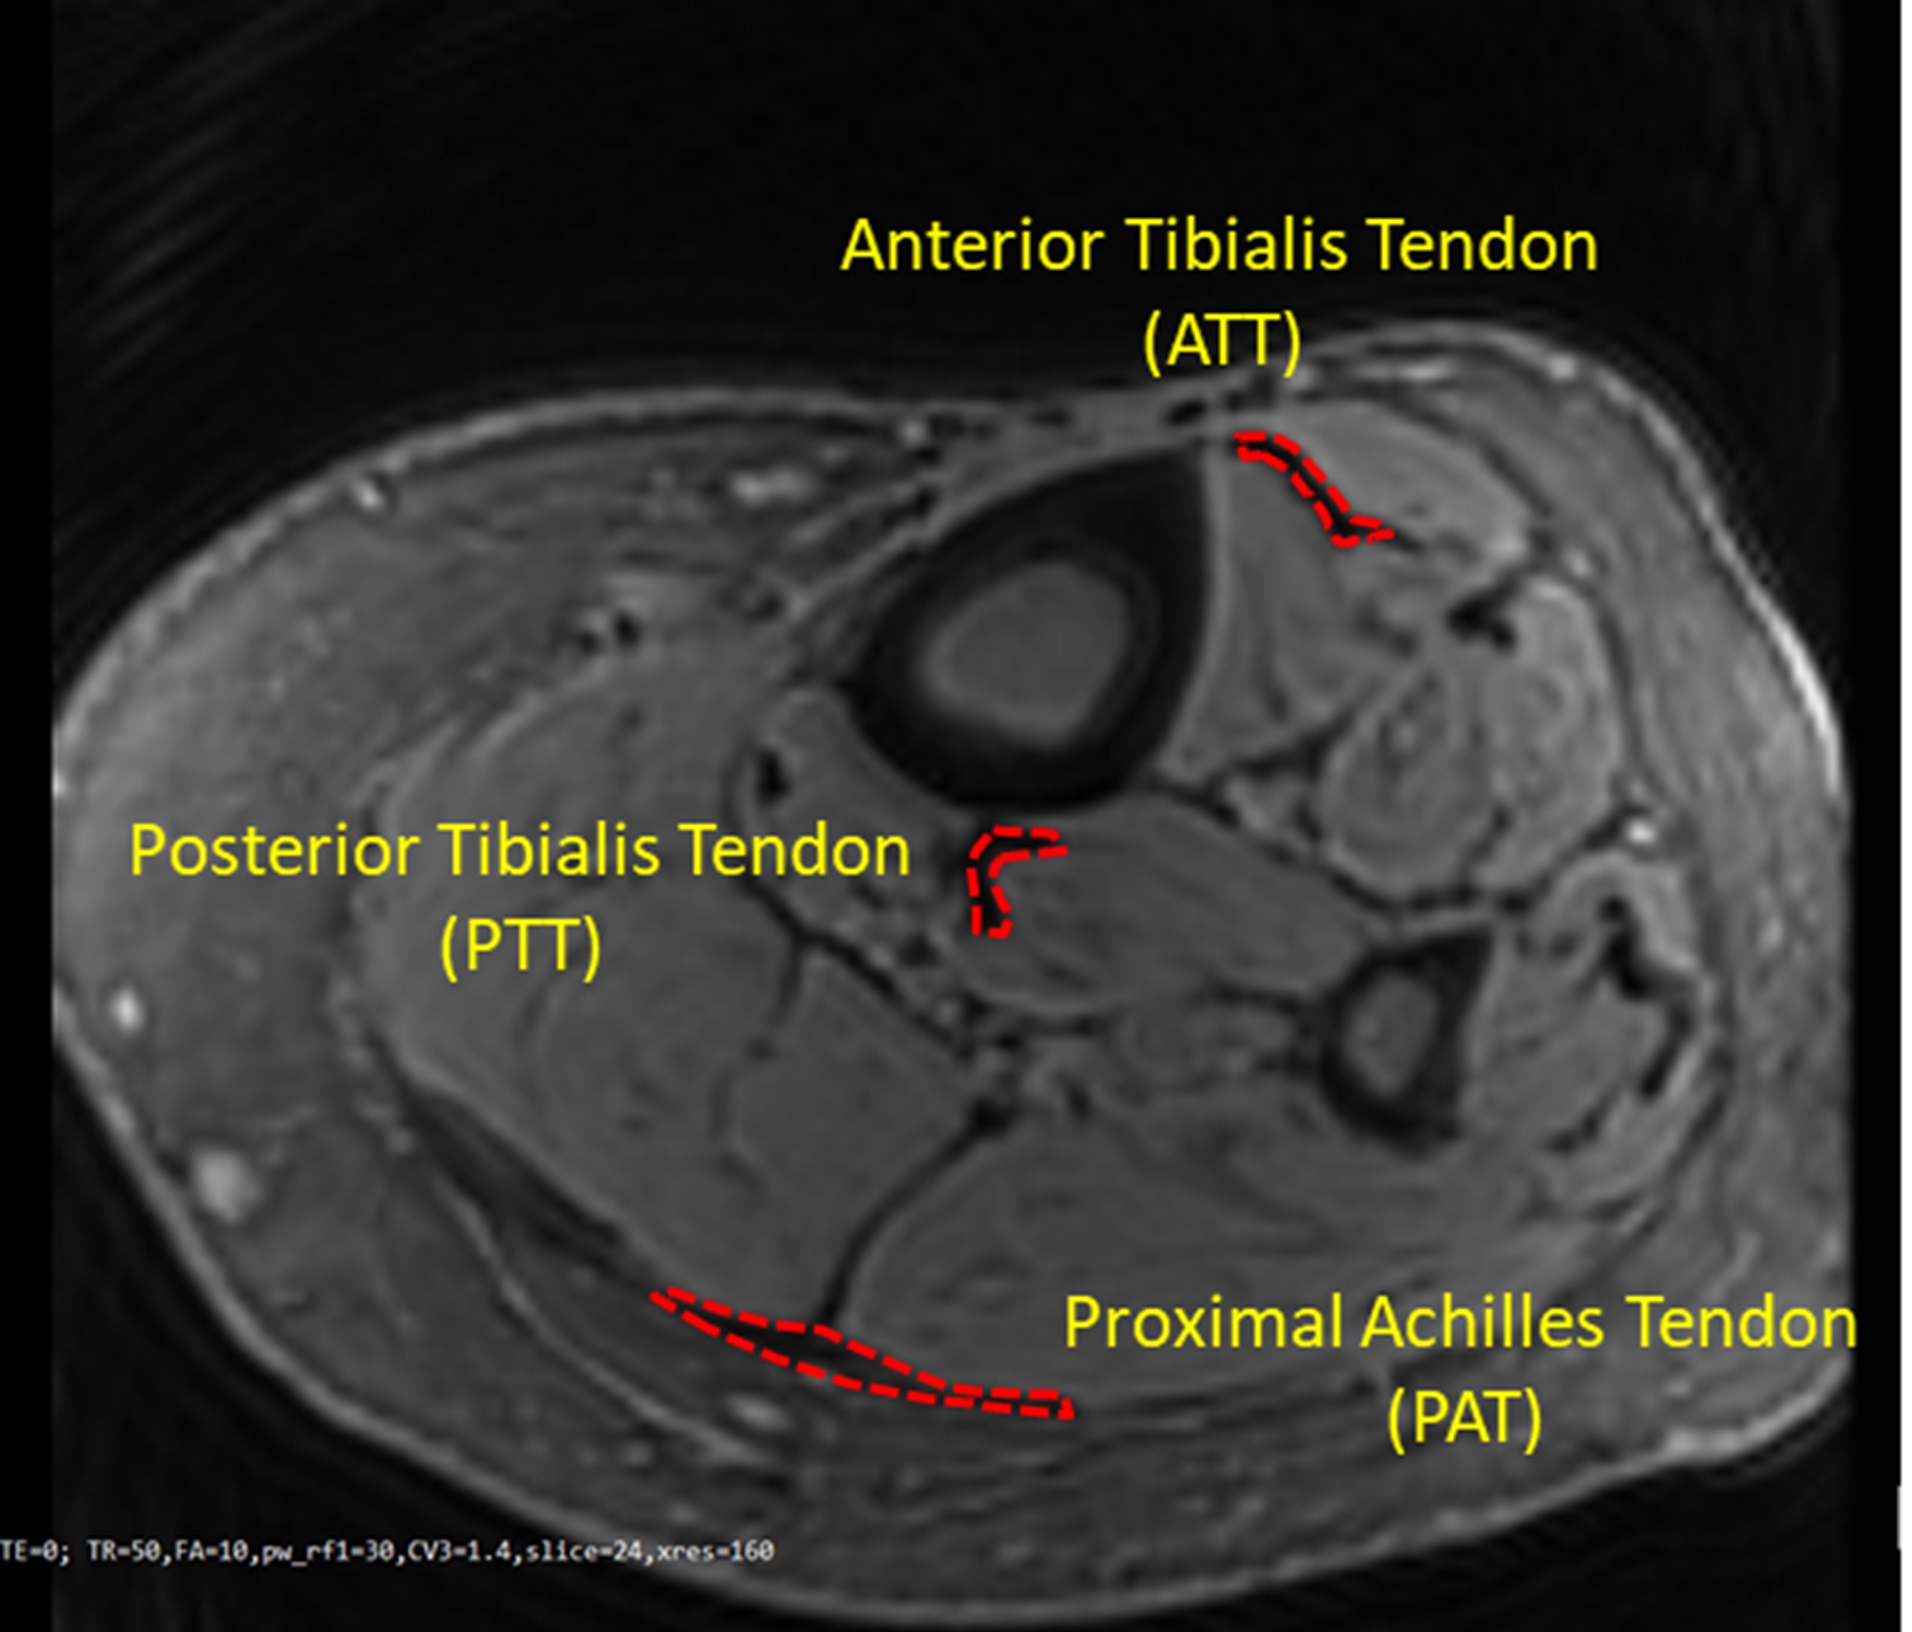
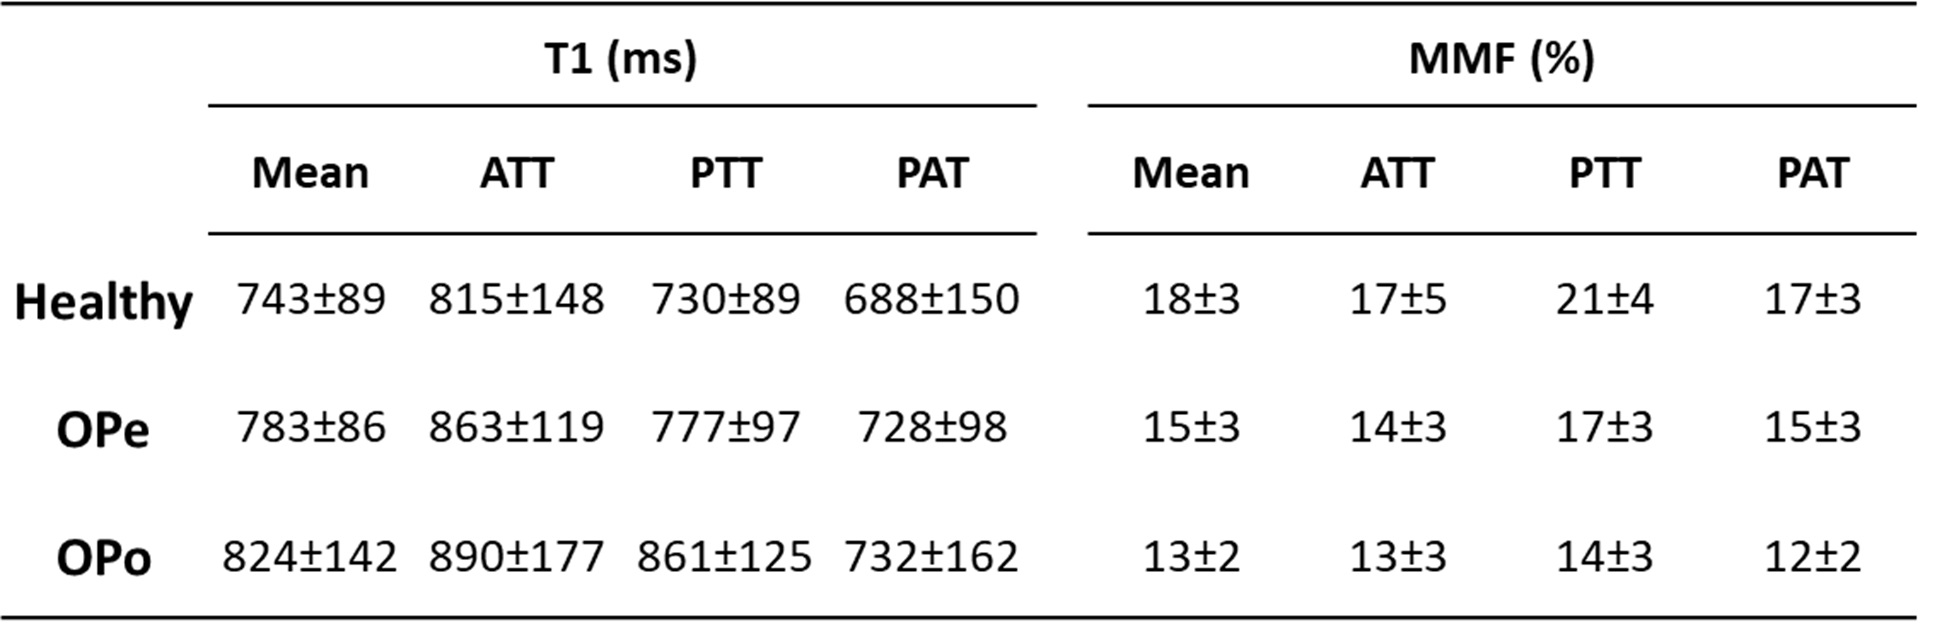
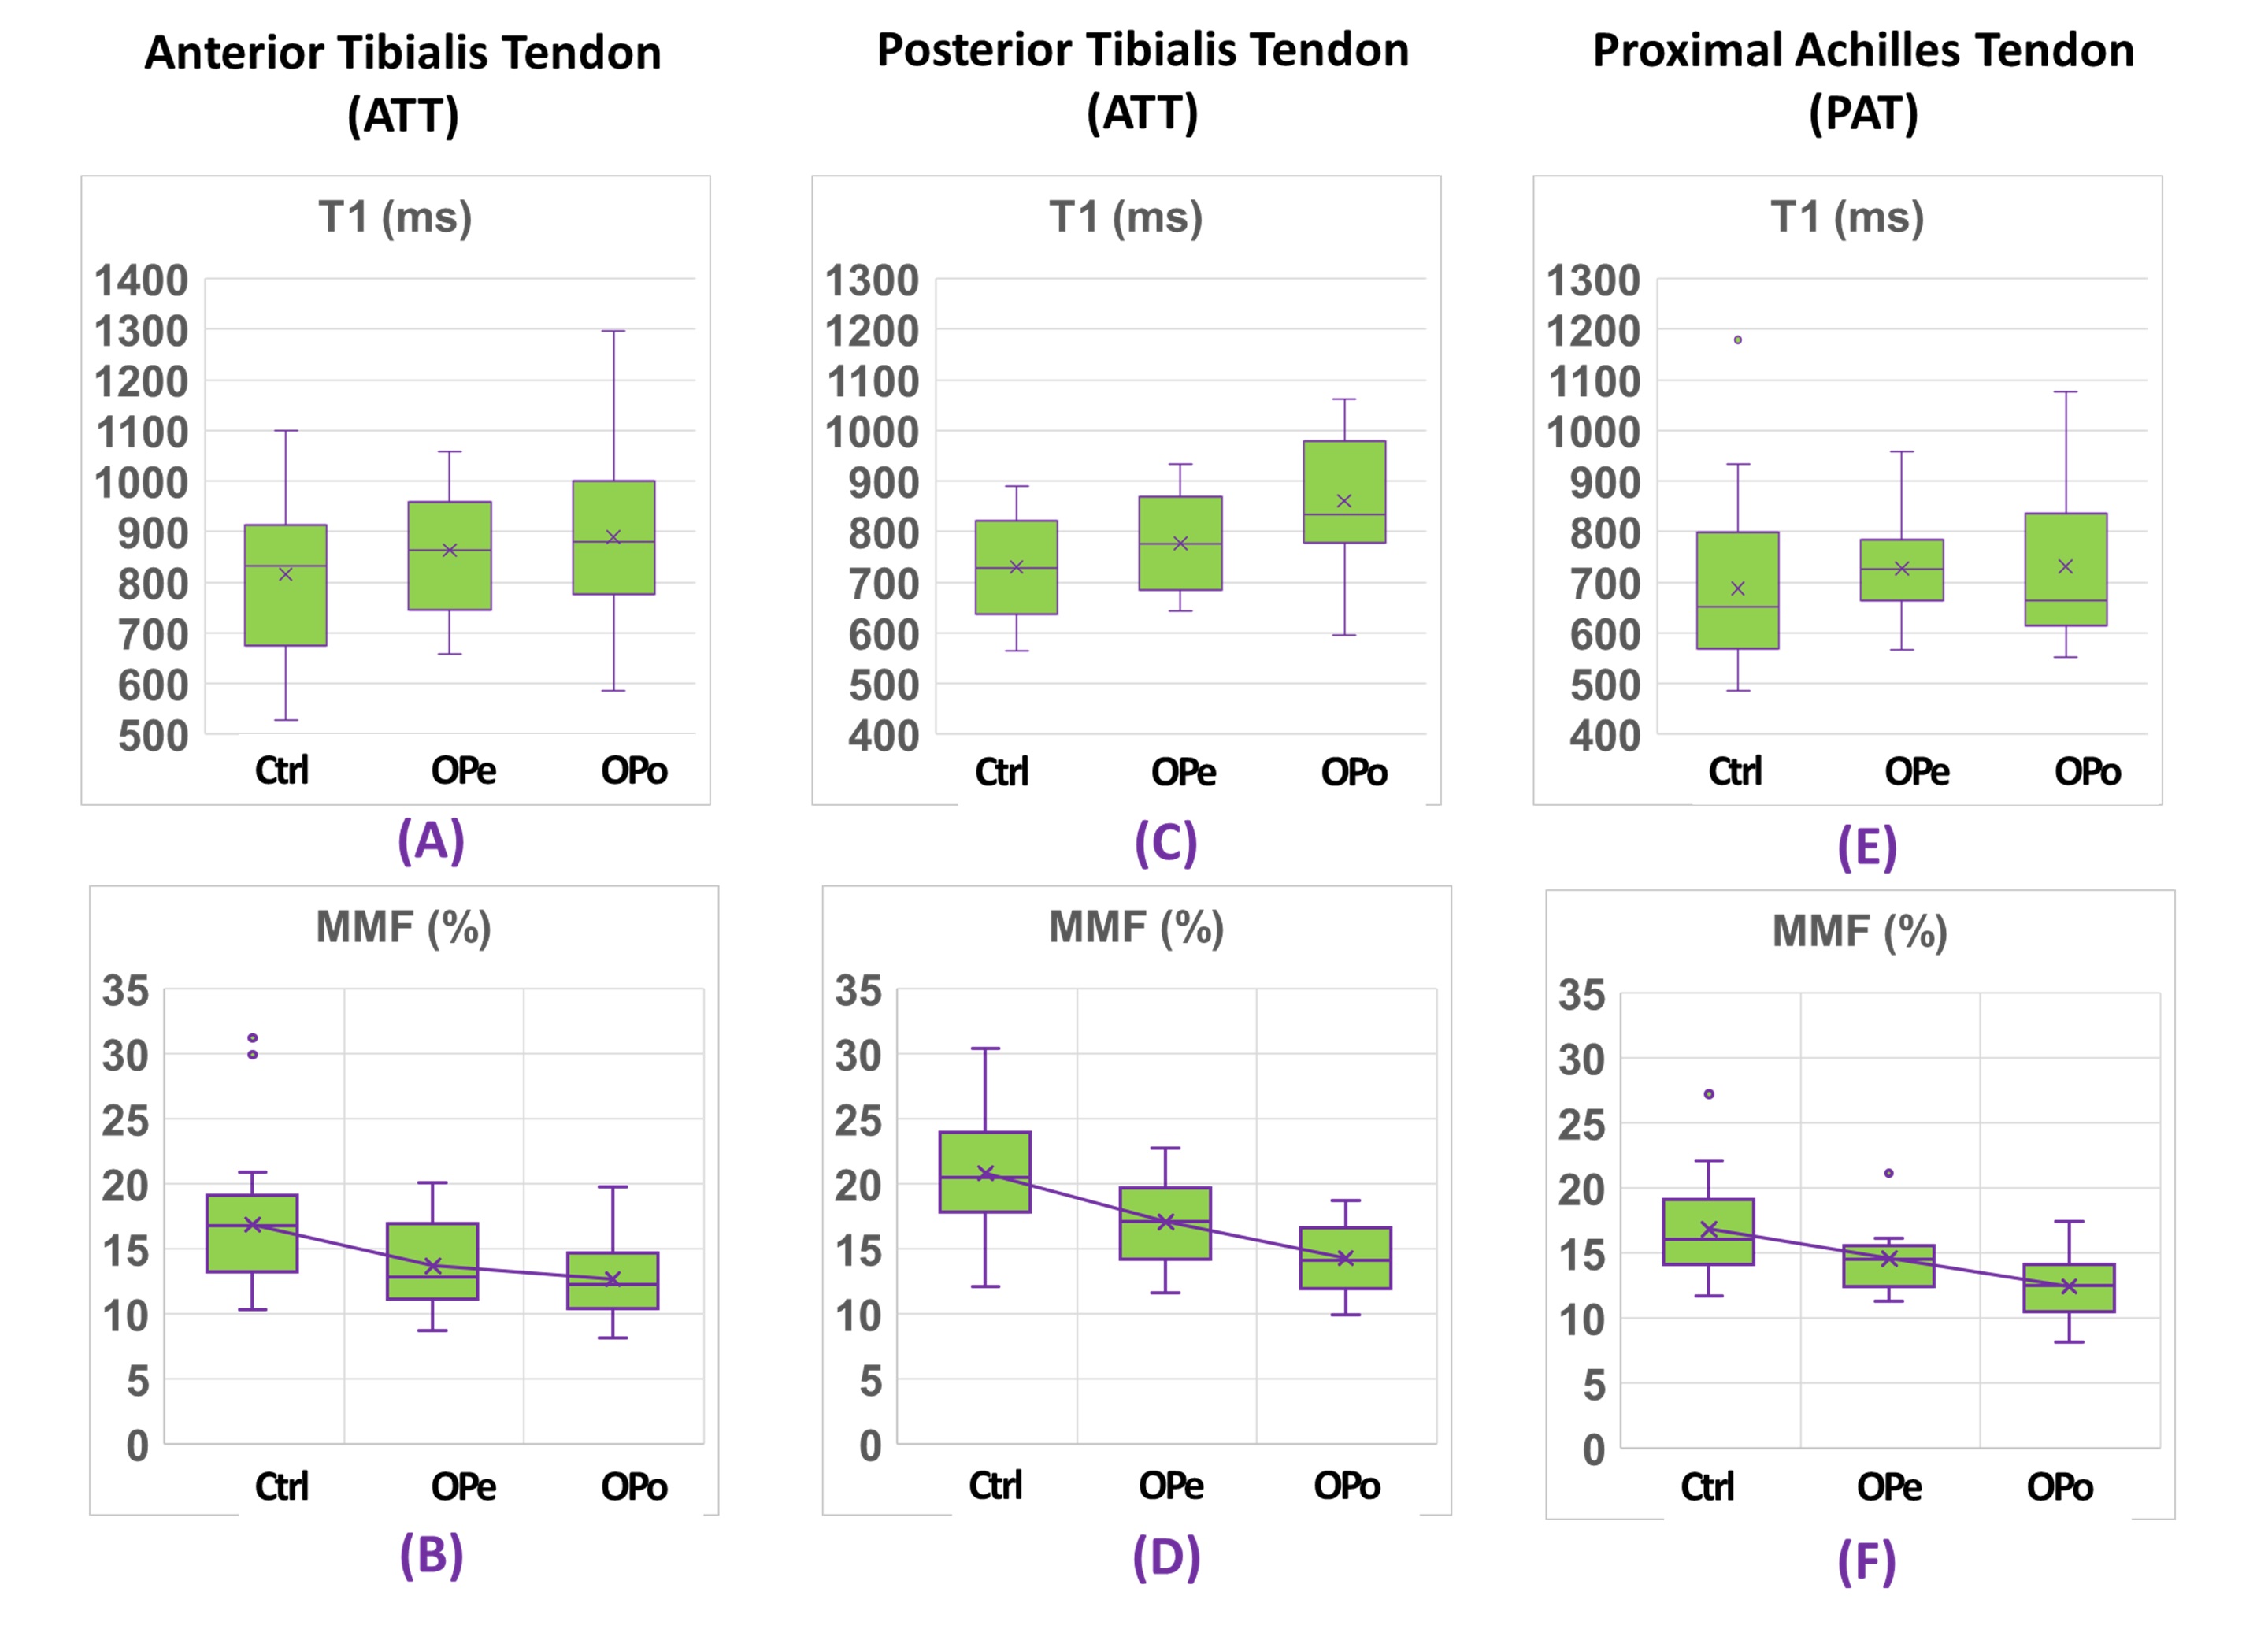
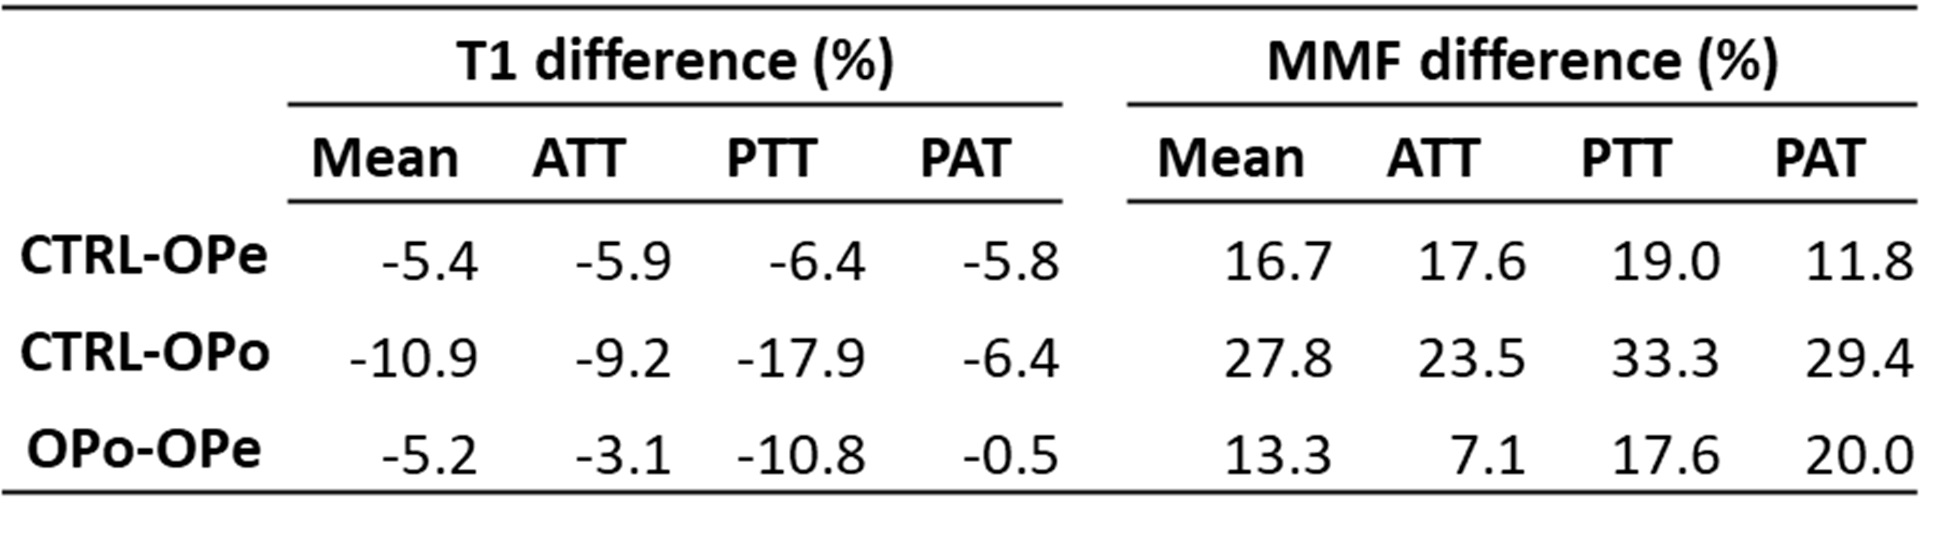
Figure 1 shows a representative axial image using the Cones UTE-MRI sequence. ATT, PTT, and PAT are indicated using red contours. Average MMF and T1 values are presented in Figure 2 (Table 1) for Ctrl, OPe, and OPo cohorts within ATT, PTT, and PAT tendons. Student’s t-test showed significant differences between OPe, OPo, and Ctrl cohorts in T1 and MMF values. Figure 3 depicted average, median, standard deviation, first, and third quartiles of T1 and MMF values for each cohort using whisker’s boxplots. As presented in Figure 4 (Table 2), average MMF of tendon in OPe patients was 16.7% lower than in the Ctrl cohort, while average MMF in lower leg tendon of OPo patients was 27.8% lower compared with the Ctrl cohort. The largest percentage differences in T1 and MMF were found in PTT tendon. For all studied tendons, MMF showed larger percentage differences between cohorts compared with T1.DISCUSSION
MMF obtained from UTE-MT modeling, as a surrogate measure for collagen content, showed a significant reduction in OPe and OPo patients compared with the healthy control group. MMF difference between Ctrl and OPo cohorts was higher than previously published age-related differences (~28% vs. ~20%) 12. MMF differences between OPe and OPo cohorts (~13%) imply that the tendon quality reduction in OPo patients is likely caused by aging combined with disease-related changes in collagen turnover.CONCLUSION
This study highlighted UTE-MT as a useful quantitative method to assess the impact of OPo and aging on human tendons. UTE-MT detected quality reductions in tendon of OPo and OPe patients, in which OPo demonstrated approximately 50% more tendon quality reduction compared with OPe. Interestingly, such quality assessment of tendon can be performed simultaneously with UTE-MRI-based bone assessment 17.Acknowledgements
The authors acknowledge grant support from the NIH (R01AR068987, R01AR075825, R01AR062581, R21AR075851), Veterans Affairs (I01RX002604 and I01CX001388), and GE Healthcare.References
1. Cederholm T, Cruz-Jentoft AJ, Maggi S. Sarcopenia and fragility fractures. Eur J Phys Rehabil Med. 2013;49(1):111-117.
2. Edwards MH, Dennison EM, Aihie Sayer A, Fielding R, Cooper C. Osteoporosis and sarcopenia in older age. Bone. 2015;80:126-130. doi:10.1016/j.bone.2015.04.016
3. Frost HM. Bone’s Mechanostat: A 2003 Update. Anat Rec - Part A Discov Mol Cell Evol Biol. 2003;275(2):1081-1101. doi:10.1002/ar.a.10119
4. Tagliaferri C, Wittrant Y, Davicco MJ, Walrand S, Coxam V. Muscle and bone, two interconnected tissues. Ageing Res Rev. 2015. doi:10.1016/j.arr.2015.03.002
5. Girgis CM, Mokbel N, DiGirolamo DJ. Therapies for musculoskeletal disease: Can we treat two birds with one stone? Curr Osteoporos Rep. 2014. doi:10.1007/s11914-014-0204-5
6. Urban RJ. Growth hormone and testosterone: Anabolic effects on muscle. Horm Res Paediatr. 2011;76(SUPPL. 1):81-83. doi:10.1159/000329184
7. Giustina A, Mazziotti G, Canalis E. Growth hormone, insulin-like growth factors, and the skeleton. Endocr Rev. 2008. doi:10.1210/er.2007-0036
8. Aria Ashir BS, Ma Y, Jerban S, et al. Rotator Cuff Tendon Assessment in Symptomatic and Control Groups Using Quantitative MRI. J Magn Reson Imaging. 2020. doi:10.1002/jmri.27115
9. Chang EY, Du J, Chung CB. UTE imaging in the musculoskeletal system. J Magn Reson Imaging. 2015;41(4):870-883. doi:10.1002/jmri.24713
10. Ma Y, Shao H, Du J, Chang EY. Ultrashort echo time magnetization transfer (UTE-MT) imaging and modeling: magic angle independent biomarkers of tissue properties. NMR Biomed. 2016;29(11):1546-1552. doi:10.1002/nbm.3609
11. Zhu Y, Cheng X, Ma Y, et al. Rotator cuff tendon assessment using magic-angle insensitive 3D ultrashort echo time cones magnetization transfer (UTE-Cones-MT) imaging and modeling with histological correlation. J Magn Reson Imaging. 2018;48(1):160-168. doi:10.1002/jmri.25914
12. Jerban S, Ma Y, Namiranian B, et al. Age-related decrease in collagen proton fraction in tibial tendons estimated by magnetization transfer modeling of ultrashort echo time magnetic resonance imaging (UTE-MRI). Sci Rep. 2019;November(9):17974. www.nature.com/articles/s41598-019-54559-3.
13. Ma Y, Lu X, Carl M, et al. Accurate T 1 mapping of short T 2 tissues using a three-dimensional ultrashort echo time cones actual flip angle imaging-variable repetition time (3D UTE-Cones AFI-VTR) method. Magn Reson Med. 2018;80(2):598-608. doi:10.1002/mrm.27066
14. Gurney PT, Hargreaves BA, Nishimura DG. Design and analysis of a practical 3D cones trajectory. Magn Reson Med. 2006;55(3):575-582. doi:10.1002/mrm.20796
15. Carl M, Bydder GM, Du J. UTE imaging with simultaneous water and fat signal suppression using a time-efficient multispoke inversion recovery pulse sequence. Magn Reson Med. 2016;76(2):577-582. doi:10.1002/mrm.25823
16. Ma YJ, Zhu Y, Lu X, Carl M, Chang EY, Du J. Short T 2 imaging using a 3D double adiabatic inversion recovery prepared ultrashort echo time cones (3D DIR-UTE-Cones) sequence. Magn Reson Med. 2017;00(5):1-9. doi:10.1002/mrm.26908
17. Jerban S, Ma Y, Wei Z, Jang H, Chang EY, Du J. Quantitative Magnetic Resonance Imaging of Cortical and Trabecular Bone. Semin Musculoskelet Radiol. 2020;24(4):386-401. doi:10.1055/s-0040-1710355
Figures