2950
Optimization of Relaxation along Fictitious Field (RAFF) Contrast to Detect Osteoarthritis1Research Unit of Medical Imaging, Physics and Technology, University of Oulu, Oulu, Finland, 2Department of Medicinal Chemistry, Uppsala University, uppsala, Sweden, 3Medical Research Center, Oulu University Hospital, Oulu, Finland, 4Department of Diagnostic Radiology,, Oulu University Hospital, Oulu, Finland
Synopsis
Relaxation along Fictitious Field (RAFF) at various pulse durations was exploited to study the contrast in collagen phantoms and cartilage-mimicking phantoms. RAFF Relaxation times from collagen phantoms agreed with Bloch McConnell simulations. The maximum contrast between collagen phantoms with concentration difference was maximized when pulse duration was ~2.8 ms. Given the optimized pulse duration, our simulation results combined with ex vivo measurements suggest that hydroxyl groups concentration through proton exchange between collagen and free water may have significant role in TRAFF contrast between intact and degraded cartilage.
Introduction
Loss of collagen is associated with cartilage degeneration and loss of Glycosaminogycans (GAGs) are hallmarkers of early osteoarthritis1-3. Previously, only few studies have focused on simulating the effects of chemical exchange between free water and GAGs exchanging groups to differentiate degenerated cartilage from intact tissue. Relaxation along a Fictitious Field (RAFF) provides a flexible approach to adjust pulse parameters, especially the pulse duration, to sensitize measurements for chemical exchange. This is achieved at an acceptable specific absorption rate and scanning time. The purpose of this study was to study the RAFF pulse duration effects on proton exchange between free water and -OH groups and relaxation time difference between intact and degraded cartilage.Methods
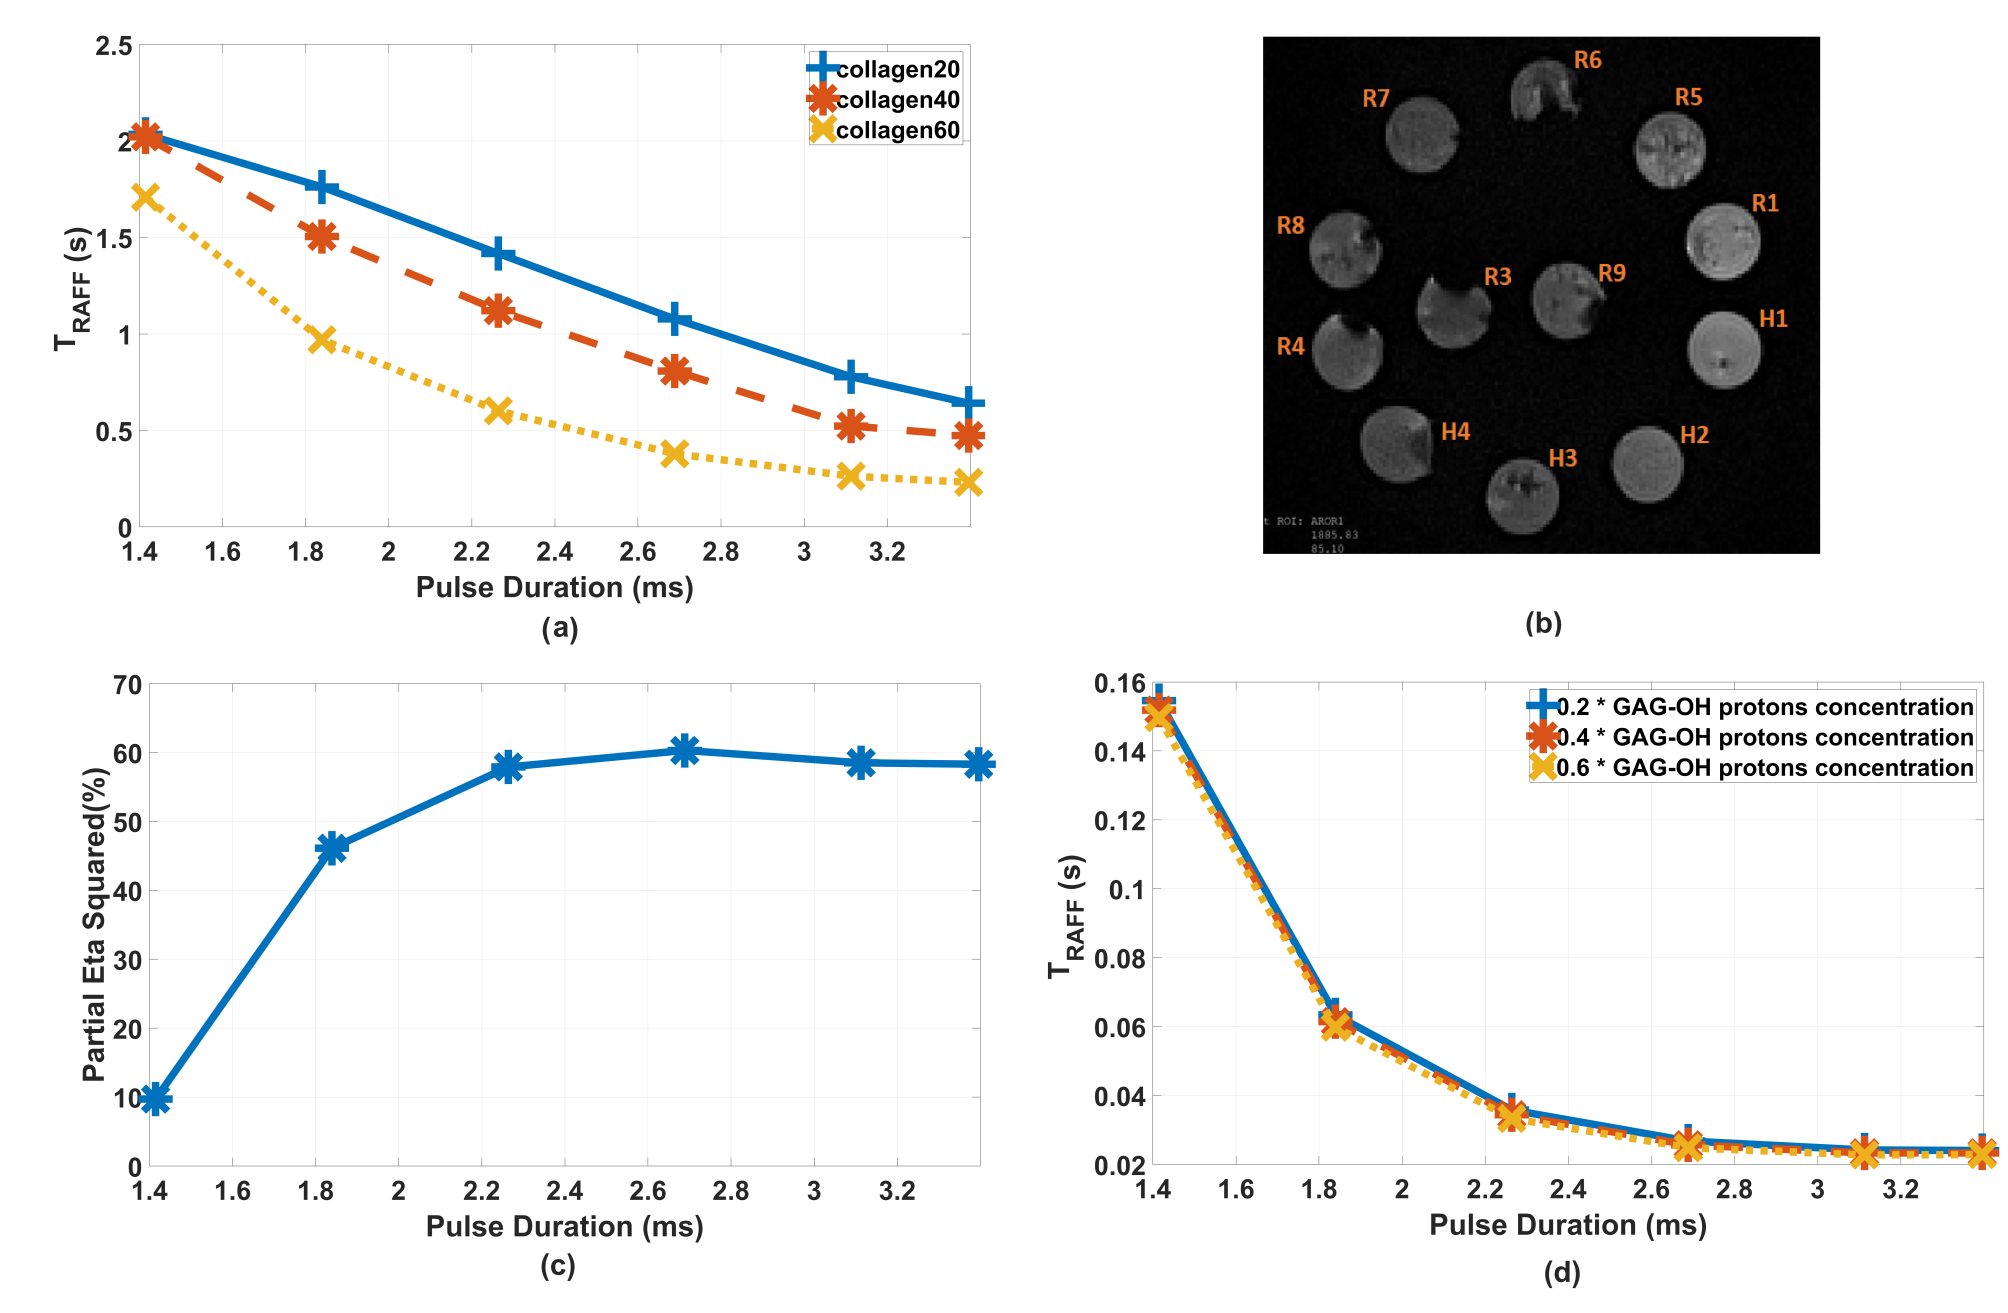
Simulations were performed assuming a two-pool model of proton exchange between free water and GAG hydroxyl group (OH) using Bloch McConnell equations2,3. An exchange rate of 1000 Hz between water and GAG-OH, concentration 0.3 M of GAG, T1 = 1 s, T2 = 0.01 s for both pools and chemical shift 1 ppm between water and GAG-OH were assumed1-3.Twelve samples with collagen concentration 20, 40, and 60 mg/mL, and chondroitin sulphate concentration of 0, 10, 20 and 40 mg/mL were mixed to create semisolid collagen phantoms. Two osteochondral specimens were collected from two patients with idiopathic knee OA during knee joint arthroplasty. The specimens are from the central load-bearing region of the lateral femoral condyle (the right sample in Fig. 2) and the other from the posterior aspect of the medial femoral condyle. Both specimens presented both intact and degenerated cartilage areas.
RAFF pulse waveform was created with initial 500 Hz amplitude and embedded in the refocusing scheme leading to a pulse duration (Tp) 2.83 ms4,5. For RAFF relaxation time (TRAFF) mapping, pulses were repeated [0,12,24,36] times to form the RAFF pulse trains. A crusher gradient was applied to dephase the magnetization in xy-plane prior to readout. The RAFF imaging parameters were as follows: gradient echo readout with repetition time (TR) 6 s between pulse trains, echo time (TE) 5.9 ms, matrix size 192×156, flip angle 20°, field of view 100 × 69 mm2, and slice thickness 3 mm. Experiments were conducted at 3 Tesla.
A T2-prepared multi-echo spin-echo sequence was used to acquire five T2-weighted images (preparation TE = 12, 23, 35, 47, 59 ms). T2 maps were generated using a log-transformed linear least-squares fitting. The T2 mapping readout parameters were TR=2000 ms, field of view 100 × 69 mm2, flip angle 70°, and slice thickness 2 mm. A factorial ANOVA was conducted to compare the main effect of collagen on RAFF relaxation times for both phantoms and specimens. Due to limited number of samples, each pixel of region of interests was considered as independent point in statistical analysis. In addition, the estimated marginal means of relaxation times and partial Eta squared were extracted from the factorial analysis for phantoms. Correlation coefficients of Spearman’s rho and corresponding P-values were calculated to investigate the relations between collagen phantoms and simulations. Differences between degraded and intact cartilage with RAFFs with varying pulse durations were tested with t-test and corrected for multiple comparisons using Benjamin-Hockert test.
Results
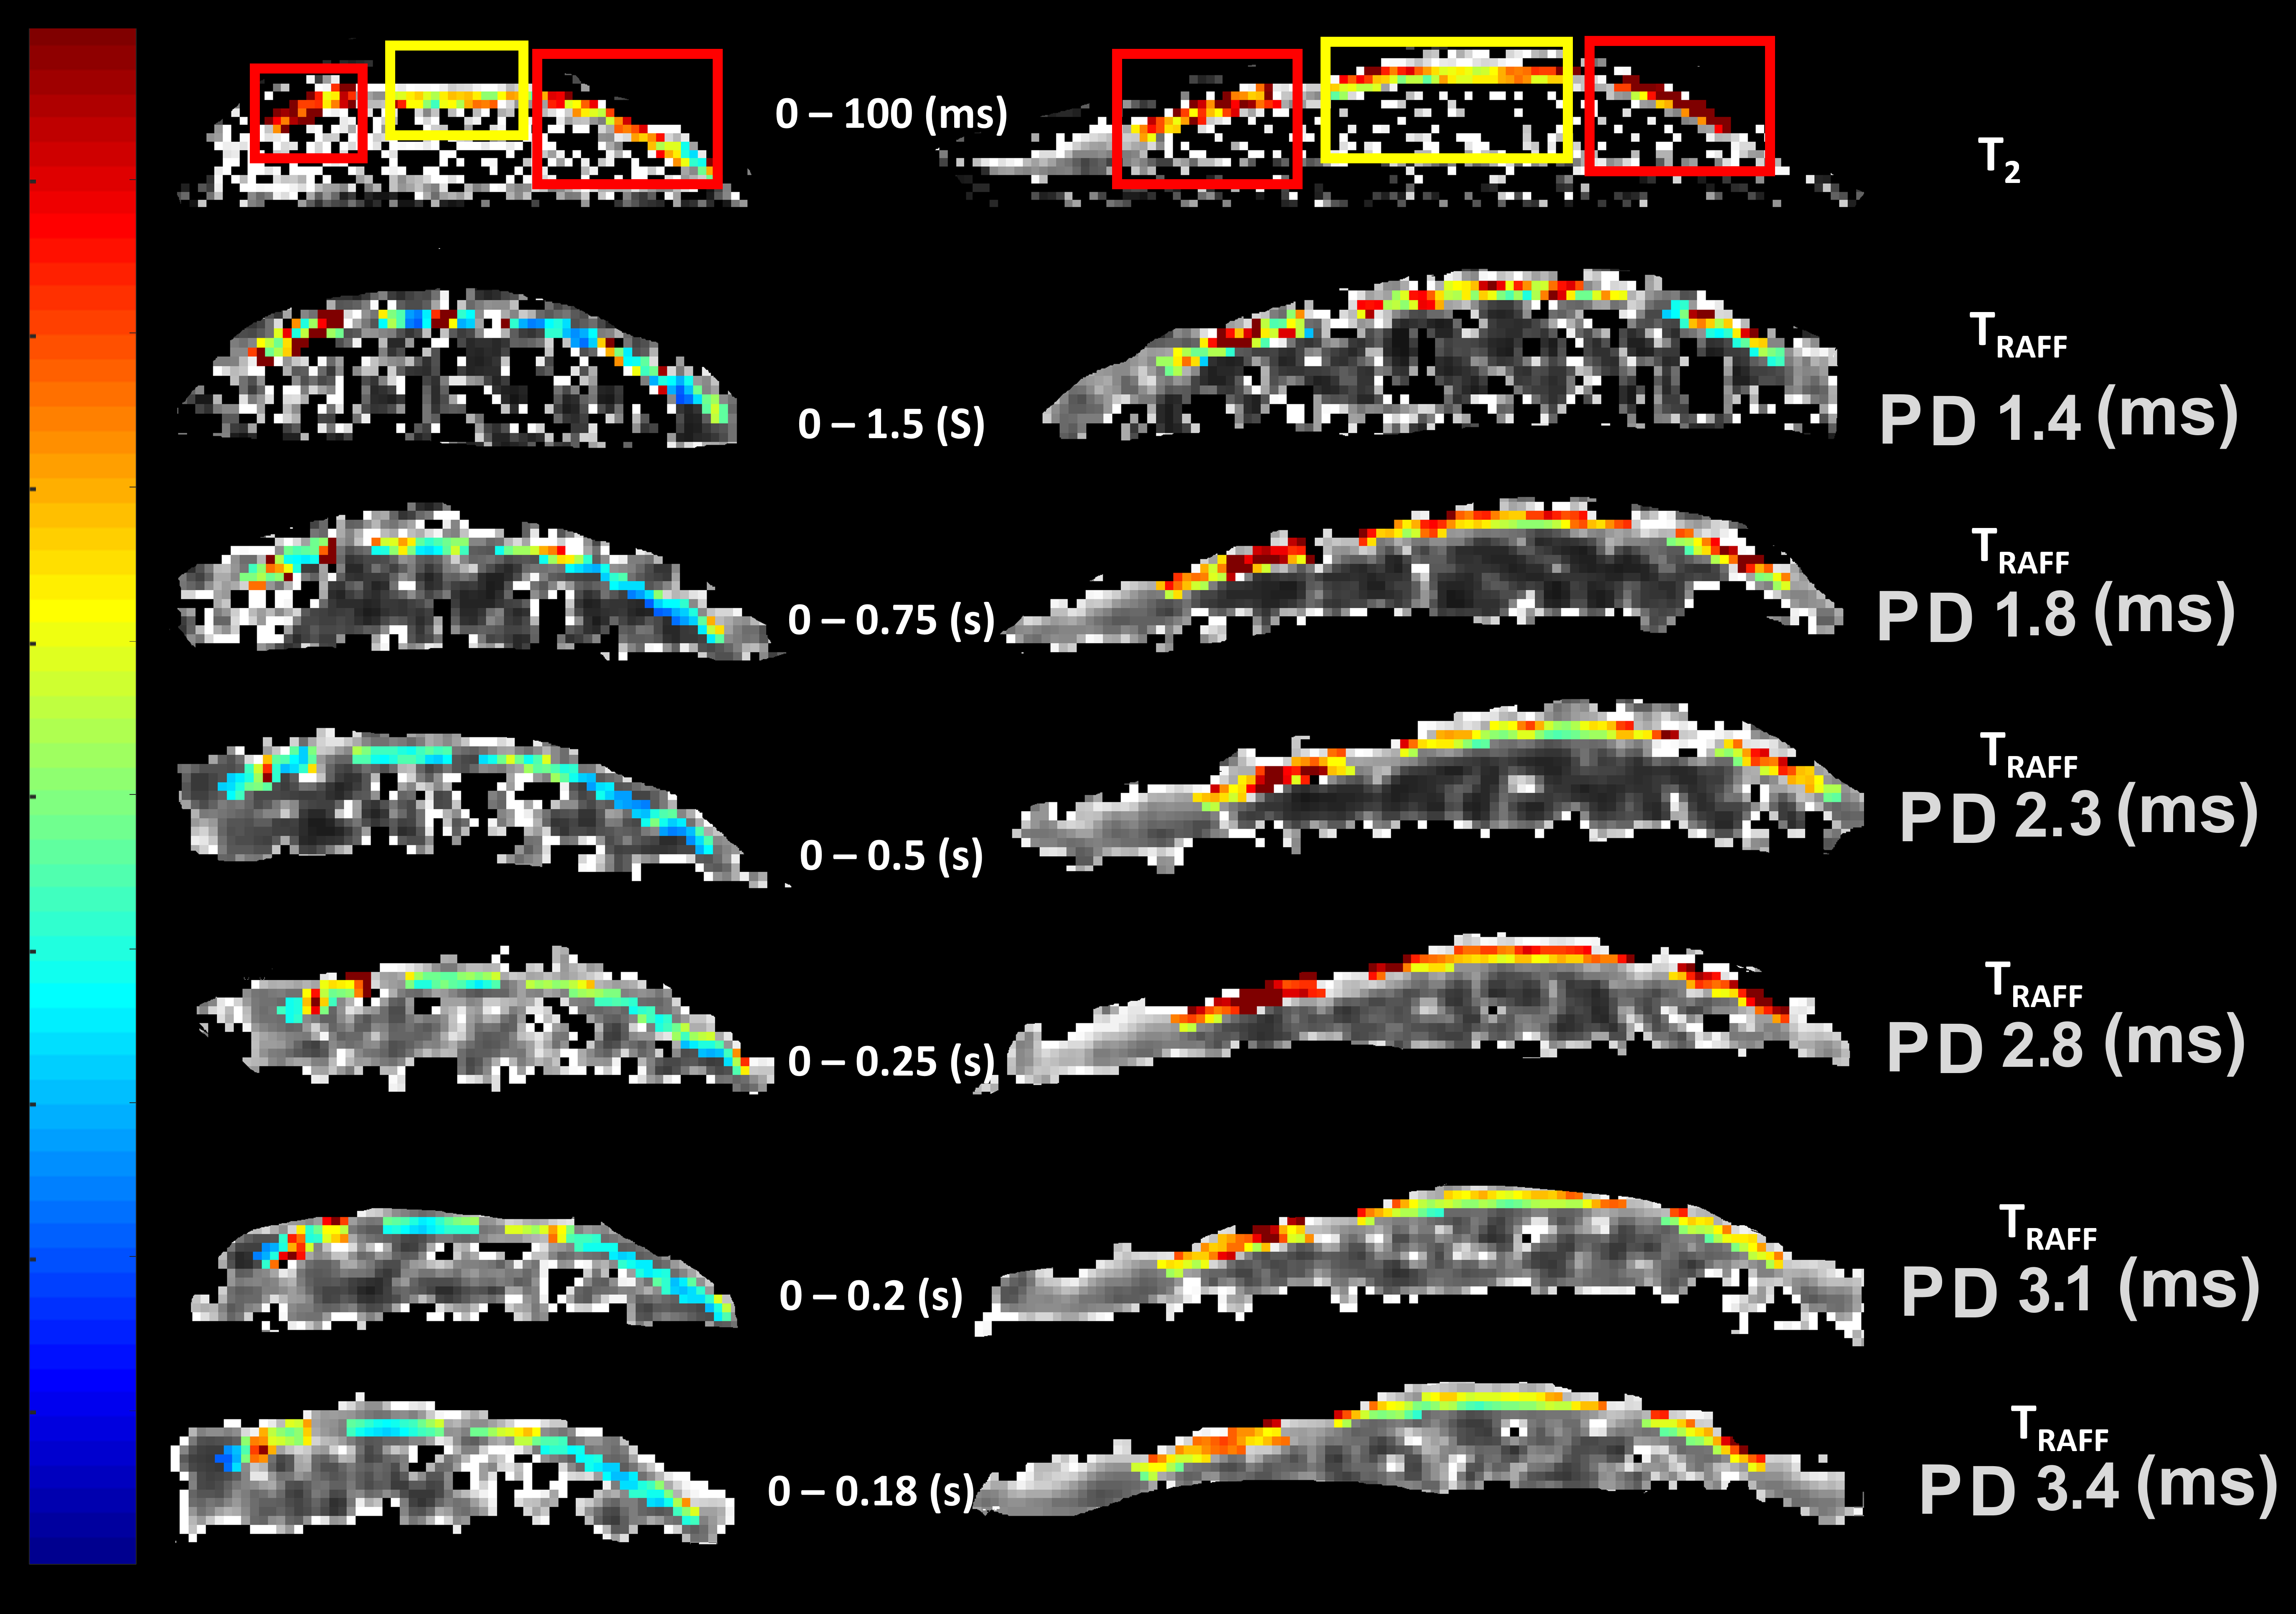
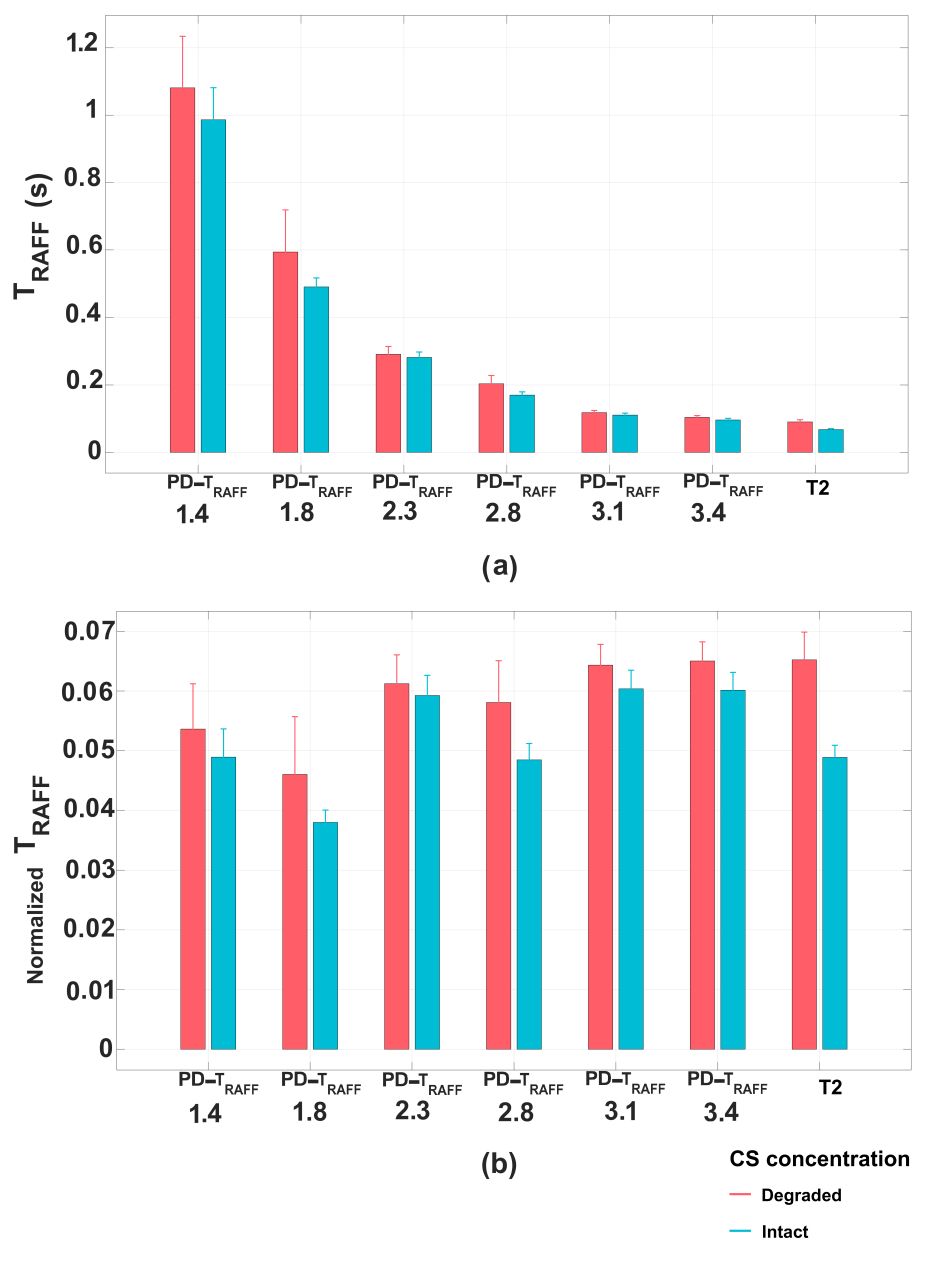
Although collagen concentrations were low in phantoms compared to cartilage, significant differences in TRAFF curves with pulse durations 1.8-3.4 ms were found between collagen concentrations (***p<0.001) (Fig 1a). Simulations demonstrated a decreased relaxation times with increasing concentration of -OH group (Fig 1d). Significant Spearman’s correlation coefficients were observed between collagen concentrations and corresponding simulations, (Fig 1a and 1d) (R2 = 1, **p<0.01 for collagen 20 and 40 and R2 = 0.943, **p<0.01 for collagen 60). The highest contrast was obtained at pulse duration of 2.8 ms (collagen intergroup effect Partial eta2 = 0.603, ***p<0.001) (Fig 1c). Significant difference between degraded and intact cartilage observed only in RAFF with pulse duration of 2.8 ms (t-test p=0.04) and T2 (t-test p=0.014) (Fig. 2 and 3a). The normalized TRAFF exhibited significant increase in degraded compared to intact cartilage. Considering normalized specimens’ measurements, pairwise comparison of factorial ANOVA indicates significant difference between degraded and intact cartilage only in T2 map and TRAFF with pulse duration 2.8 ms (Mean Diff = 0.16, ***p<0.001 and Mean Diff = 0.10, *p=0.034) (Fig. 3b).Discussion
The results from cartilage-mimicking phantoms, simulations and specimens demonstrated that increasing pulse duration of RAFF relaxation time until ~2.8 ms raise the sensitivity to loss of -OH group in degraded cartilage independently on -OH group origin (collagen or proteoglycan). Progressed degeneration specimen’s most likely reflect collagen loss which is consistent with the phantom measurements. The TRAFF increases in degraded cartilage compared to intact which is in line with decreased collagen and/or GAG-OH concentration. The limitation of the study was the low collagen concentration in phantoms compared to cartilage and a low signal-to-noise ratio in specimen measurements. We tackled the problem by normalizing specimens’ measurements, particularly visible at lowest pulse durations in RAFF measurement.Conclusion
We have demonstrated that RAFF pulse duration near to 2.8 ms is optimal to detect cartilage degeneration with RAFF.Acknowledgements
The authors want to thank financial support from following organizations Academy of Finland, Finnish Foundation for Carciovascular Research and Aarne Koskelo Foundation.References
1. Ling W, Regatte RR, Navon G, Jerschow A. Assessment of glycosaminoglycan concentration in vivo by chemical exchange-dependent saturation transfer (gagCEST). Proc Natl Acad Sci U S A. 2008 Feb 19;105(7):2266-70.
2. Brinkhof, S., Nizak, R., Khlebnikov, V. et al. Detection of early cartilage damage: feasibility and potential of gagCEST imaging at 7T. Eur Radiol 28, 2874–2881 (2018).
3. Abrar, D.B., Schleich, C., Radke, K.L. et al. Detection of early cartilage degeneration in the tibiotalar joint using 3 T gagCEST imaging: a feasibility study. Magn Reson Mater Phy (2020).
4. Liimatainen T, Sorce DJ, O'Connell R, Garwood M, Michaeli S. MRI contrast from relaxation along a fictitious field (RAFF). Magn Reson Med. 2010;64(4):983-994.
5. Yla-Herttuala E, Laidinen S, Laakso H, Liimatainen T. Quantification of myocardial infarct area based on TRAFFn relaxation time maps - comparison with cardiovascular magnetic resonance late gadolinium enhancement, T1ρ and T2 in vivo. J Cardiovasc Magn Reson. 2018 Jun 7;20(1):34.
Figures