2949
The value of T2 mapping to characterize early knee joint cartilage damage in hemophilia arthropathy
Shufang Wei1, Jiajia Li1, Xianchang Zhang2, Jing An3, and Yinghui Ge1
1Fuwai Central China Cardiovascular Hospital, Zhengzhou, China, 2MR Collaboration, Siemens Healthcare Ltd, Beijing, China, 3Siemens Shenzhen Magnetic Resonance Ltd, Shenzhen, China
1Fuwai Central China Cardiovascular Hospital, Zhengzhou, China, 2MR Collaboration, Siemens Healthcare Ltd, Beijing, China, 3Siemens Shenzhen Magnetic Resonance Ltd, Shenzhen, China
Synopsis
Detecting early articular cartilage damage can help formulate preventive treatment plans for hemophilia arthropathy (HA). Magnetic responance imaging (MRI) T2 mapping has been used extensively to investigate early chondral changes in osteoarthritis; however, it has seldomly been applied to investigate HA. This study acquired T2-mapping results on 30 patients (54 knees) with HA and 15 volunteers (24 knees). Patients with HA had significantly higher knee cartilage T2 values than the healthy controls. The T2 values also increased with the disease severity, suggesting that MRI T2 mapping is a promising method for detecting early stage cartilage damage in patients with hemophilia.
Purpose
Repeated joint hemorrhage in patients with hemophilia leads to cartilaginous and functional joint damage and is the main cause of joint injury and disability in patients with hemophilia. The early diagnosis of articular cartilage damage will help to formulate preventive treatment plans. Quantitative relaxometry mapping techniques such as T2 mapping have been extensively used to study osteoarthritis and other degenerative cartilage conditions to detect early chondral degeneration and biomedical changes before gross morphologic alterations occur. However, MR T2 mapping has been seldomly used to characterize cartilage damage in the knees of patients with hemophilia. Thus, the purpose of this study was to explore the value of magnetic resonance imaging (MRI) T2 mapping to detect early cartilage damage in the knees of children and adolescents with hemophilia.Methods
This study prospectively recruited thirty male patients (age: 13.2 ± 4.0 years old, 54 knees) with confirmed hemophiliac joint disease from the Hemophilia Diagnosis and Management Center in Henan Province, China. Fifteen age- and gender-matched volunteers (age: 12.3 ± 5.0 yo, 24 knees) were recruited as healthy controls (HCs) from the local community. All participants were scanned on a 3T MAGNETOM Prisma scanner (Siemens Healthcare, Erlangen, Germany) equipped with a 15-channel knee coil using a product T2-mapping sequences. The parameters for the T2 mapping sequence was: TR=1950ms; TE=13.8/27.6/41.4/55.2/69.0 ms for five echoes; FOV=140 x 140 mm2; voxel size=0.4 x 0.4 x 3.0 mm3; acquisition time = 7:09 mins.The knees were rated according to the criteria of the International Cartilage Repair Society (ICRS) and were divided into three groups of A, B, and C. Group A had a level 0 knee rating, group B had level I and II knee ratings, and group C had level III and IV knee ratings. Since the articular cartilage damage of group C patients were too severe to analyze quantitatively, this group provided little value for our early damage detection research. Therefore, only data from groups A and B were used for the data analyses. Finally, group A enrolled 27 knees, group B enrolled 21 knees, and group C enrolled six knees.
The T2 mapping data were analyzed using manually drawn regions of interest (ROIs) on the syngo.via workstation (Siemens Healthcare). The ROIs were drawn for the patella, lateral and medial femoral condyle, lateral and medial tibial condyle, and overall cartilage. Statistical analysis was performed using SPSS 24.0 software (IBM SPSS Inc., Chicago, IL, USA). The T2 values for each ROI type were compared between the patient and control groups using one-way ANOVA.
Results
Figure 1 shows the T2 map of knee articular cartilage from one representative from Groups C, A, and B, overlaying the structural images. An increase in T2 values and uneven T2-mapping distributions were seen in the patient groups compared with the control group.When comparing the three groups, T2 values of the overall articular cartilage were significantly different (p <0.01) in Group C compared with those of Groups A and B (40.4 ± 6.6 vs. 46.9 ± 8.0 vs. 50.7 ± 7.6 ms, respectively), demonstrating an increasing trend with disease severity. Except for the patella comparisons between Groups A and B, the T2 values of all the ROIs were significantly different among the three groups, as shown in Figure 2.Discussion
MR T2 mapping is believed to be useful for assessing notable early changes in cartilage due to its ability to detect water and underlying collagen structures in cartilage. This cross-sectional study found that patients with hemophilia had significantly higher T2 values in knee cartilage than healthy subjects. The T2 values were also shown to increase with disease severity. Increased T2 values could be related to collagen matrix fragmentation that occurs with the loss of tissue anisotropy that causes increased water mobility during the early stages of cartilage damage, and which is consistent with previous osteoarthritis T2 mapping studies [2-4]. Moreover, significantly increased T2 values were also found in patients with subtle cartilage damage (i.e., group A), suggesting that T2 mapping could be a sensitive biomarker to detect early cartilage changes in patients with hemophilia.Conclusions
MR T2 mapping could be used to detect cartilage damage in hemophiliac arthropathies in the early stages of damage and is a promising tool to distinguish the different degrees of cartilage damage.Summary of the Main Findings
T2 mapping detected early cartilage changes in patients with hemophilia and could be used as a sensitive biomarker to detect these early changes and develop preventative treatment plans.Acknowledgements
This study was supported by National Natural Science Foundation of China (No. 81271543).References
[1] Wyseure T, Mosnier L O, Drygalski A V. Advances and Challenges in Hemophilic Arthropathy[J]. Seminars in Hematology, 2016, 53(1):10.[2] Valentino L A. Blood‐induced joint disease: the pathophysiology of hemophilic arthropathy[J]. Journal of Thrombosis and Haemostasis, 2010, 8(9): 1895-1902.[3] Melchiorre D, Milia A F, Linari S, et al. RANK-RANKL-OPG in hemophilic arthropathy: from clinical and imaging diagnosis to histopathology[J]. The Journal of rheumatology, 2012, 39(8): 1678-1686.[4] Abdelrazik N, Reda M, El-Ziny M, et al. Evaluation of bone mineral density in children with hemophilia: Mansoura University children hospital (MUCH) experience, Mansoura, Egypt[J]. Hematology, 2007, 12(5): 431-437.Figures
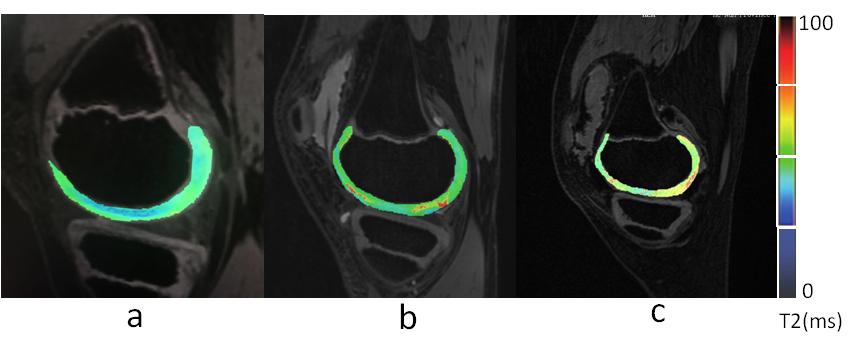
T2 mapping (T2M) of the knee. (a) Control group, male, 10 yo; T2M pseudo-color imaging (PCI) shows a uniform cartilage color distribution and complete articular surface. (b) Group A, male, 9 yo; T2M PCI shows uneven cartilage color distribution, few red-yellow stage changes, and an increased cartilage T2 value. (c) Group B, male, 11 yo; T2M PCI shows greater uneven cartilage color distribution, a significantly diminished weight-bearing area, and a significantly increased cartilage T2 value.
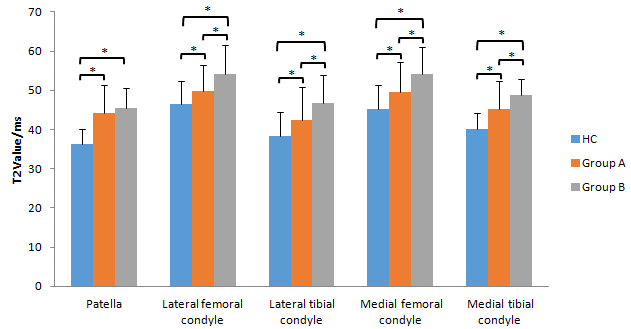
A bar graph showing T2 values for the different regions of interest (ROIs) in the knee. Groups HC (control), A (International Cartilage Repair Society [ICRS] level 0), and B (ICRS levels I and II) were compared for each ROI. * represents a significant difference.