2948
T1Ρ relaxation times for voxel-wise characterization of longitudinal changes in hip cartilage biochemistry1UCSF, San Francisco, CA, United States
Synopsis
Hip osteoarthritis coincides with or is preceded by biochemical changes in articular cartilage,1, 2 which can be measured on a voxel-wise basis with magnetic resonance T1ρ and T2 relaxation times. In this study, we employed principal component analysis to characterize variation in longitudinal changes of hip cartilage T1ρ relaxation times across healthy subjects and those with early-to-moderate hip osteoarthritis. Our results indicated that over two years, a majority of the variation in T1ρ relaxation time changes was located in the deep layers of the acetabular cartilage.
Introduction
Arthritis is the primary cause of disability in the US,3 with hip osteoarthritis (OA) reported to afflict up to 27% of US adults over the age of 45.4 Although it can be diagnosed with radiographic or symptomatic signs of hip OA, these are often semi-quantitative evaluations of hip cartilage health that do not often lend themselves to the identification of OA etiology or early detection for preventative therapies. Studies have found that biochemical changes in articular cartilage coincide with or precede the development of OA.5 Specifically, higher magnetic resonance (MR) T1ρ and T2 relaxation times correspond to decreased proteoglycan content and increased water content and matrix disorganization, respectively.6, 7 In this study, we leveraged principal component (PC) analysis to characterize two-year changes in hip cartilage T1ρ relaxation times for subjects with early-to -moderate hip OA.Methods
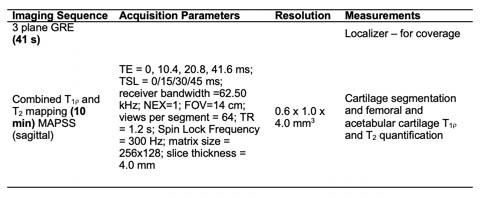
Forty-three subjects (27 female; age: 53.8 ± 14.6 years; BMI: 23.3 ± 3.0 kg/m2) were recruited and signed informed consent as approved by the Committee of Human Research at our institution. Of the 86 hips used for this study, 21, 37, 16, and 12 hips had Kellgren-Lawrence (KL) grades of 0, 1, 2, and 3, respectively, at baseline. Bilateral hip images were acquired at baseline and a two-year follow up time point on a 3T MR scanner (GE Healthcare, Waukesha, WI) using a 32-channel coil (Invivo Corp., Amsterdam, Netherlands). A sagittally combined T1ρ/T2 Magnetization-Prepared Angle-Modulated Partitioned k-Space Spoiled Gradient Echo Snapshots (MAPSS) sequence was acquired of each hip8 (Table 1). Acetabular and femoral cartilage were automatically segmented using a single atlas-based approach and registered to the same atlas subject to enable comparisons between subjects.9 Voxel-based relaxometry was used to create T1ρ relaxation time maps of the combined femoral and acetabular cartilage at each time point.10 A difference map was calculated for each subject by subtracting the baseline T1ρ map from the two-year T1ρ map. Principal component (PC) analysis was performed on the T1ρ difference maps to characterize the variation in two-year changes across healthy subjects and those with early-to-moderate hip OA. Each PC mode was visualized as the mean ± 3 standard deviations of the variation for that mode. Mean (± standard deviation) age, BMI, and KL score were calculated for the ten subjects with the highest and lowest PC scores to characterize how subjects differed across a mode of variation.Results
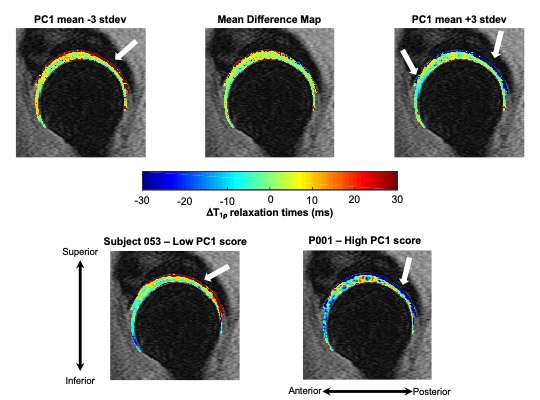
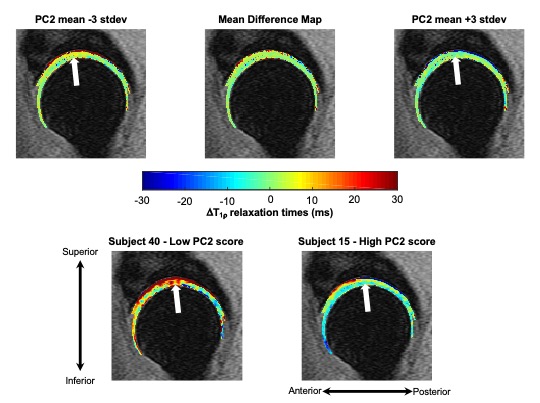
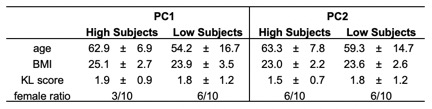
The first five PCs accounted for more than 47% of variance in longitudinal voxel-wise changes in hip cartilage T1ρ relaxation times. PC 1 described 20.8% of the variability across subjects. PC 1 demonstrated a laminar effect, as it was primarily characterized by changes to the deeper layers of the acetabular cartilage, particularly in the posterior and inferior-anterior regions (Figure 1). Lower PC 1 scores corresponded to greater increases in T1ρ relaxation times in the deep layers of acetabular cartilage. Higher PC 1 scores corresponded to greater decreases in T1ρ relaxation times in the deep layers of acetabular cartilage, most notably in the posterior and inferior-anterior regions. The ten subjects with the highest and lowest PC 1 scores varied notably by age and gender, but marginally by BMI and KL score (Table 2). PC 2 (8.4% of variation) was primarily characterized by changes to more superficial layers of the acetabular cartilage in the superior region (Figure 2). Lower PC 2 scores represented increased, while higher PC 2 scores represented decreased or no change to, T1ρ relaxation times in the superior acetabular cartilage. The ten subjects with the highest and lowest PC 2 scores varied notably by age and gender, but marginally by BMI and KL score (Table 2). The remaining PC scores each accounted for less than 7% of the variation across subjects, with more nuanced variation.Discussion
This study established a data-driven framework to characterize voxel-wise variation in longitudinal T1ρ relaxation time changes. The variation explained by PC 2 was in the superior region, which may be driven by loads across the joint, as this region is typically loaded during weight-bearing. However, the majority of the variation in longitudinal T1ρ changes was seen in the deep layers of the acetabular cartilage. As the subjects were healthy or had early-to-moderate hip OA, these results may indicate that initial changes or early OA progression occurs in the deep layers of the acetabular cartilage. The fact that subjects with notable longitudinal increases in deep acetabular cartilage T1ρ relaxation times (i.e., subjects with low PC 1 scores) were younger is of particular interest as this may indicate that changes in acetabular cartilage health may be more rapid at earlier ages.Conclusion
This work emphasizes the usefulness of PC analysis to investigate longitudinal patterns in hip cartilage T1ρ relaxation times. In particular, these patterns highlighted the deep acetabular cartilage layer as a region that changes most notably in healthy individuals and those with early-to-moderate hip OA over a two-year period. The outcomes of this work also provide credit to the ability of PC analyses to reduce the dimensionality of T1ρ relaxation time maps and could prove a useful feature extraction technique for machine learning and predictive models for hip OA progression.Acknowledgements
The authors gratefully acknowledge the assistance of Carla Kinnunen and funding from National Institutes of Health: K24 AR072133, R01 AR069006, R00 AR070902.References
1. M. C. Gallo, C. Wyatt, V. Pedoia, D. Kumar, S. Lee, L. Nardo, T. M. Link, R. B. Souza, and S. Majumdar, T1rho and T2 relaxation times are associated with progression of hip osteoarthritis, Osteoarthritis Cartilage, 2016, 24(8), 1399-1407, doi: 10.1016/j.joca.2016.03.005.
2. C. Wyatt, D. Kumar, K. Subburaj, S. Lee, L. Nardo, D. Narayanan, D. Lansdown, T. Vail, T. M. Link, R. B. Souza, and S. Majumdar, Cartilage T1rho and T2 Relaxation Times in Patients With Mild-to-Moderate Radiographic Hip Osteoarthritis, Arthritis Rheum, 2015, 67(6), 1548-1556, doi: 10.1002/art.39074.
3. C. f. D. Control and U. Prevention, Prevalence and most common causes of disability among adults--United States, 2005, MMWR: Morbidity and mortality weekly report, 2009, 58(16), 421-426, doi:
4. J. M. Jordan, C. G. Helmick, J. B. Renner, G. Luta, A. D. Dragomir, J. Woodard, F. Fang, T. A. Schwartz, A. E. Nelson, L. M. Abbate, L. F. Callahan, W. D. Kalsbeek, and M. C. Hochberg, Prevalence of hip symptoms and radiographic and symptomatic hip osteoarthritis in African Americans and Caucasians: the Johnston County Osteoarthritis Project, J Rheumatol, 2009, 36(4), 809-815, doi: 10.3899/jrheum.080677.
5. V. Pedoia, C. Russell, A. Randolph, X. Li, S. Majumdar, and A.-A. Consortium, Principal component analysis-T1rho voxel based relaxometry of the articular cartilage: a comparison of biochemical patterns in osteoarthritis and anterior cruciate ligament subjects, Quant Imaging Med Surg, 2016, 6(6), 623-633, doi: 10.21037/qims.2016.11.03.
6. U. Duvvuri, R. Reddy, S. D. Patel, J. H. Kaufman, J. B. Kneeland, and J. S. Leigh, T1rho-relaxation in articular cartilage: effects of enzymatic degradation, Magnetic Resonance in Medicine, 1997, 38(6), 863-867, doi:
7. M. T. Nieminen, J. Rieppo, J. Toyras, J. M. Hakumaki, J. Silvennoinen, M. M. Hyttinen, H. J. Helminen, and J. S. Jurvelin, T2 relaxation reveals spatial collagen architecture in articular cartilage: a comparative quantitative MRI and polarized light microscopic study, Magn Reson Med, 2001, 46(3), 487-493, doi: 10.1002/mrm.1218.
8. X. Li, C. Wyatt, J. Rivoire, E. Han, W. Chen, J. Schooler, F. Liang, K. Shet, R. Souza, and S. Majumdar, Simultaneous acquisition of T1rho and T2 quantification in knee cartilage: repeatability and diurnal variation, J Magn Reson Imaging, 2014, 39(5), 1287-1293, doi: 10.1002/jmri.24253.
9. V. Pedoia, X. Li, F. Su, N. Calixto, and S. Majumdar, Fully automatic analysis of the knee articular cartilage T1rho relaxation time using voxel-based relaxometry, J Magn Reson Imaging, 2016, 43(4), 970-980, doi: 10.1002/jmri.25065.
10. V. Pedoia, M. C. Gallo, R. B. Souza, and S. Majumdar, Longitudinal study using voxel-based relaxometry: Association between cartilage T1rho and T2 and patient reported outcome changes in hip osteoarthritis, J Magn Reson Imaging, 2017, 45(5), 1523-1533, doi: 10.1002/jmri.25458.
Figures