2947
Deriving a Cartilage Signature to Predict Joint Replacement in Osteoarthritis1NIHR Nottingham Biomedical Research Centre, University of Nottingham, Nottingham, United Kingdom, 2Radiological Sciences, Division of Clinical Neuroscience, University of Nottingham, Nottingham, United Kingdom, 3Sir Peter Mansfield Imaging Centre, University of Nottingham, Nottingham, United Kingdom, 4Nuffield Department of Clinical Neuroscience, University of Oxford, Oxford, United Kingdom
Synopsis
Prediction of future knee replacement in osteoarthritis may support tailored decision making, and provide a surrogate outcome marker for clinical trials of diseases modifying osteoarthritis drugs. Fully automated cartilage segmentation is generated from knee MRI, and feature are extraction to create a radiomic signature for the prediction of knee replacement within 5 -years. The radiomic signature using univariate cox regression predicted surgery with a HR of 7.5 (p = 2e-28, 95% CI 7.1 – 7.9) which was higher than established clinico-demographic multivariate prediction model with HR 5.9 (p = 2e-28, 95%CI 5.6 – 6.2).
Background
In people with knee osteoarthritis prediction of their future need of knee replacement surgery would be highly desirable to support tailored decision making on prevention and intervention. Knee MRI and in particular radiomic features derived from accurate 3D cartilage models hold relevant information that may allow to build clinically useful prediction models. Additionally, understanding the cartilage imaging features that index time to future knee replacement surgery will enable the development of explanatory outcome measures for population studies in clinical preventative trials.Purpose
To build a prediction model of time to knee replacement surgery using an automated pipeline of radiomic feature selection from fully automated cartilage segmentation from knee MRI in patients with osteoarthritis. To assess the performance compared to clinico-demographic predictors and derive candidate outcome metrics for future trials.Materials and Methods
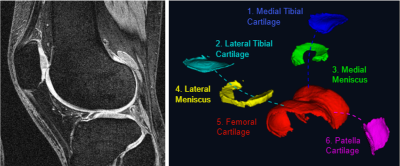
In this retrospective study, data from the Osteoarthritis Initiative for participants with osteoarthritis collected between 2006-2015 were downloaded. A total of 1433 OA participants with 1863 symptomatic knees (mean age 61yrs; inter-quartile range 47 – 77) with baseline knee MRI, including a Double Echo Steady State (DESS) acquisition were included. 171 participants underwent total knee replacement within 5-years. Clinical and demographic data used in this study included: age, sex, BMI, income, education, considering knee replacement, knee pain, difficulty kneeling, squatting or pivoting, knee alignment, leg strength, comorbidities, back pain, use of analgesics and NSAID, hyaluronic or steroid injection, activity levels, mental and physical health.We performed cartilage segmentation (Figure 1) using fully automated methods by combining predictions from two models, a U-Net for the segmentation of two labels (cartilage vs background) and a multi-label U-Net for specific cartilage compartments (1). Data for training and evaluation comprised of 176 knee DESS MRI cases from the OAI, with manual segmentation of the patellar, femoral, lateral tibial, medial tibial, lateral meniscal and medial meniscal cartilage. Image pre-processing comprised of N4 Bias field correction to remove low frequency intensity non-uniformities (2). The method achieved excellent Dice coefficient for all cartilage locations (range 0.84 – 0.90).
Cartilage MRI features were extracted from each cartilage compartment using the Standardized Environment for Radiomics Analysis (SERA) Package developed for use in Matlab (3). Radiomic features were used as the input feature space (P = 2922 features per participant) to predict knee replacement surgery at 5-years, leading to a large P – small N setting. We develop a radiomic signature by training an Elastic Net regression model (a regularised regression that linearly combines L1 and L2-norms). The free hypermeters of the machine learning pipeline were, the multicollinearity of features (M), the number of pre-selected feature (K), the regularisation coefficient ($$$\alpha$$$) and the weight of regularisation ($$$\lambda$$$). Hyperparameters were optimised with a grid search and binary cross entropy loss. Grid search values for M were [0.3, 0.6, 0.9, 1.0], K varied from 10 to 100 in intervals of 5,and $$$\alpha$$$ values were [0.001 ,0.01, 0.05, 0.1, 0.5]. For the regularisation parameter $$$\lambda$$$, 10 values were used, varying on an exponential scale between 1e-5 and 0.1. Hyperparameter optimisation was performed using 10-fold cross validation (internal validation). Cross validation incorporated the complete machine learning pipeline, to avoid data leakage between training and test samples. Further validation of the radiomic signature as an independent biomarker was performed using cox regression. Values for the radiomic signature were obtained from the internal validation (i.e. performance on the left-out participant data). A total of 26 clinical and demographic covariates were selected based on existing studies(4–6) and included in the cox analysis. Multivariate cox analysis was performed and features were removed in a “backwards selection” manner, based on a significance level of p > 0.05. A total of 8 non-imaging feature survive the backwards selection process. Individual risk estimates, $$$\widehat{H(t)}$$$ were calculated using:
$$\widehat{H(t)} = 1-s_0(t)^{exp[\sum{X_i \beta_i}-\sum{\overline{X}_i \beta_i} ]}$$Where $$$s_0(t)$$$ is the baseline survival at time $$$t$$$, $$$X_i$$$ is the value of the $$$i_th$$$ risk factor, and $$$\overline{X}_i$$$ is the corresponding mean, while $$$\beta_i$$$ is the regression coefficient (7). The C-statistic was calculated for the radiomic signature, and cox risk model with and without the radiomic signature. Kaplan-Meier Curves were also generated for these models.
Results
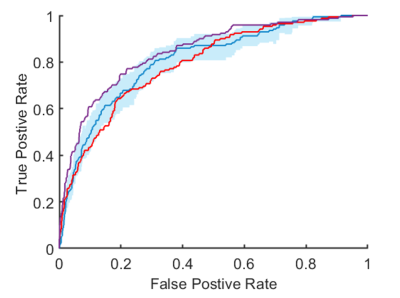
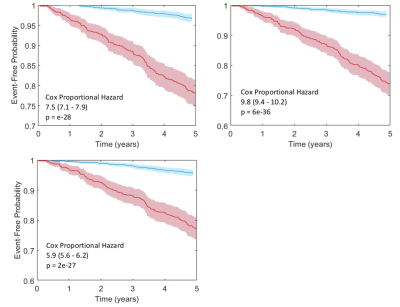
Optimal hyperparameters for the elastic net regression were found to be M = 0.9, K = 50, $$$\alpha$$$ = 0.5 and $$$\lambda$$$ = 0.01. The ROC curves for the prediction models are shown in Figure 2, while Kaplan-Meier curves are shown in Figure 3. The derived radiomic signature had univariate cox hazard ratio of 7.5 (p = 2e-28, 95% CI 7.1 – 7.9) which was higher than established clinic-demographic predictors (4–6) with hazard ratio 5.9 (p = 2e-28, 95%CI 5.6 – 6.2). Combining clinico-demographic predictors with the radiomic signature further improved the hazard ratio, 9.8 (p = 6e-36, 95%CI 9.4 – 10.2) (Figure 2).Conclusion
The proposed Cox risk model with the radiomic signature for prediction of knee replacement within 5-years improves the predictive ability over standard clinical and demographic features (c-index 0.85 vs 0.79). The addition of clinical and demographic data to the radiomic signature only lead to a small gain in the c-index (0.85 vs 0.81), which suggest non-imaging data provides limited additional information.Acknowledgements
No acknowledgement found.References
1. Peake EJ, Chevasson R, Pszczolkowski S, Auer DP, Arthofer C. Ensemble learning for robust knee cartilage segmentation: data from the osteoarthritis initiative. bioRxiv. 2020 Sep 1; 2020.09.01.267872.
2. Tustison NJ, Avants BB, Cook PA, Yuanjie Zheng, Egan A, Yushkevich PA, et al. N4ITK: Improved N3 Bias Correction. IEEE Trans Med Imaging. 2010 Jun;29(6):1310–20.
3. Ashrafinia S, 0000-0002-9592-0437. Quantitative nuclear medicine imaging using advanced image reconstruction and radiomics. 2019 Mar 26
4. Hawker GA, Guan J, Croxford R, Coyte PC, Glazier RH, Harvey BJ, et al. A prospective population-based study of the predictors of undergoing total joint arthroplasty. Arthritis Rheum. 2006 Oct;54(10):3212–20.
5. Lewis JR, Dhaliwal SS, Zhu K, Prince RL. A Predictive Model for Knee Joint Replacement in Older Women. Lucia A, editor. PLoS One. 2013 Dec 11;8(12):e83665.
6. Yu D, Jordan KP, Snell KIE, Riley RD, Bedson J, Edwards JJ, et al. Development and validation of prediction models to estimate risk of primary total hip and knee replacements using data from the UK: Two prospective open cohorts using the UK Clinical Practice Research Datalink. Ann Rheum Dis. 2019 Jan 1;78(1):91–9.
7. Jia X, Baig MM, Mirza F, GholamHosseini H. A Cox-Based Risk Prediction Model for Early Detection of Cardiovascular Disease: Identification of Key Risk Factors for the Development of a 10-Year CVD Risk Prediction. Adv Prev Med. 2019 Apr 9;2019:1–11.
Figures