2946
Relaxation Time Mapping of Knee Articular Cartilage Using Magnetic Resonance Fingerprinting1Research Unit of Medical Imaging, Physics and Technology, University of Oulu, Oulu, Finland, 2Medical Research Center, University of Oulu and Oulu University Hospital, Oulu, Finland, 3Centre for Advanced Imaging, University of Queensland, Brisbane, Queensland, Australia, 4Center for Advanced Imaging Innovation and Research, New York University Grossman School of Medicine, New York, NY, United States, 5Department of Diagnostic Radiology, Oulu University Hospital, Oulu, Finland
Synopsis
Knee osteoarthritis is a degenerative musculoskeletal disorder which is characterized by progressive damage of articular cartilage (AC). Quantitative MRI (qMRI), such as T1 and T2 maps, can be used to assess the AC compositional changes. However, long acquisition time and equipment dependency are the limitations of the current clinical qMRI techniques. In the present study, we validate magnetic resonance fingerprinting (MRF) against conventional T1 and T2 relaxation time mapping methods in cartilage-mimicking phantoms, and apply MRF in vivo for sub-regional analysis of femoral and tibial cartilage in human subjects.
Introduction
Quantitative MRI techniques provide valuable physiological and biological insights regarding the molecular composition of cartilage. For example, T2 maps can reveal the collagen and extracellular matrix interaction in early stages of cartilage degeneration. Such methods are widely used in preclinical and clinical research to assess compositional changes in articular cartilage (AC) but rarely included in clinical protocols as conventional quantitative sequences are time consuming and dependent on the method and equipment used. Magnetic resonance fingerprinting (MRF) can provide multiple parameters maps (e.g. T1, T2) simultaneously from a single fast acquisition.2,3As cartilage degeneration is heterogeneous and characterized by small localized biochemical changes, quantitative analysis of clinically relevant cartilage subregions is crucial for accurate assessment of AC in knee osteoarthritis (KOA). The aim of this study was to show the feasibility of using MRF for complete quantitative assessment of multiple femoral and tibial cartilage subregions, including superficial and deep regions-of-interest.Methods
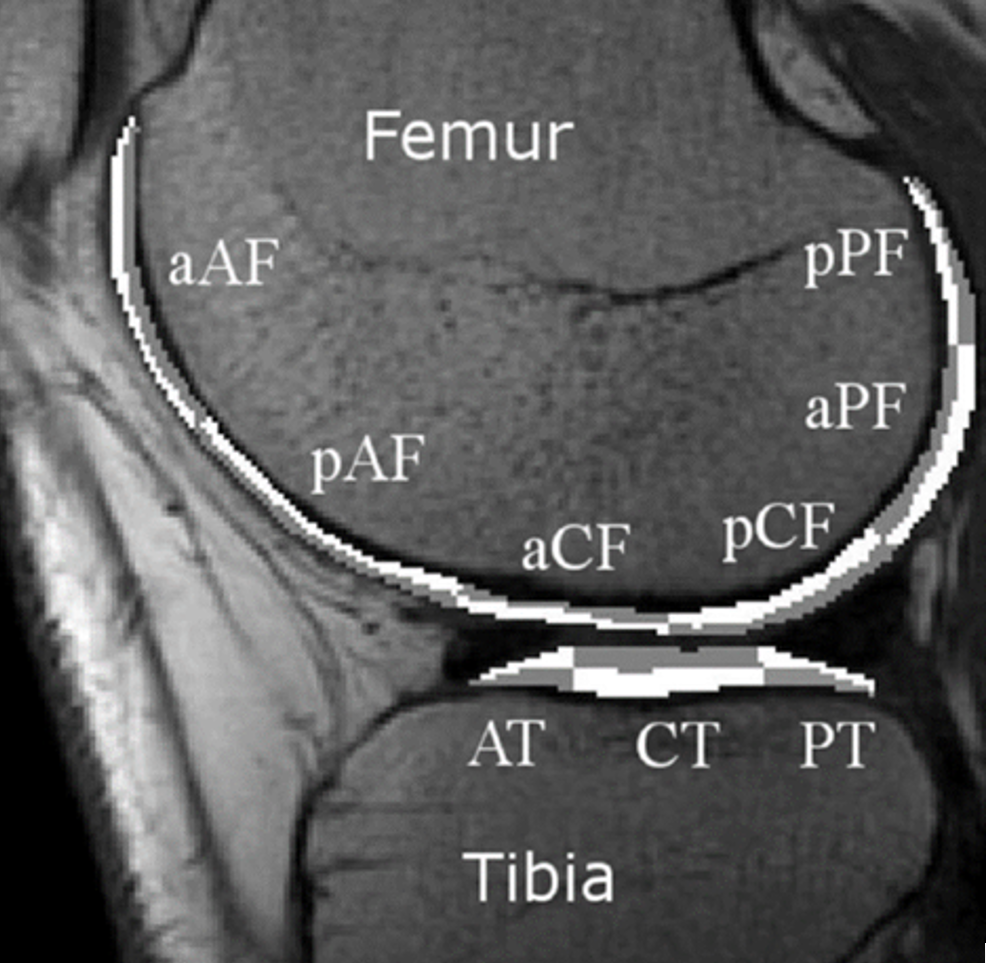
Phantom validation: Nickel-doped agarose gel phantoms with T1 (300-1000 ms) and T2 (25-100 ms) within AC tissue range were imaged at 3T (Siemens MAGNETOM Vida, Skyra) using a knee coil with the following protocol (resolution 0.6×0.6×3.0 mm3): Inversion Recovery (IR) Turbo Spin-Echo (SE) for T1 mapping (9 TIs=50-7000 ms, TR/TE=7500/8.6 ms); and for T2 mapping, SE sequence (TR = 7000 ms, 8 TEs = 10-120 ms), and Multi-Echo SE (MESE) (TR=7000 ms, 5 TEs=13.8-69.0 ms); MRF (TR/TE=7.5/3.5 ms, FA=60°). MRF measurements were obtained using the sequence implementation detailed in Cloos et al. 2 with 1,2,4,6,8, and 10 radial spokes (“shots”) for each of the 1000 time points of the fingerprint. To evaluate intra-scanner repeatability of the MRF technique, the measurements were repeated three times on repositioned phantoms using the same scanner. Inter-scanner repeatability was tested by running the measurements on two different scanners. In vivo experiment: Ten subjects (5 females, age=34±1years) from The Northern Finland Birth Cohort 1986 (https://www.oulu.fi/nfbc/) underwent 3T MRI (Siemens MAGNETOM Vida) of the knee. The standard knee coil and the aforementioned MRF sequence (resolution 0.6x0.6x3.0 mm, 10 slices, TR/TE=7.5/3.5 ms, FA=60°, 4 and 6 shots with TA 6:01 and 9:01 min, respectively) were used. Additionally, for a representative case, conventional MRI was performed to compare standard quantitative mapping with MRF results using following sequences: IR Turbo SE-T1 (2 slices, 8 TIs=50-3900ms, TR/TE=4060/8.6ms, TA=20:48 min) and MESE-T2 (18 slices, TR=1680ms, 5 TEs=13-69ms, TA=6 min). Analysis: The conventional MRI IR relaxation values were reconstructed by fitting the data to $$${S=}\mid{S0(1-2e^{-TI/T1})}\mid$$$ for T1 and $$${S=}\mid{S0e^{-TE/T2}}\mid$$$ for T2 in MATLAB (R2019b, MathWorks, Natick, MA). Root-mean-square coefficients-of-variation (RMS-CVs) were calculated to test inter- and intra-scanner repeatability. To evaluate the agreement between MRF and conventional relaxation time measurements, correlation and Bland-Altman analysis were performed. Femoral and tibial cartilage segmentation (into 6 and 3 subregions, respectively) was performed manually for single slices from both lateral and medial femoral condyles (Fig.1). Mean relaxation time values were calculated for all subregions in superficial and deep layers of AC.Results
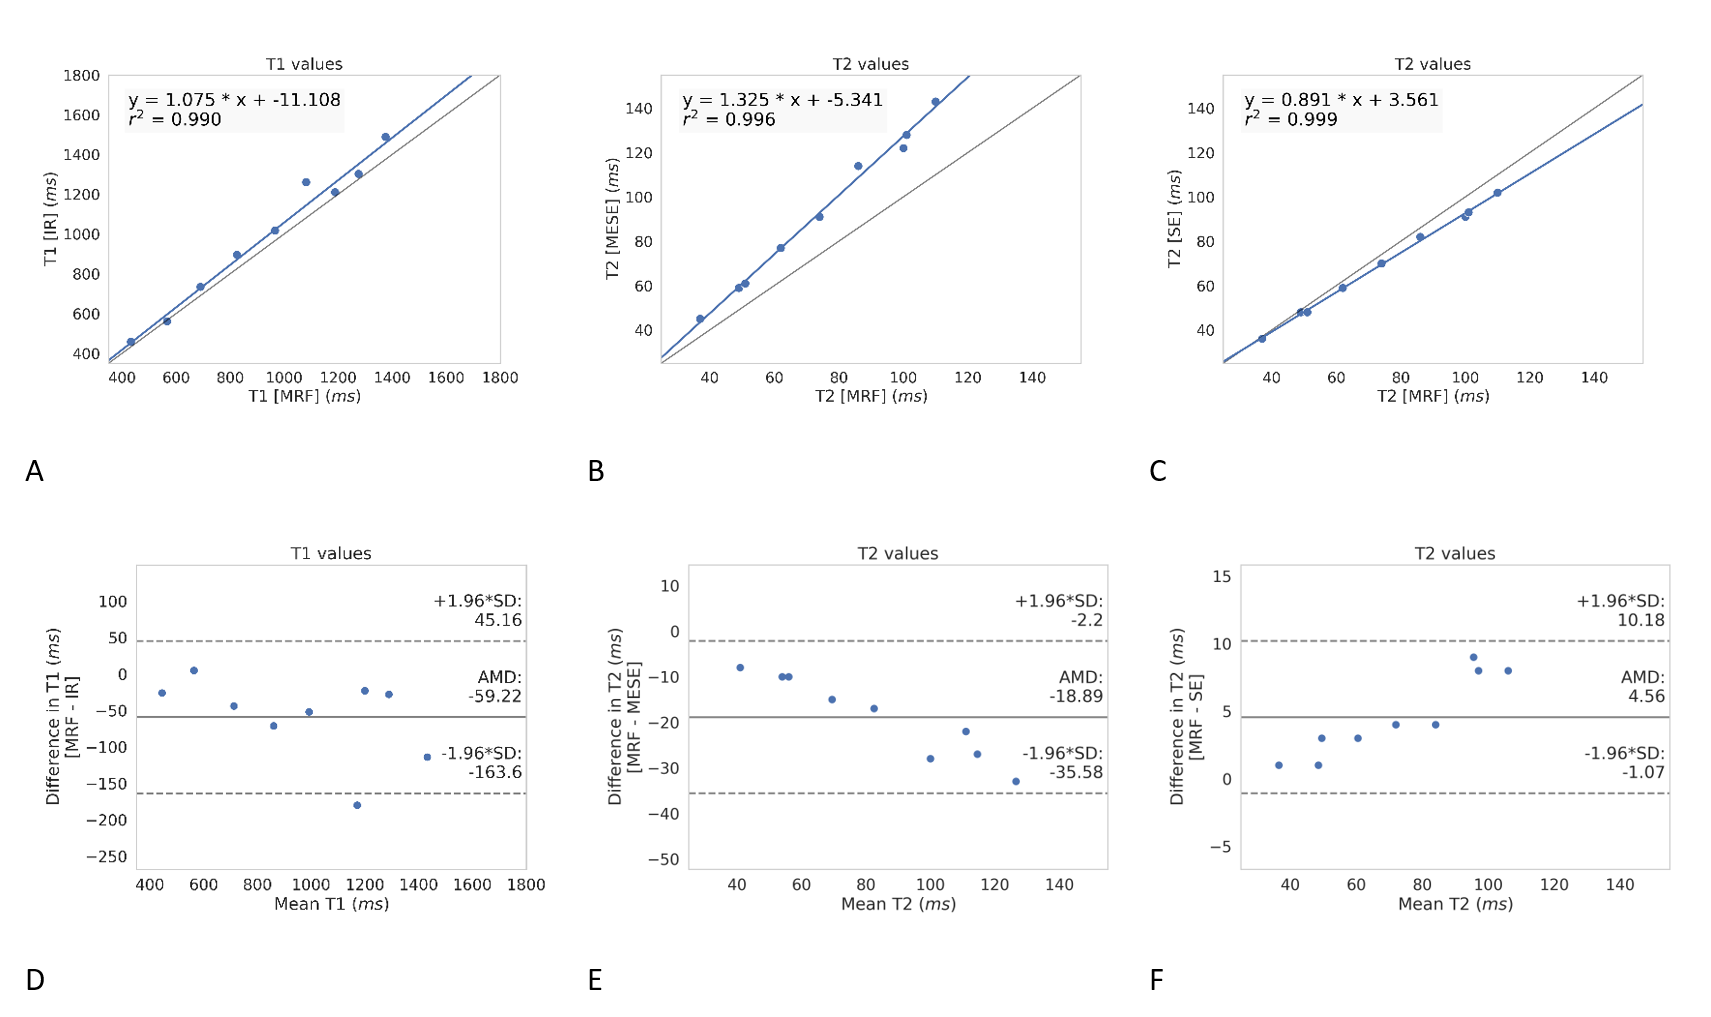
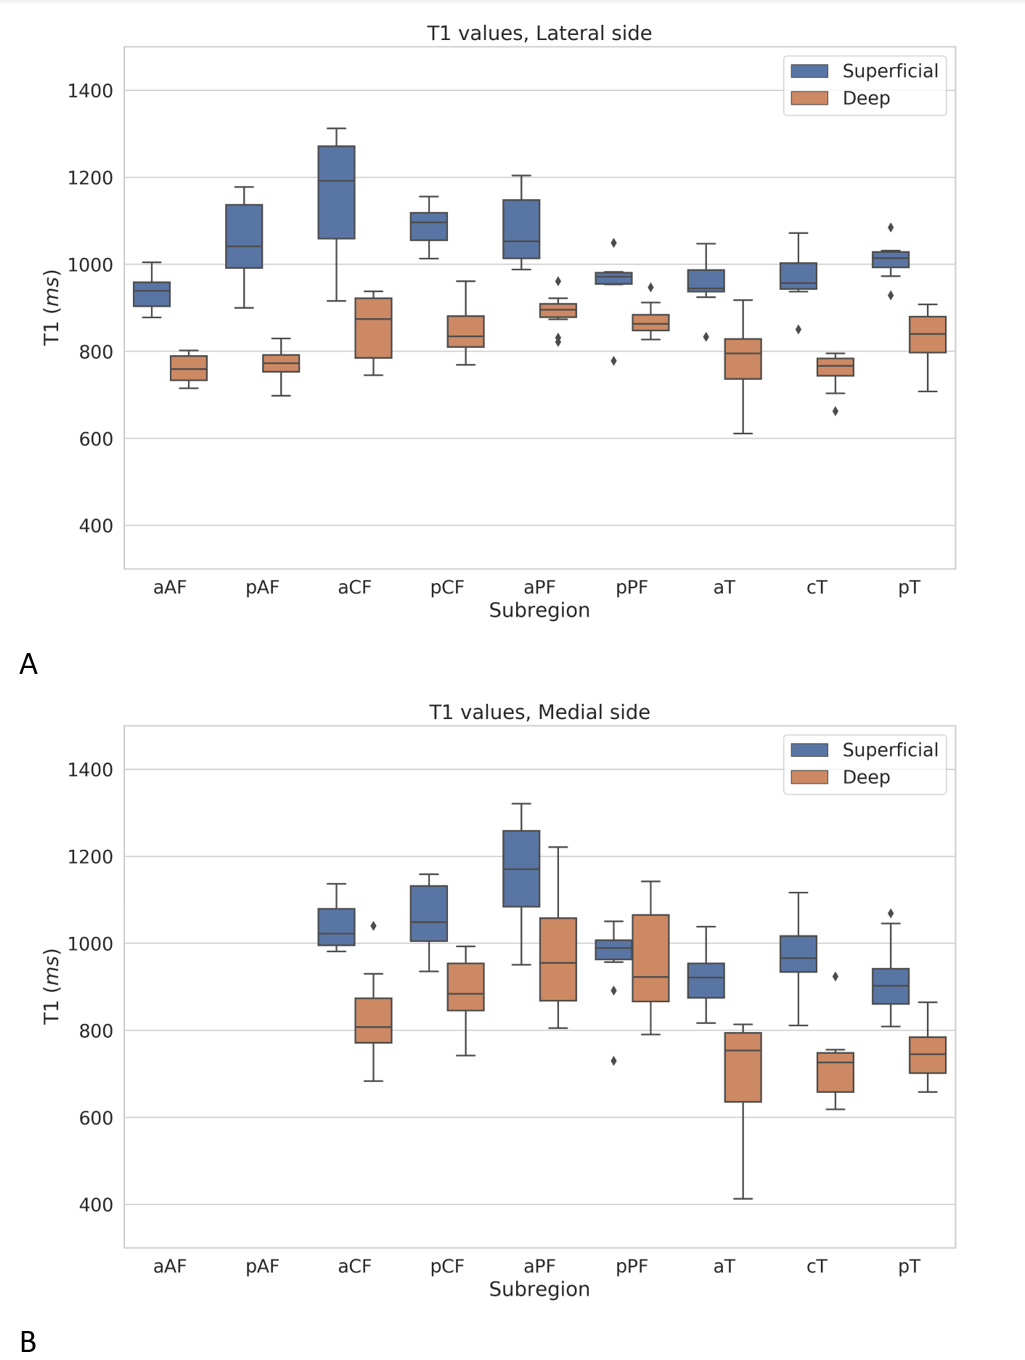
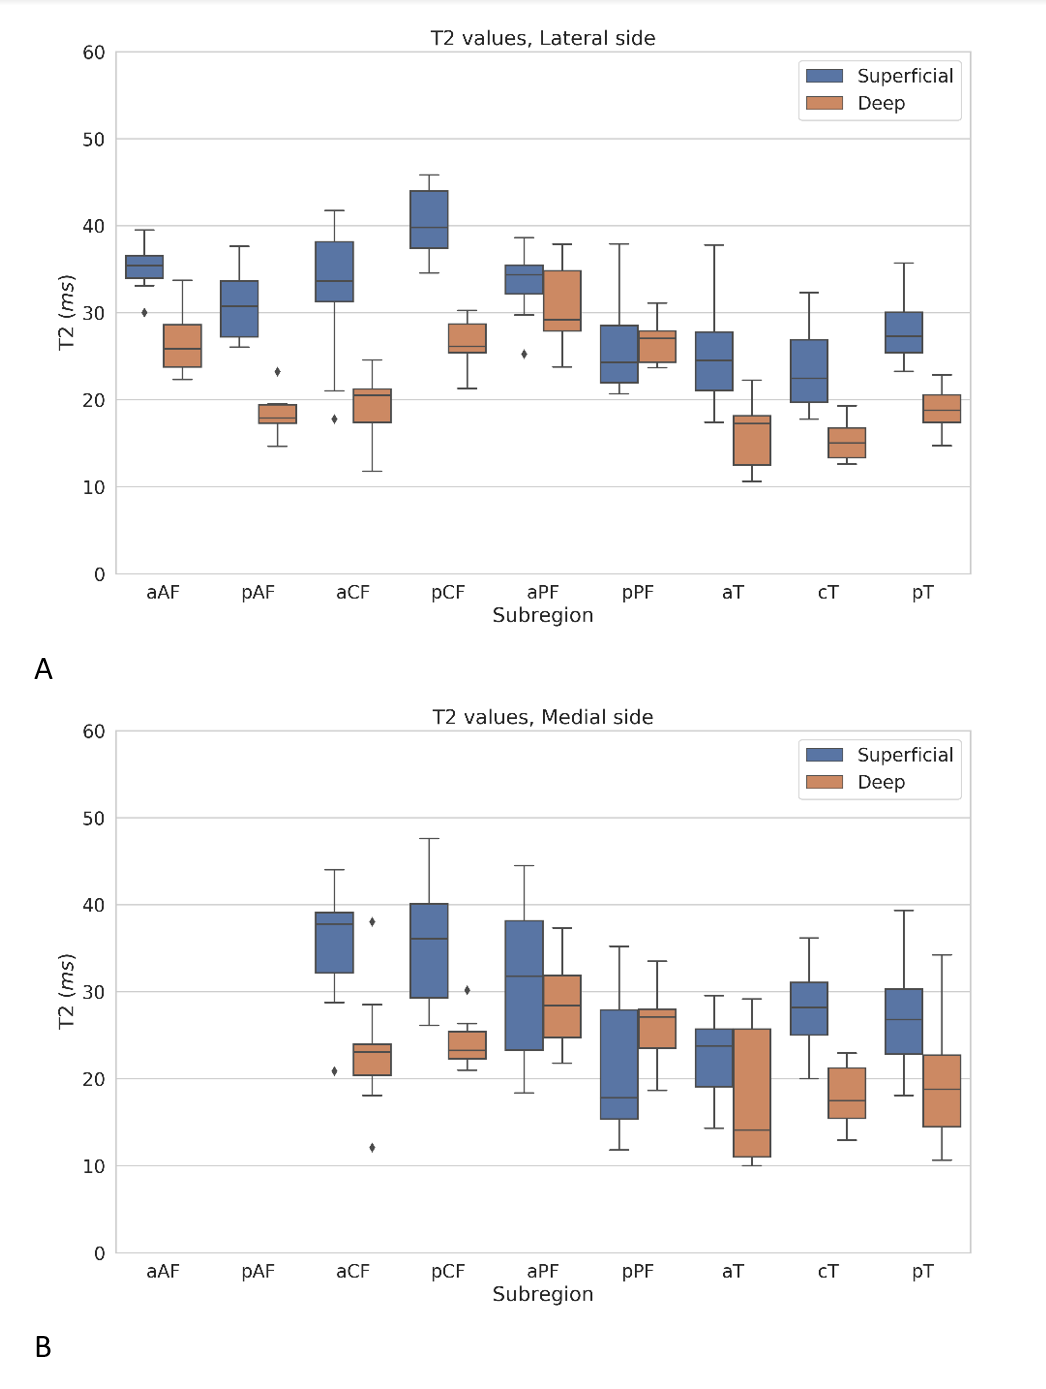
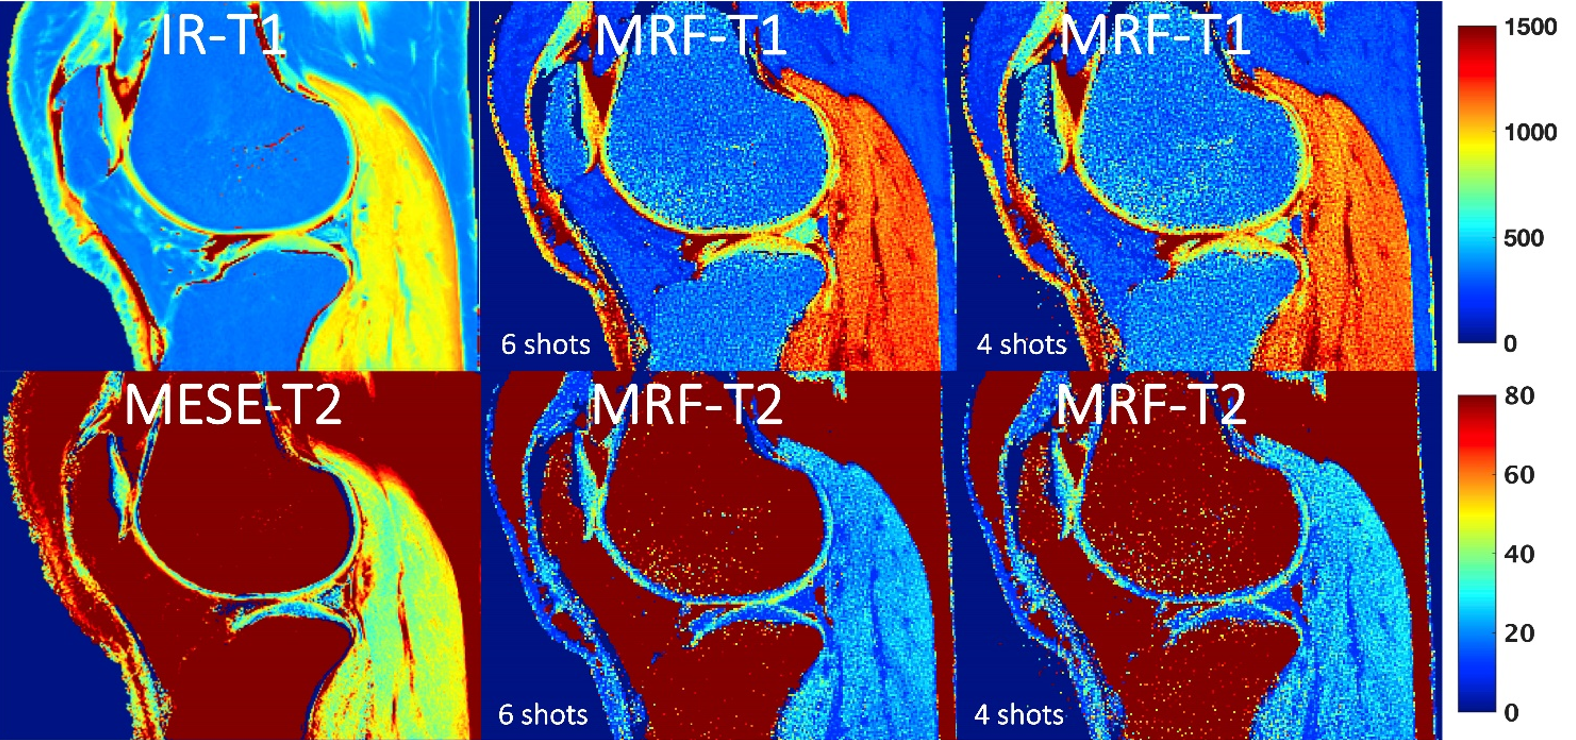
Phantom measurements showed strong correlation (r2>0.99) between MRF-T1s and the reference IR-T1s, as well as between MRF-T2s and MESE- and SE-T2 (Fig.2A-C). The intra- and inter-scanner RMS-CVs for MRF 6shots were 0.32%, 1.53% for T1 and 1.79%, 3.19% for T2, respectively. Bland-Altman analysis illustrated an average difference of 59.22, 18.88, and 4.56 ms for MRF-T1 vs. IR-T1, MRF-T2 vs. MESE-T2, and MRF-T2 vs. SE-T2, respectively (Fig.2D-F). Similar results were achieved using any number of shots. T2 relaxation times for MESE were higher than MRF and SE values (Fig.1B-C), and MRF-T2 values were closer to SE-T2s. From in vivo experiment, MRF-T1 values in deep cartilage were lower than in superficial cartilage (Fig.3 and 5). In the medial side, we observed high variances in deep cartilage between-subregions for MRF-T1. For MRF-T2, between-subregions variances in lateral side appeared higher than medial side (Fig.4). Relaxation times from MRF and conventional sequences displayed similar topographical variations in femoral and tibial cartilage (Fig.5), and generally shorter values compared to IR-T1 and MESE-T2.Discussion and Conclusion
To our knowledge, this study is the first to use MR fingerprinting for sub-regional analysis of knee cartilage tissues. Our findings confirmed accuracy and repeatability of MRF in phantoms, as previously showed by Sharafi et al. and Cloos et al.2,4As expected, MESE-T2 values were longer than SE-T2 due to the effect of stimulated echoes and T2-MRF values were closer to the reference T2-SE. Shorter T1 values were observed in MFR compared to IR, as previously reported.2,4,5 Topographical variation of relaxation time values from MRF and conventional MRI in femoral and tibial cartilage subregions were similar. Based on our results, the MRF relaxation values were longer in superficial than in deep cartilage regions, which agrees with the results reported in literature.6The cartilage maps from one in vivo case demonstrated that MRF-derived T1 and T2 values have lower variance in most subregions compared to those obtained with standard quantitative MRI sequences. On average, based on our results from phantoms and in vivo knee analysis, MRF-T1s have shorter values than IR-T1s. Our results suggest that MRF has a high potential to be used as a fast quantitative clinical imaging technique to monitor sub-regional knee cartilage changes at early stages of degenerative diseases, such as KOA.Acknowledgements
This work was supported by Jane and Erkko Foundation and NIH R01 AR070297.
References
1. Braun HJ, Gold GE. Advanced MRI of articular cartilage. Imaging Med. 2011. doi:10.2217/iim.11.43
2. Cloos MA, Assländer J, Abbas B, et al. Rapid Radial T1 and T2 Mapping of the Hip Articular Cartilage With Magnetic Resonance Fingerprinting. J Magn Reson Imaging. 2019. doi:10.1002/jmri.26615
3. Ma D, Gulani V, Seiberlich N, et al. Magnetic resonance fingerprinting. Nature. 2013. doi:10.1038/nature11971
4. Sharafi A, Zibetti MVW, Chang G, Cloos M, Regatte RR. MR fingerprinting for rapid simultaneous T1, T2, and T1ρ relaxation mapping of the human articular cartilage at 3T. Magn Reson Med. 2020. doi:10.1002/mrm.28308
5. Pai A, Li X, Majumdar S. A comparative study at 3 T of sequence dependence of T2 quantitation in the knee. Magn Reson Imaging. 2008. doi:10.1016/j.mri.2008.02.017
6. Hannila I, Lammentausta E, Tervonen O, Nieminen MT. The repeatability of T2 relaxation time measurement of human knee articular cartilage. Magn Reson Mater Physics, Biol Med. 2015. doi:10.1007/s10334-015-0494-3
Figures