2945
Hypercapnic challenge, BOLD fMRI and immunohistochemistry to examine the in-vivo presence of adult neurogenesis in the sheep hypothalamus
Pierre-Marie Chevillard1, Martine Migaud1, and Nathalie Just1
1NhyRVana, INRAE, Nouzilly, France
1NhyRVana, INRAE, Nouzilly, France
Synopsis
In the present work, we used hypercapnia measured with BOLD fMRI in ewes responding to photoperiodism to obtain a potential in-vivo marker of the presence of adult neurogenesis in their hypothalamus. Immunohistochemical methods were also used to analyse the relationships between blood vessels and Sox2 stained neural stem cells.
Introduction
The existence of adult neurogenesis (AN) remains controversial since no in-vivo experiments validated the presence of newborn neurons in regions of the brain known to demonstrate neurogenic potential (1). Immunohistochemical methods were used in the sheep hypothalamus to demonstrate the presence of hypothalamic AN (2, 3). Moreover, hypothalamic AN was shown to vary according to seasons (Fig.1) (2, 3). In sheep, photoperiodism is the physiological response of organisms to the ratio of the day to the night length. Here, Blood Oxygen Level dependent functional MRI (BOLD fMRI) was conducted across seasons at 3T under hypercapnic challenge in female sheep to examine the potential of BOLD response as an in-vivo marker of AN. In parallel, immunohistochemistry was used to characterize the architecture of the vasculature within the neurogenic niche according to seasons.Materials and Methods
Animals: female sheep (n=8) were used at 4 time points (P01, P02, P03 and P04) from May till July during long days (LD) and from late September till November during short days (SD).After immobilization, the sheep was intubated after intravenous administration of a mixture of ketamine and xylazine (20 mg/kg). Each ewe was installed prone on the MRI bed and anaesthesia was immediately switched to 1-1.5% isoflurane in medical air through a respirator (Aestiva, GE Healthcare, Datex-Ohmeda, USA). An oximeter was attached to the left hindfoot for the control of the partial pressure of oxygen and heart rate. The temperature was controlled through MRI-compatible rectal probe. MRI was conducted on a 3T whole body MR Scanner (Siemens Verio, Erlangen, Germany) with a large flex coil. BOLD fMRI was conducted using a multislice single shot EPI sequence (TR/TE= 2970/30 ms; flip angle = 90°; FOV = 188 x188 mm2 ; Matrix= 72 x 72; Slice thickness = 3 mm ; slices = 20). 7% CO2 was delivered through tubing directly connected to the intubation system. The paradigm of stimulation consisted of 5 cycles of 60 s OFF-60 s ON periods for a total acquisition time of 11 minutes. After BOLD fMRI, T1-weighted 3D magnetization prepared rapid gradient echo (MPRAGE) structural images (TR/TE/TI=2500/318/900 ms ; Flip angle = 12; NEX= 2 ; FOV=192 x 192 mm2, Matrix size = 384 x384) were acquired. Image processing: Functional MR images were processed with SPM12 software (Statistical Parametric Mapping, London, UK). After pre-processing, images were co-registred to structural MPRAGE images and normalized to the in-house developed sheep brain template (4). Finally, images were spatially smoothed using a 6 x 6 x 6 mm3 Gaussian kernel. The general linear model (GLM) first level analysis was conducted. BOLD responses were mapped as T-value maps overlaid onto our-in-house sheep atlas template (4). Significance of BOLD responses were evaluated at cluster level using FDR -corrected p-values set to 0.01. Second level SPM analysis was conducted to compare hypercapnia to baseline at each time point during LD and SD using a one sample t-test. Changes across time were also evaluated using 2-sample t-tests. A pvalue<0.05 was considered significant. Immunohistochemistry : Vasculature (surface) and neural stem cells (spots) were detected using Ricinus Communis Agglutinin (RCA) lectin and anti-Sox2 antibody respectively. In neurogenesis, Sox2 is expressed in developing and proliferating cells.Slide scanner images were processed with Imaris software (Bitplane, Belfast, UK).Results
Fig.2 A shows a structural MPRAGE image of the sheep brain delineating the hypothalamus. BOLD T value positive and negative maps show the extent of hypercapnic challenge across the sheep brain (Fig.2B-C). A representative example of BOLD time course is also shown. One sample t-tests were conducted population averaged T-value maps (Positive + Negative, Fig. 3) to explore the effects of hypercapnia against baseline during LD and during SD. Compared to LD, positive BOLD activity increased across the whole brain during SD. Increased positive BOLD activity was seen in the hypothalamus (arrows) at P02 and P04 during SD while negative BOLD was seen at P03 during SD. 2-sample t-tests were performed between average data obtained in October (P02 versus P03) and between average data obtained in October and in November (P03 versus P04) demonstrating significant positive changes within the hypothalamus (Fig.4A, arrows) and significant negative changes (Fig. 4B, arrows) within the hypothalamus, respectively. The median distance between vasculature and neural stem cells measured across seasons (in Long Photoperiod, LP and Short Photoperiod, SP) was calculated (Fig 5.B). Blood vessels (BV) are closer to neural stem cells during the long photoperiod in both anterior and posterior hypothalamus (Mann Whitney, *, p<0.05).Discussion
Here, hypercapnia measured using BOLD fMRI showed increased sensitivity within the sheep hypothalamus during SD. These findings could be related to the presence of AN during SD as found previously using immunohistochemical methods (2, 3). In addition, BOLD responses in hypothalamus upon hypercapnia evolved as a function of time during SD, which could be attributed to the reproductive cycle of ewes at this time of the year. Immunohistochemistry showed significant seasonal differences in the distances between neural stem cells and blood vessels within different regions of the hypothalamus. Further experiments using perfusion MRI, MR Spectroscopy and immunohistochemistry are ongoing to validate the existence in-vivo existence of AN and explore the regulation of AN by metabolic, neurovascular and/or angiogenic processes.Acknowledgements
This study was funded by a grant from Agence Nationale de la Recherche (ANR-16-CE37-0006-01)References
1. Gage FH. Adult neurogenesis in mammals; (2019); Science 364(6443), pp:827-28 2. Migaud et al. Emerging new sites for adult neurogenesis in the mammalian brain: a comparative study between the hypothalamus and the classical neurogenic zones (2010). European Journal of Neuroscience 32 (12), 2042-2052 3. Lévy et al. Adult neurogenesis in sheep: characterization and contribution to reproduction and behavior. (2017). Frontiers in neuroscience 11, 570 4. Ella et al. Computation of a high‐resolution MRI 3D stereotaxic atlas of the sheep brain (2017). Journal of Comparative Neurology 525 (3), 676-692Figures
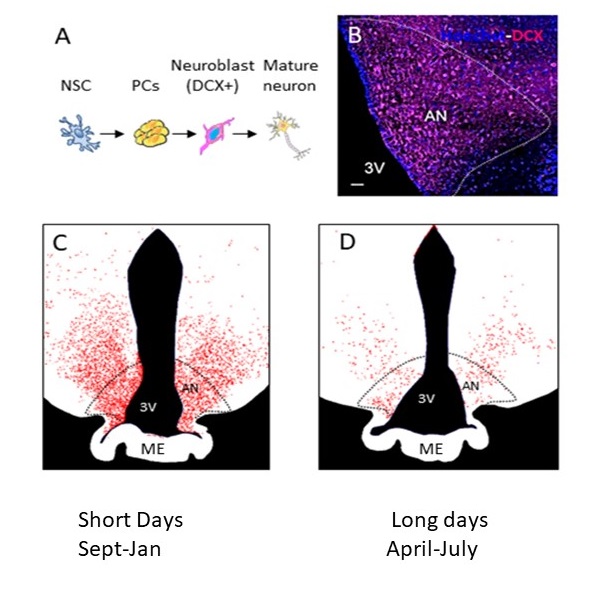
Figure 1: A.Different stages of AN: from neural stem cells (NSC) to doublecortin (DCX)-positive to mature neurons. B. Photomicrograph showing DCX positive (DCX+) staining in the arcuate nucleus of the sheep. C. Representative drawings showing variations in the number and distribution of DCX+ neuroblasts during SD (October) and D. during LD (May).
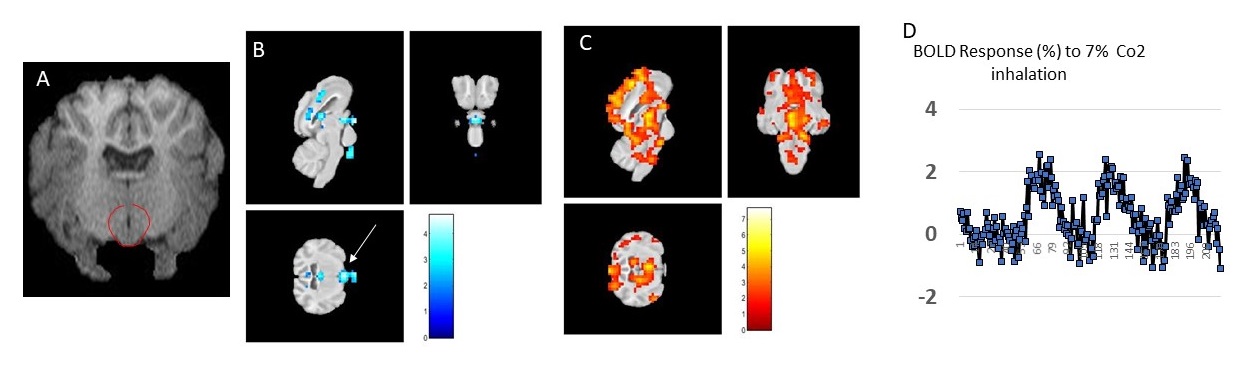
Figure 2. A. MPRAGE structural image of the sheep brain. The hypothalamus is delineated in red. B Negative BOLD T value map. Arrow indicates the hypothalamus and C. Positive BOLD T value maps of hypercapnia. D representative BOLD time course within the hypothalamus.
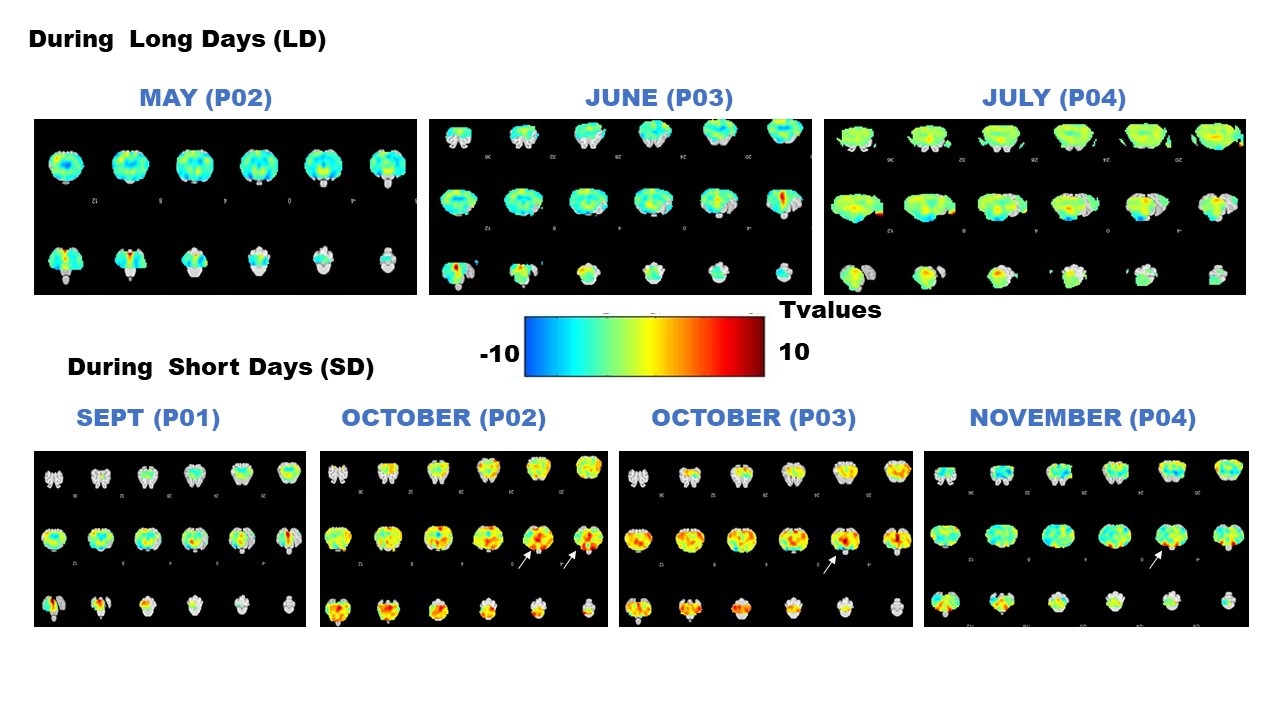
Group averaged T value maps comparing hypercania to baseline (One sample t-tests) at different time points during Long Days (LD) and during Short Days (SD). Arrows indicate statistically significant changes within the hypothalamus.
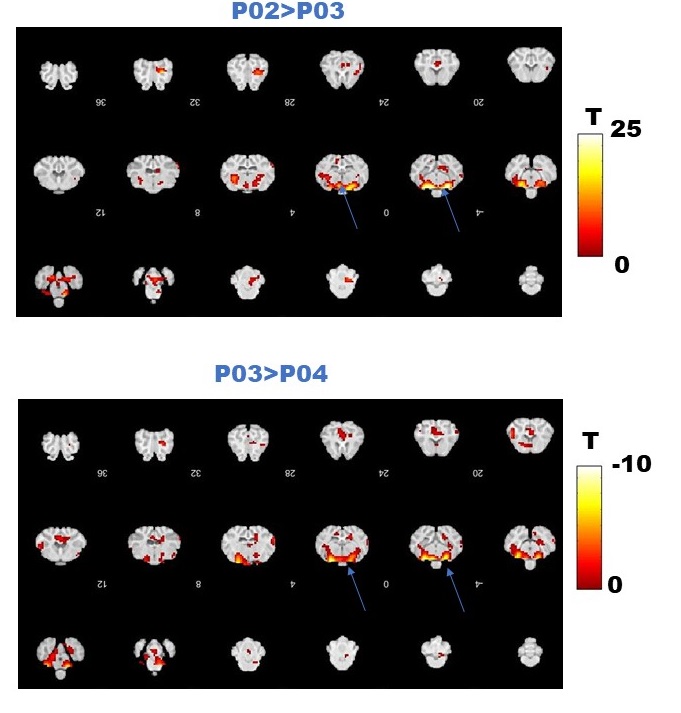
Figure 4. A. Comparison between group averaged data at two time points in October (P02 versus P03) during SD. Positive changes were found within the hypothalamus. B. Comparison between group averaged data at P03 (October) and P04 (November) during SD. Negative changes were found within the hypothalamus.
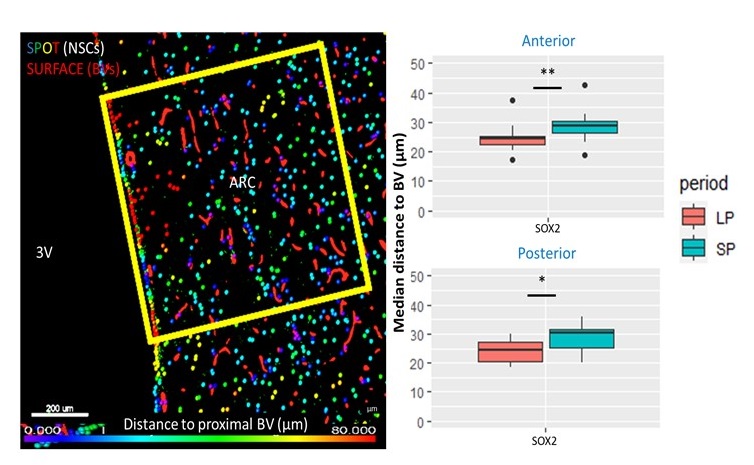
Figure 5. Immunohistochemistry data. A. Example of analysis in the arcuate nucleus (ARC) of the sheep hypothalamus near the 3rd ventricle showing the selection of a voxel of interest. Vessels (red surfaces) and stained neural stem cells (NSC) (SPOTS) can be seen. B. This analysis allowed statistical evaluation of the median distance between blood vessels (BV) and Sox2 stained NSCs demonstrating larger median distances during short day periods (SP) than long day periods (LP) in two different regions of the hypothalamus of sheep.