2941
Optogenetic fMRI interrogation of the olfactory system1Laboratory of Biomedical Imaging and Signal Processing, The University of Hong Kong, Hong Kong SAR, China, 2Department of Electrical and Electronic Engineering, The University of Hong Kong, Hong Kong SAR, China, 3Department of Diagnostic Radiology, Li Ka Shing Faculty of Medicine, The University of Hong Kong, Hong Kong SAR, China, 4School of Biomedical Sciences, Li Ka Shing Faculty of Medicine, The University of Hong Kong, Hong Kong SAR, China
Synopsis
The olfactory system is one of the major sensory systems and has been often linked to numerous non-olfactory regions pivotal for sensory perception and higher-order cognition. However, the extent of where olfactory signals are distributed brain-wide remains poorly described. By optogenetically stimulating the excitatory projection neurons in olfactory bulb (OB), we interrogated the brain-wide functional organization of the olfactory system using fMRI. We revealed that OB neural activity propagated to regions that are associated with higher-order cognition, reward-related behaviors and multisensory processing.
Introduction
The olfactory system plays an essential role in mediating social behaviors by integrating olfactory signals with inputs from other sensory systems and previous experiences1. The olfactory bulb (OB) is the first stage in central olfactory processing, linking the peripheral smell receptors to the rest of the central nervous system. OB is arranged in a laminar structure, which contains numerous projection neurons (i.e., mitral and tufted cells). Hence, it is an excellent target to study olfactory circuits and functions2. OB neurons have been manipulated to examine how smell is coded and processed in the primary olfactory cortex3-5. However, the majority of these studies focused on local olfactory micro-circuits (i.e., the projections from OB to anterior olfactory nucleus, AON, and piriform cortex, Pir). How olfactory signals are transferred to and processed at regions beyond the primary olfactory circuits has not been well studied.In this study, we aim to investigate the extent of brain-wide olfactory pathways using combined optogenetics and functional MRI (fMRI), which enables cell-type specific control of OB neurons while visualizing whole brain responses simultaneously. Here, we optogenetically stimulated the mitral and tufted cells in OB at different frequencies to examine the spatiotemporal properties of neuronal activity propagation along the long-range olfactory pathways.
Methods
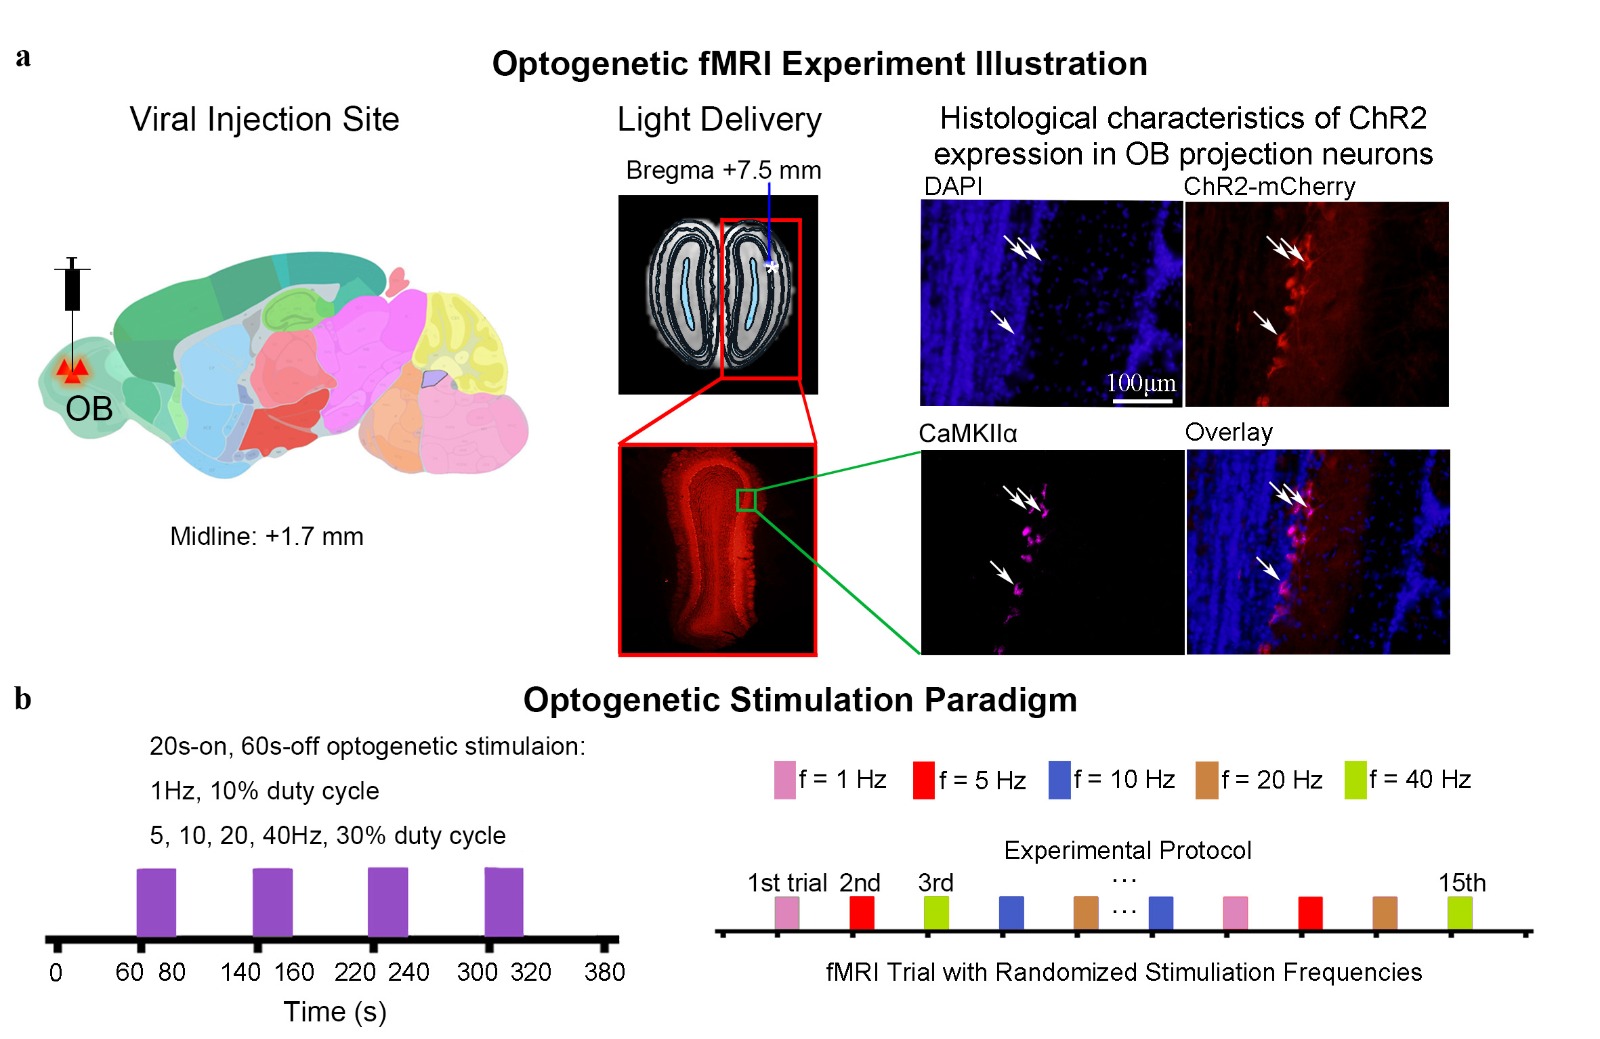
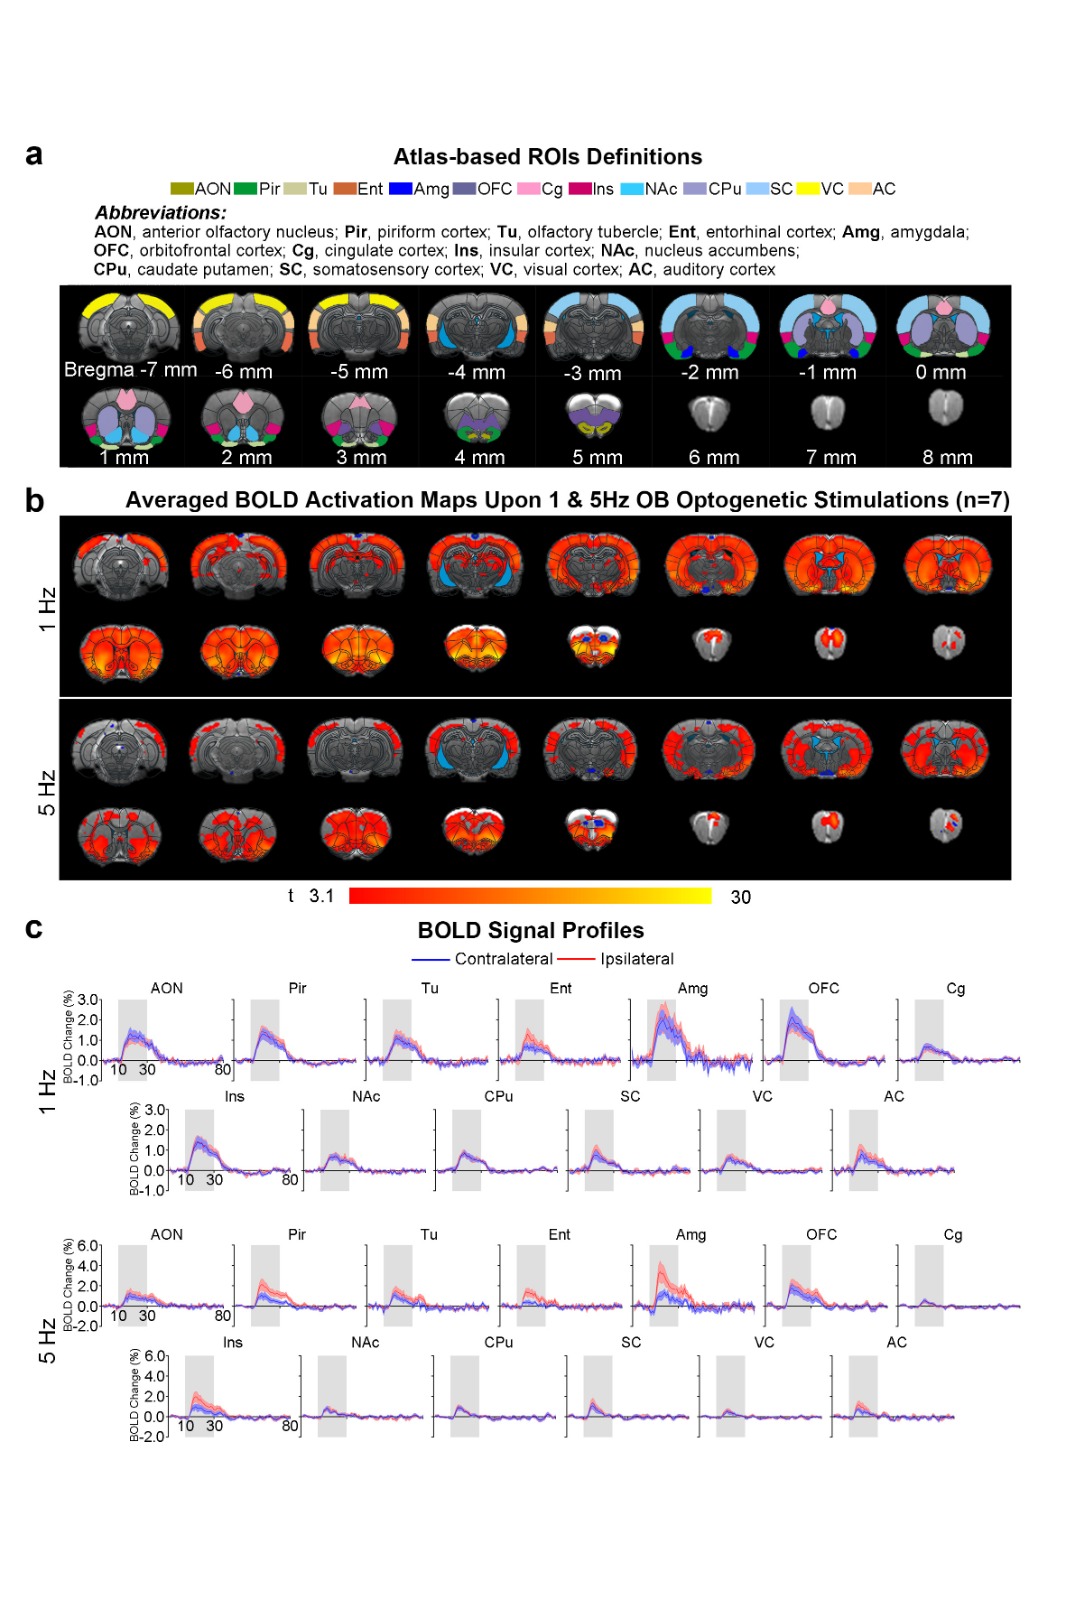
Animal preparation and optogenetic stimulation: 3μl of AAV5-CaMKIIα::ChR2(H134R)-mCherry was injected to OB (7.5mm anterior to Bregma, +1.7mm medial-lateral right hemisphere, -2.2mm from the surface of dura) of adult rats (200-250g, male, SD strain, n=7). Four weeks after injection, an opaque optical fiber cannula (d=450μm) was implanted at the injection site (Figure 1a). Blue (473nm) light was presented to animals expressing ChR2 at 1Hz (10% duty cycle, 40mW/mm2), 5, 10, 20 and 40Hz (30% duty cycle, 40mW/mm2) in a block-design paradigm (20s on and 60s off; Figure 1b).fMRI acquisition and analysis: fMRI data was acquired on 7T Bruker scanner using GE-EPI (FOV=32×32mm2, matrix=64×64, α=56°, TE/TR=20/1000ms, and 20 contiguous slices with 1mm thickness). Data were preprocessed before standard GLM analysis was applied to identify significant BOLD responses (p<0.001; FDR corrected).
Results
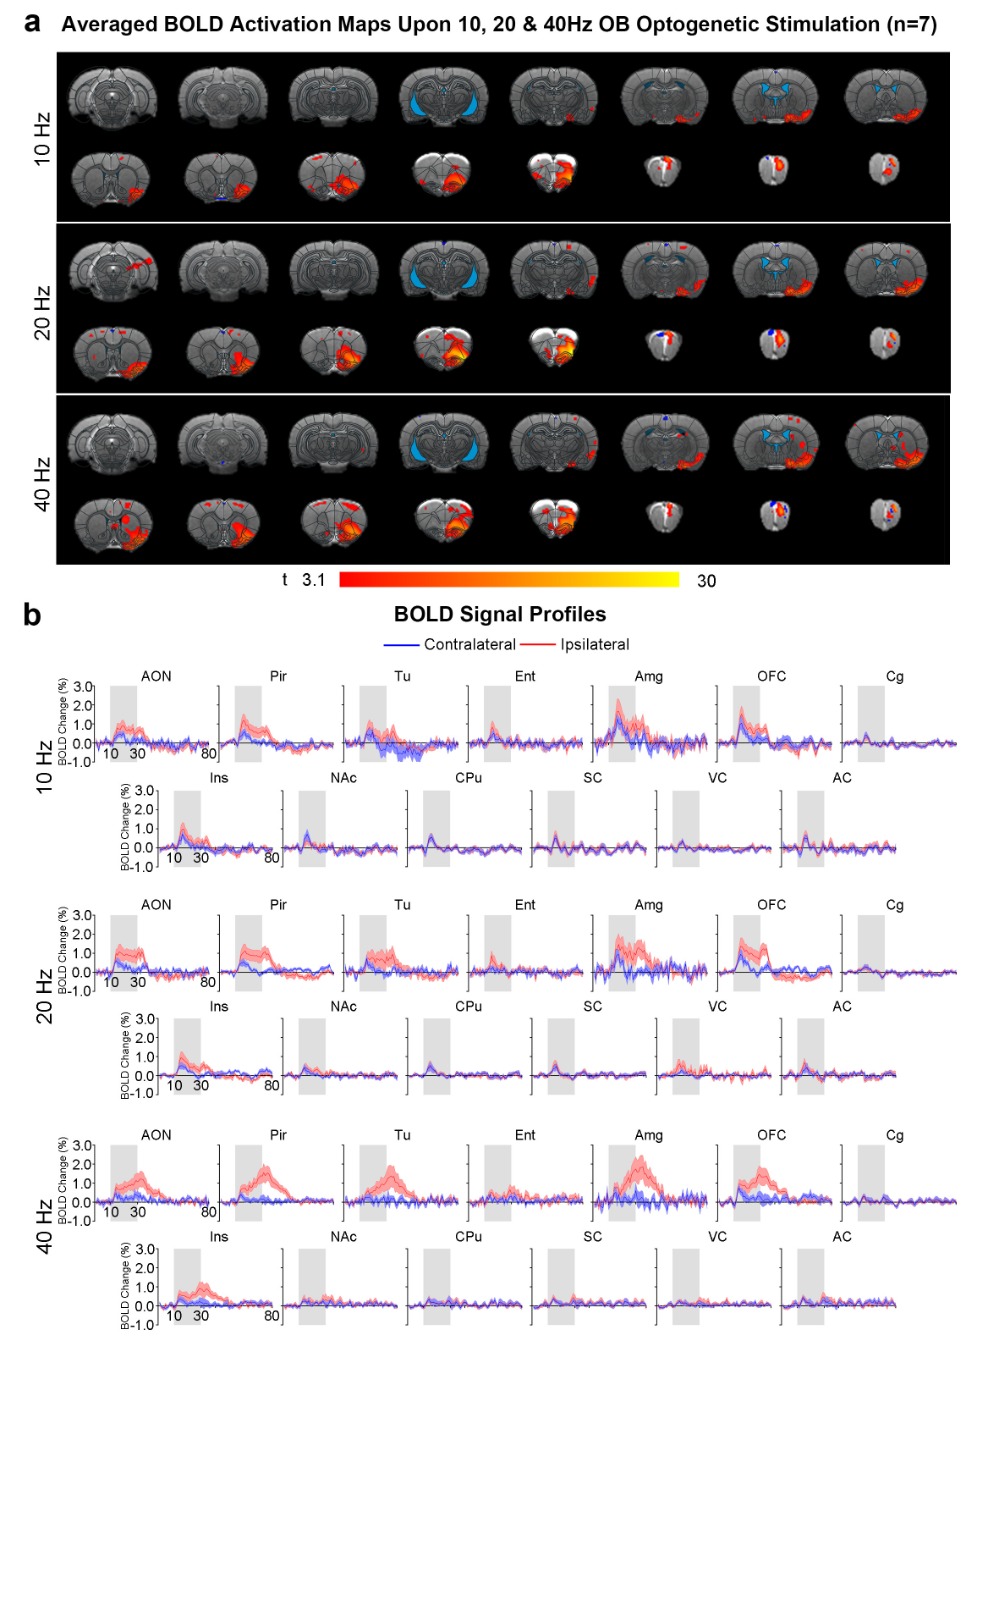
Brain-wide activations upon low frequency optogenetic stimulation of OB projection neurons: Optogenetic stimulation of ipsilateral OB at all frequencies evoked activations in known primary olfactory regions, including AON, Pir, olfactory tubercle (Tu), entorhinal cortex (Ent), and amygdala (Amg; Figures 2 and 3). 1Hz and 5Hz stimulation further evoked bilateral activations in the orbitofrontal cortex (OFC), cingulate cortex (Cg), insular cortex (Ins), nucleus accumbens (NAc), caudate putamen (CPu), somatosensory (SC), visual (VC) and auditory (AC) cortices (Figure 2b). Additionally, we observed that the BOLD response strength at all activated regions during 1Hz stimulation were generally similar across both hemispheres, while contralateral responses were weaker than the ipsilateral upon 5Hz stimulation (Figure 2c). These activations indicate that the presence of interactions between primary olfactory circuits and other regions associated with higher-order functions beyond olfaction such as cognition, reward and other sensory processing.Localized activations in regions of primary olfactory circuits upon high frequency optogenetic stimulation: Robust activations evoked by 10Hz, 20Hz and 40Hz were mainly localized in primary olfactory regions and OFC (Figure 3). At high frequencies, the activations in the ipsilateral hemisphere were much stronger than their contralateral counterparts (Figure 3b). Interestingly, the BOLD signal profiles in AON, Pir, Amg, OFC, Tu at different frequencies varied temporally. After reaching the first peak, the BOLD signal profiles decayed sharply at 1Hz and 5Hz, decayed slower at 10Hz, remained steady at 20Hz, and increased approximately linearly at 40Hz. These findings indicate that such dynamic characteristics in the BOLD responses are likely driven by neural interactions that occur within the primary olfactory circuits6,7. Note that the activation maps of 20Hz stimulation appears to be statistically more significant, which is likely due to the BOLD responses that closely resembled the canonical HRF model utilized by GLM analysis.
Discussion & Conclusion
In this study, we revealed the brain-wide downstream targets of neural activities initiated from OB and their spatiotemporal characteristics. We demonstrated that at low frequencies, robust activations were found at higher-order regions associated with functions beyond central olfactory processing, including cognition (i.e., Ent, Amg, OFC, Cg, and Ins), reward-related behavior8-10 (i.e. Tu, NAc and CPu), and sensory processing11-13 (i.e. SC, VC and AC). OFC and Amg receive direct projections from the olfactory system14 and are shown to play important roles in associative learning and memory recall15. Furthermore, OFC is involved in integrating numerous sensory systems16,17 (i.e., olfactory, visual, auditory, somatosensory) for multisensory processing. More importantly, activations at Tu, NAc and CPu indicate that olfaction is directly associated to reward-seeking behaviors which are vital for animals’ survival.Interestingly, we observed that bilateral BOLD activations at Cg, SC, VC, AC were more robust under low frequency stimulation (1Hz and 5Hz). A previous study showed that delta band neuronal oscillations (0.5-4Hz) in the whisker barrel cortex were phase locked to the respiration rhythm and were mostly driven by OB activity18. Our findings indicate that low frequency stimulation at excitatory projection neurons in OB might induce low frequency oscillations (e.g., delta oscillation), which then engage the large-scale cross-modal interactions between sensory systems. Future experiments will probe the functional relevance of such neural activity propagation/interactions between olfactory and other systems.
Acknowledgements
This study was supported by Hong Kong Research Grant Council (R7003-19, C7048-16G, HKU17112120, HKU17103819 and HKU17104020), Guangdong Key Technologies for Treatment of Brain Disorders (2018B030332001), and Guangdong Key Technologies for Alzheimer’s Disease Diagnosis and Treatment (2018B030336001).References
1. Albrecht, J. & Wiesmann, M. in Encyclopedia of Neuroscience (eds Marc D. Binder, Nobutaka Hirokawa, & Uwe Windhorst) 3003-3006 (Springer Berlin Heidelberg, 2009).
2. Ennis, M., Puche, A. C., Holy, T. & Shipley, M. T. in The Rat Nervous System 761-803 (2015).
3. Grimaud, J. & Lledo, P. M. Illuminating odors: when optogenetics brings to light unexpected olfactory abilities. Learn Mem 23, 249-254, doi:10.1101/lm.041269.115 (2016).
4. Genovese, F., Thews, M., Mohrlen, F. & Frings, S. Properties of an optogenetic model for olfactory stimulation. J Physiol 594, 3501-3516, doi:10.1113/JP271853 (2016).
5. Li, A., Gire, D. H., Bozza, T. & Restrepo, D. Precise detection of direct glomerular input duration by the olfactory bulb. J Neurosci 34, 16058-16064, doi:10.1523/JNEUROSCI.3382-14.2014 (2014).
6. Martin, C. & Ravel, N. Beta and gamma oscillatory activities associated with olfactory memory tasks: different rhythms for different functional networks? Front Behav Neurosci 8, 218, doi:10.3389/fnbeh.2014.00218 (2014).
7. Mori, K. & Sakano, H. Olfactory Circuitry and Behavioral Decisions. Annu Rev Physiol, doi:10.1146/annurev-physiol-031820-092824 (2020).
8. Ikemoto, S. Dopamine reward circuitry: two projection systems from the ventral midbrain to the nucleus accumbens-olfactory tubercle complex. Brain Res Rev 56, 27-78, doi:10.1016/j.brainresrev.2007.05.004 (2007).
9. Ferenczi, E. A. et al. Prefrontal cortical regulation of brainwide circuit dynamics and reward-related behavior. Science 351, aac9698, doi:10.1126/science.aac9698 (2016).
10. Fitzgerald, B. J., Richardson, K. & Wesson, D. W. Olfactory tubercle stimulation alters odor preference behavior and recruits forebrain reward and motivational centers. Front Behav Neurosci 8, 81, doi:10.3389/fnbeh.2014.00081 (2014).
11. Rolls, E. T. & Baylis, L. L. Gustatory, olfactory, and visual convergence within the primate orbitofrontal cortex. The Journal of Neuroscience 14, 5437, doi:10.1523/JNEUROSCI.14-09-05437.1994 (1994).
12. Cohen, L., Rothschild, G. & Mizrahi, A. Multisensory integration of natural odors and sounds in the auditory cortex. Neuron 72, 357-369, doi:10.1016/j.neuron.2011.08.019 (2011).
13. Johnson, D. M. G., Illig, K. R., Behan, M. & Haberly, L. B. New Features of Connectivity in Piriform Cortex Visualized by Intracellular Injection of Pyramidal Cells Suggest that “Primary” Olfactory Cortex Functions Like “Association” Cortex in Other Sensory Systems. The Journal of Neuroscience 20, 6974, doi:10.1523/JNEUROSCI.20-18-06974.2000 (2000).
14. Gottfried JA, W. D. in Neurobiology of Sensation and Reward (ed Gottfried JA) Ch. 5, (Boca Raton (FL): CRC Press/Taylor & Francis, 2011).
15. Schoenbaum, G., Setlow, B., Saddoris, M. P. & Gallagher, M. Encoding predicted outcome and acquired value in orbitofrontal cortex during cue sampling depends upon input from basolateral amygdala. Neuron 39, 855-867, doi:Doi 10.1016/S0896-6273(03)00474-4 (2003).
16. Gottfried, J. A. Smell: central nervous processing. Adv Otorhinolaryngol 63, 44-69, doi:10.1159/000093750 (2006).
17. Wesson, D. W. & Wilson, D. A. Smelling sounds: olfactory-auditory sensory convergence in the olfactory tubercle. J Neurosci 30, 3013-3021, doi:10.1523/JNEUROSCI.6003-09.2010 (2010).
18. Ito, J. et al. Whisker barrel cortex delta oscillations and gamma power in the awake mouse are linked to respiration. Nat Commun 5, 3572, doi:10.1038/ncomms4572 (2014).
Figures