2940
Detecting functional connectivity changes in a pig traumatic brain injury model using resting-state fMRI1Department of Physics and Astronomy, University of Georgia, Athens, GA, United States, 2Regenerative Bioscience Center, University of Geogia, Athens, GA, United States
Synopsis
Functional magnetic resonance imaging (fMRI) has great potential to evaluate how networks respond and compensate for network dysfunction caused by traumatic brain injury (TBI). In this study, sparse dictionary learning (sDL) and independent component analysis (ICA) were applied to resting-state fMRI (rs-fMRI) data, collected from a group of piglets 1-day (D1) and 7-days (D7) after TBI. Activation maps were generated using group ICA and group sDL, both with dual regression. Voxel-wise permutation tests were then applied to identify changes to six resting-state networks (RSNs). Consistency was observed through the two methods, indicating functional network activity changes after injury.
Introduction
TBI is a worldwide problem, affecting millions of patients each year, resulting in cognitive, behavioral and motor deficits1. fMRI is a popular tool used to evaluate changes in network activity2 and can be employed to investigate functional connectivity disruptions after a TBI. In this study, fMRI data was collected from piglets, which have brains that closely resemble the human brain in anatomical structure and physiology3, that received a TBI. The data were analyzed using sDL and ICA, together with dual regression and permutation test methods.Methods
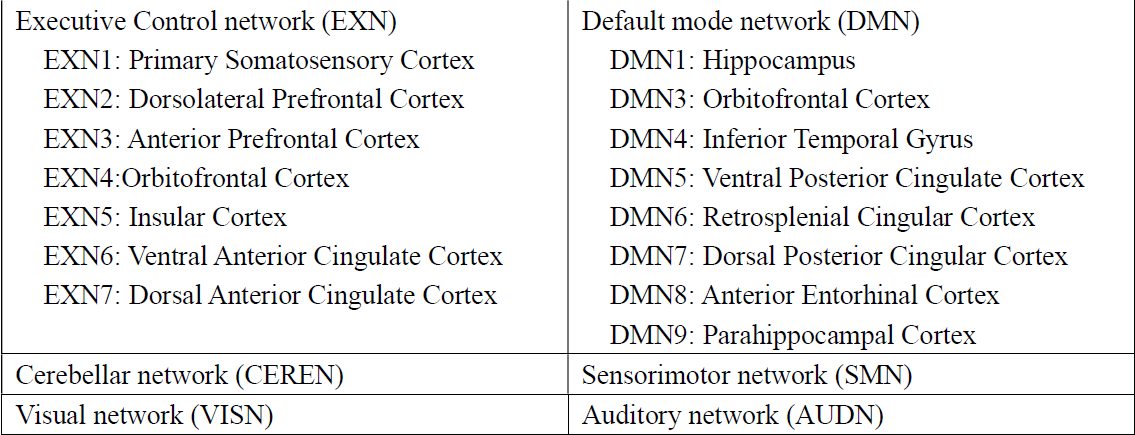
Data acquisition: TBI was induced in the left hemisphere of four-week-old Landrace-cross piglets (n=6) using a controlled cortical impactor4. T1-weighted anatomical and rs-fMRI (a total of 305 volumes) data were collected at Day1 and Day7 post-TBI, using a GE 32-channel fixed-site Discovery MR750 3.0 Tesla magnet and an 8-channel knee coil. All experimental procedures were approved by the Institutional Animal Use and Care Committee (University of Georgia).Data Processing: Preprocessing was conducted using SPM12 for head motion correction and slice timing correction. The first 5 time points were discarded from a total of 305 points. All fMRI data are registered to that of a template pig, and then to the template pig’s anatomical images. Six RSNs and corresponding atlases were created (see Figure 4) using a previously published procedure2. Among the six RSNs, subnetworks of EXN and DMN were also included allowing detailed subnetwork analysis.
Data analysis: Functional connectivity analysis was conducted using two methods. First, temporally concatenated rs-fMRI data (combined day-1 and day-7 data) was analyzed with group ICA by using FSL MELODIC software. The high pass filter cutoff was set to 100s for resting-state analysis. Six trials using different component numbers from 30 to 100 were conducted. Next, the rs-fMRI data was analyzed with sDL by using SPAMS (SPArse Modeling Software) toolbox5. Similar to the ICA, six trials with various sparsity parameters and atom numbers were conducted. Additionally, dual regression was applied using SPAMS for sDL analysis and FSL for ICA analysis. Activation maps for individual subjects were collected using both methods.
Pearson correlation analysis was performed using group activation maps acquired from sDL and ICA, respectively, and registered functional connectivity atlas. The top three atoms for sDL and the top one component for ICA with the highest Pearson correlation with each RSN were documented, and corresponding atoms/components in an individual subject’s activation maps were picked for the permutation test. The sDL’s three maps are then averaged for each individual subject. Voxel-wise permutation test was applied through the activation maps for all 12 datasets (D1 post-TBI n=6; D7 post-TBI n=6). The α level (significance level) was set to 0.05.
Results and Discussions
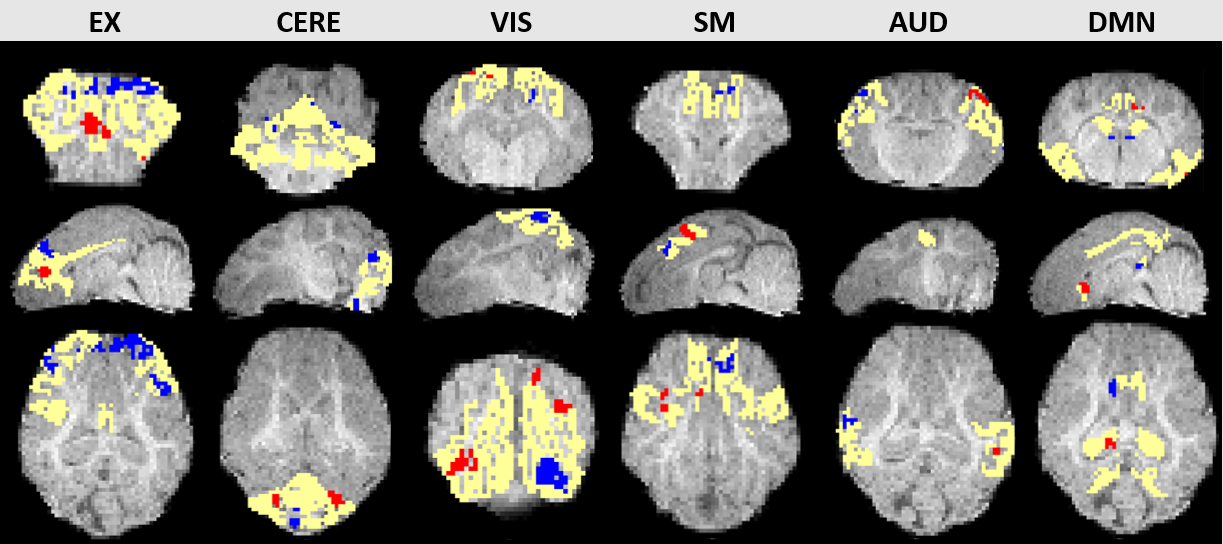
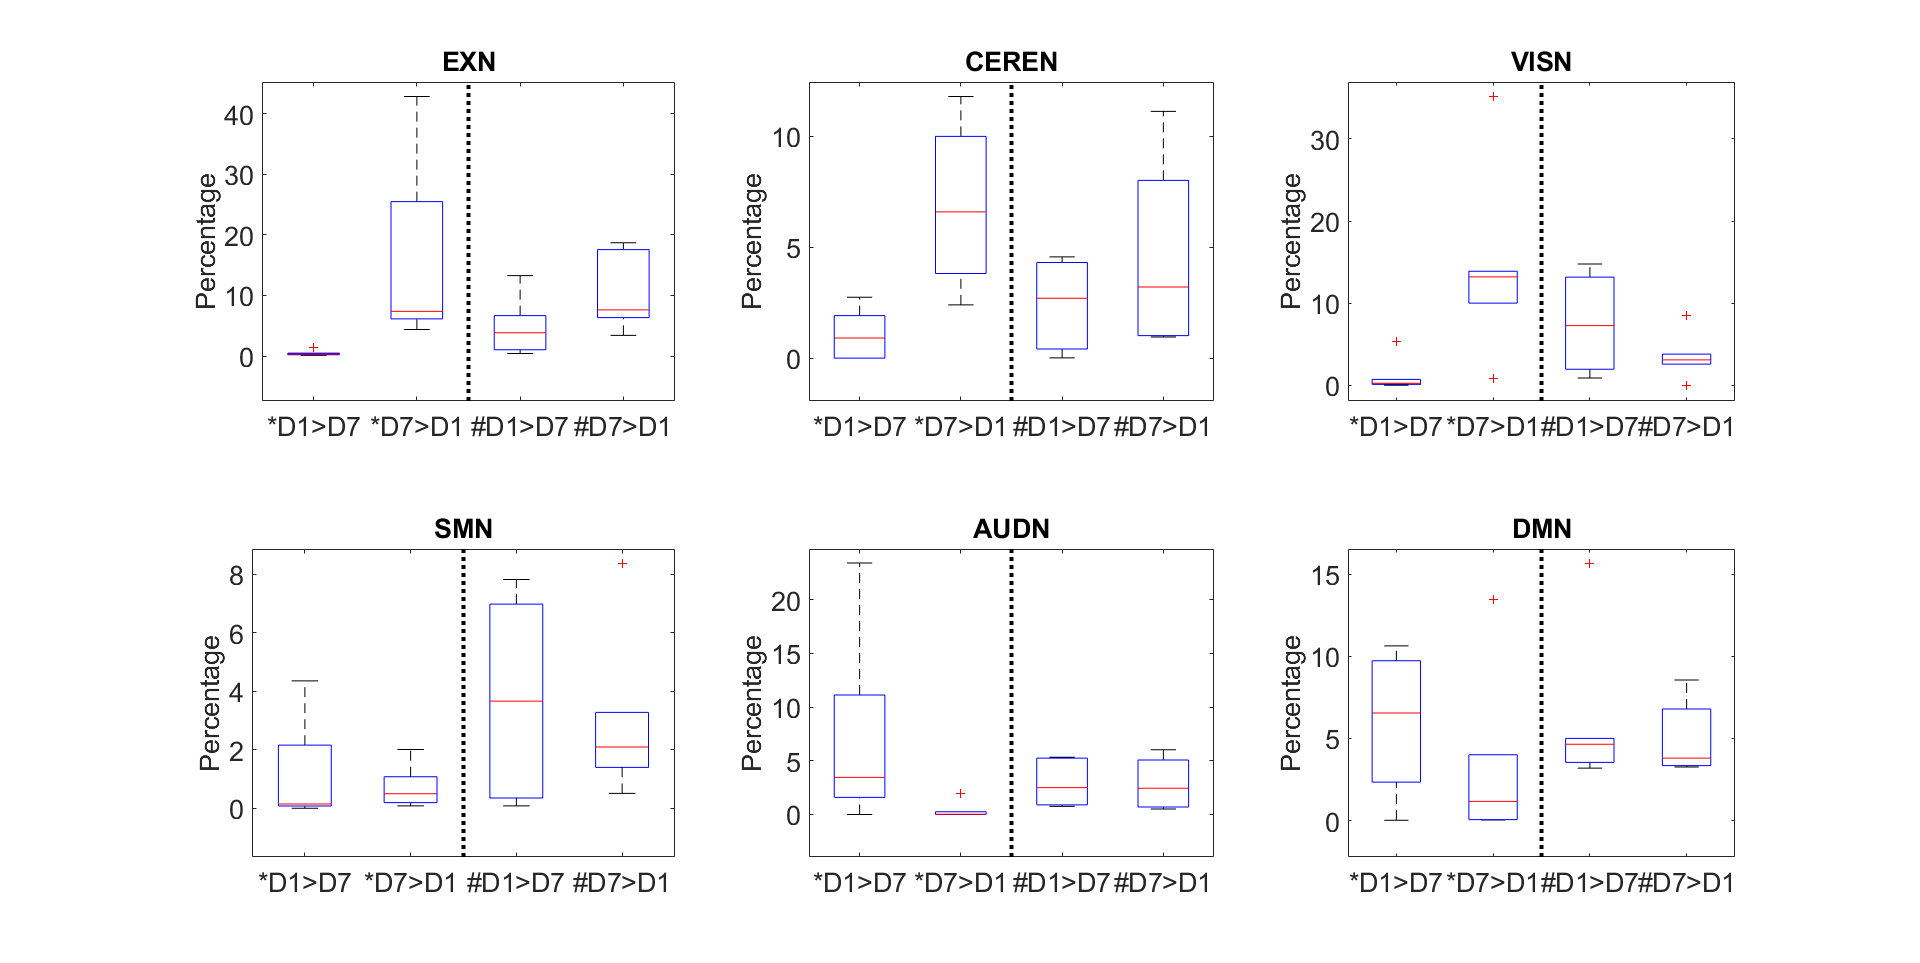
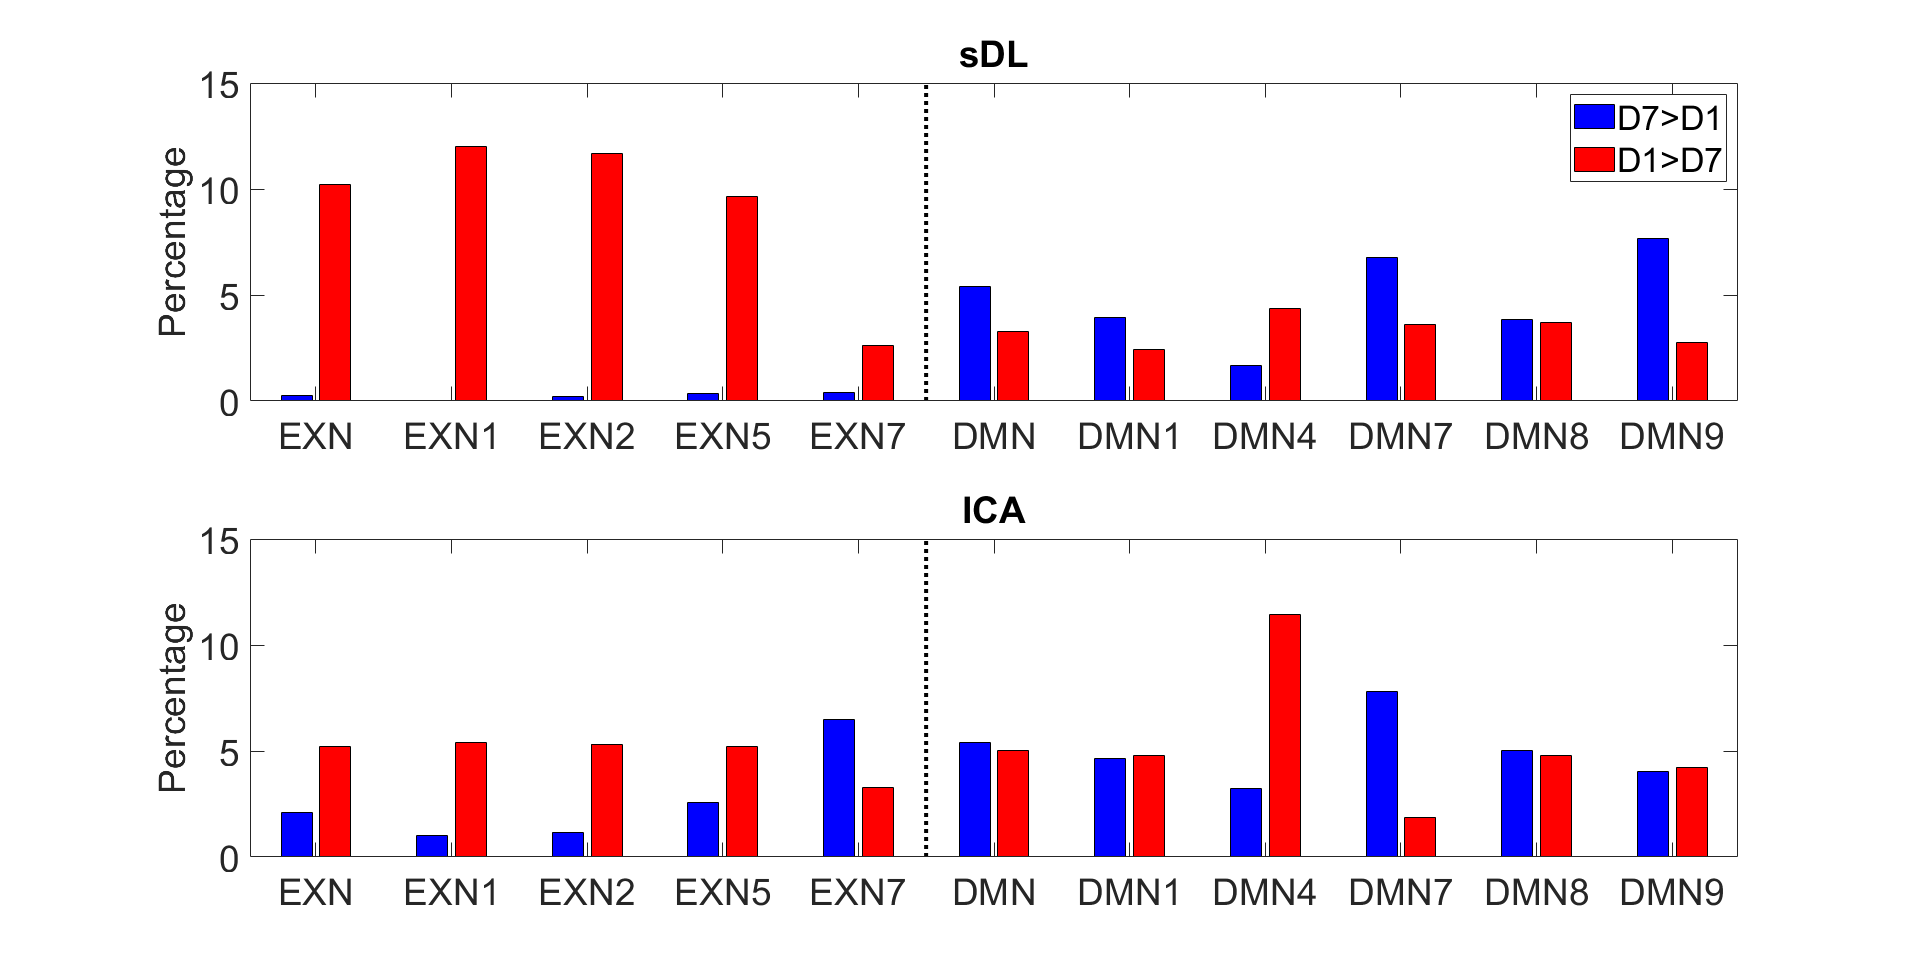
Figure 1 shows representative images of decreasing (D7<D1) or increasing (D7>D1) functional activity in 6 RSNs. The voxel-wise permutation test counted the number of voxels that had a significant difference in activation level, including all sDL and ICA trials, as shown in Figure 2. The boxplots display either decreasing voxel numbers (i.e., day 1 higher than day 7, D7<D1) or increasing voxels (D7>D1) in 6 RSNs. Figure 3 shows subnetwork analysis in more details, counting voxels with significant difference in major subnetworks of two major RSN, EXN and DMN, providing a more in-depth evaluation of trending results.Consistency between sDL and ICA for RSN evaluation can be observed in both figures. In figure 2, the results showed similar increasing trends of more activated voxels (D7>D1) in the EXN and CEREN networks, and slightly decreasing trends or no change for other networks. Furthermore, subnetwork results for EX network in Figure 3 showed the same increasing trends for the whole EXN network and major subnetwork that had more than 100 voxels. On the other hand, DMN showed a decreasing trend for the whole network and most of the major subnetworks.
Overall, these results indicated strong confidence of similar performance in sDL and ICA. The two methods demonstrated consistency evaluating 3 resting-state networks (EXN, CEREN and DMN) and their associated major subnetworks.
Acknowledgements
This work was supported by the Franklin Foundation for Neuroimaging and the College of Agricultural and Environmental Sciences, University of Georgia.References
1. A. I. Maas, N. Stocchetti and R. Bullock, Lancet Neurol 7 (8), 728-741 (2008).
2. G. Simchick, A. Shen, B. Campbell, H. J. Park, F. D. West and Q. Zhao, Brain connectivity (ja) (2019).
3. H. A. Kinder, E. W. Baker and F. D. West, Neural regeneration research 14(3): 413 (2019).
4. E. W. Baker, H. A. Kinder, J. M. Hutcheson, K. J. J. Duberstein, S. R. Platt, E. W. Howerth and F. D. West, J Neurotrauma 36 (1), 61-73 (2019).
5. J. Mairal, F. Bach, J. Ponce and G. Sapiro, presented at the Proceedings of the 26th annual international conference on machine learning, 2009 (unpublished).
Figures