2939
Spatiotemporal aberrations in resting-state quasi-periodic patterns in 4-month-old TgF344-AD rats1Bio-Imaging Lab, University of Antwerp, Wilrijk, Belgium
Synopsis
To identify spatiotemporal network alterations at an early stage of AD, we’ve performed rsfMRI and analysed quasi-periodic patterns in 4-month old TgF344-AD rats. We observed spatiotemporal alterations in whole brain network activity, mainly in the basal forebrain and cingulate cortex. Moreover, occurrences of QPPs were significantly lower in TgF344-AD rats. Co-activation of basal forebrain and cingulate cortex, present in wild-type rats, was greatly reduced in TgF344-AD rats. These results highlight the important role of the BFB in orchestrating brain networks and indicate a potential signature to identify early onset changes at the network level.
Introduction
Alzheimer’s Disease (AD) is a severe neurodegenerative disorder that leads to brain network dysfunction and cognitive decline. Changes in functional networks at symptomatic stages of AD can be captured using resting state (RS) fMRI in patients [1, 2] and animal models [3, 4]. Here, we used a rat model manifesting the full-spectrum of human AD-pathology to identify if spatiotemporal network alterations are present at an early, pre-symptomatic stage.Materials and Methods
RS fMRI data was collected from four-month-old TgF344-AD rats (N=15) and wildtype (WT) (N=11) littermates. Acquired images were realigned, normalized to a 3D-template, masked, smoothed, filtered and the global signal was regressed out. Recurrent patterns of brain activity (3.6 seconds long) were extracted using quasi-periodic pattern (QPP) analysis starting from 200 different seed patterns. Then, the 200 patterns of each group were clustered based on temporal and spatial similarity to identify the representative QPPs (rQPPs) based on occurrence rates. Voxel-wise activations of matched rQPPs across groups were compared using a two-sample t-test, FDR corrected for multiple comparisons. Next, BOLD intensities from three regions of interest during the QPP were extracted and averaged across QPP occurrences, after which time courses from both groups were compared using a two-sample t-test. Finally, occurrence rates of all QPPs within the cluster were compared using a two-sample t-test.Results
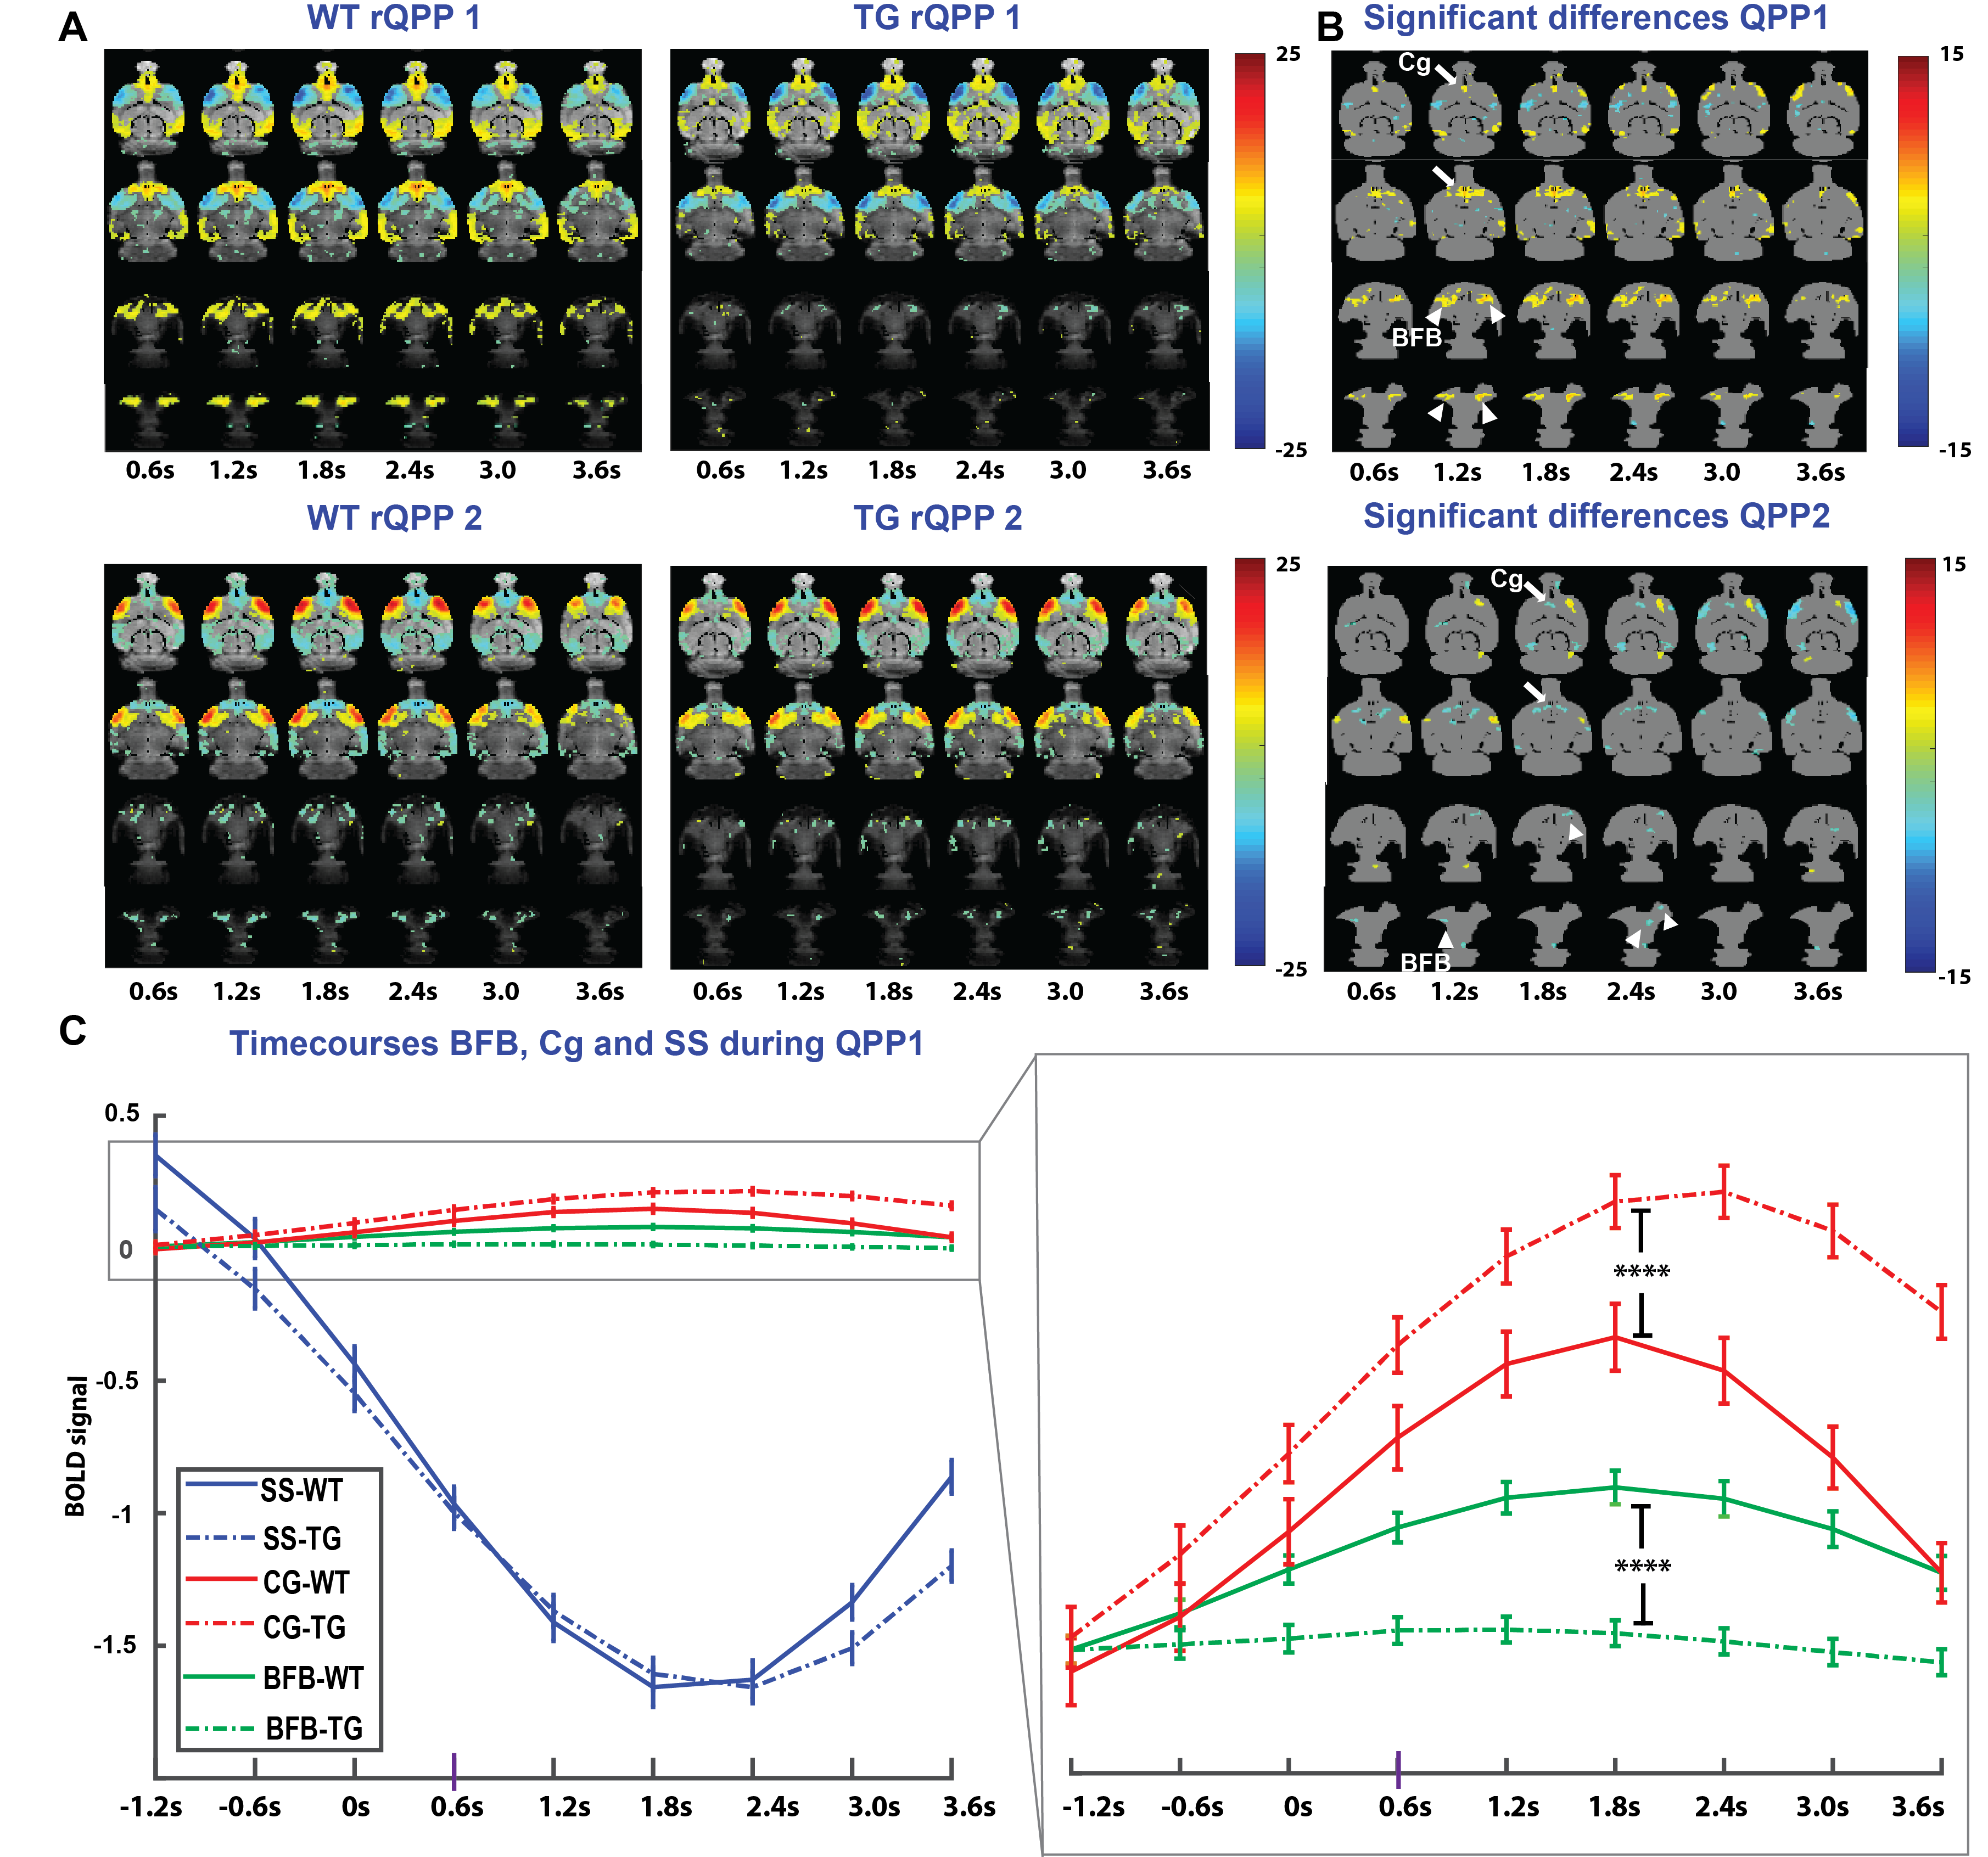
QPP analysis results in two clusters of QPPs per group which involve two anti-correlated RS networks, namely the lateral cortical network and default mode network (Fig 1A). Significant QPP differences between groups were primarily found in the basal forebrain (BFB) (arrowheads), and cingulate cortex (Cg) (arrows) (Fig 1B). QPP time-course analysis in these regions-of-interest and somatosensory cortex (SS), demonstrated a concomitant reduction of BFB and an increase of Cg activity in the Tg-rats compared to the WT controls, while SS activity profiles remained unchanged (Fig 1C). Clusterwise-occurrence rates were significantly lower for both clusters in TgF344-AD animals (p= 0.0427 & p= 0.0449).Discussion
We observed spatial and temporal alterations in QPPs, mainly in the BFB and Cg in 4-month old TgF344-AD rats. In wild-type littermates the BFB is co-activated with the Cg, while this co-activation is greatly reduced in the TgF344-AD rats. The BFB has been implicated as an important orchestrator of whole-brain network activity [5], and is one of the first regions affected by AD in humans[6]. Alterations in BFB activity might contribute to differences in whole-brain spatiotemporal properties of QPPs, as well as the decreased occurrence rates of whole-brain network activity, as is observed in this study. Further histological analysis will be performed to correlate the changes observed in QPPs to AD-pathology and to gain more insight into the disease-mechanisms driving the changes in QPPs.Conclusion
In summary, our results highlight the important role of the BFB in regulating whole-brain networks. Spatiotemporal changes in QPPs together with altered BFB activity could be a potential signature to identify early onset changes at the network level.Acknowledgements
Research was funded by Stichting Alzheimer Onderzoek (SAO-FRA 20180003) and Flemmish government (FWO - G045420N).References
1. Zhang, H.Y., et al., Detection of PCC functional connectivity characteristics in resting-state fMRI in mild Alzheimer's disease. Behav Brain Res, 2009. 197(1): p. 103-8.
2. Liu, Y., et al., Regional homogeneity, functional connectivity and imaging markers of Alzheimer's disease: a review of resting-state fMRI studies. Neuropsychologia, 2008. 46(6): p. 1648-56.
3. Shah, D., et al., Early pathologic amyloid induces hypersynchrony of BOLD resting-state networks in transgenic mice and provides an early therapeutic window before amyloid plaque deposition. Alzheimers Dement, 2016. 12(9): p. 964-976.
4. Shah, D., et al., Resting state FMRI reveals diminished functional connectivity in a mouse model of amyloidosis. PLoS One, 2013. 8(12): p. e84241.
5. Nair, J., et al., Basal forebrain contributes to default mode network regulation. Proc Natl Acad Sci U S A, 2018. 115(6): p. 1352-1357.
6. Hall, A.M., et al., Basal forebrain atrophy is a presymptomatic marker for Alzheimer's disease. Alzheimers Dement, 2008. 4(4): p. 271-9.
Figures