2938
Resting-state co-activation patterns (CAPs) accurately predict pre- and manifest- stage Huntington’s disease in mice.1Biomedical Sciences, University of Antwerp, Antwerp, Belgium, 2CHDI Foundation, Princeton, NJ, United States
Synopsis
Magnetic Resonance Imaging (MRI) biomarkers hold great potential to become key in understanding Huntington’s Disease (HD) pathophysiology as well as disease progression. We investigated longitudinal changes in spatiotemporal properties of transient brain-wide co-activation patterns (CAPs) during the brain’s resting-state (RS) in a mouse model of HD. We found early differences in the temporal components of two biologically prominent CAPs in the diseased mice and showed, using supervised learning, that spatial features of CAPs accurately distinguish the diseased animals from healthy. Our findings show the promise of RS-CAPs in the development of MRI-based biomarkers of HD.
Introduction
Huntington’s disease (HD) is a neurodegenerative disorder caused by expanded (>40) glutamine-encoding CAG repeats in the huntingtin gene, which leads to dysfunction and death of predominantly striatal and cortical neurons1. While the genetic profile and behavioral symptoms of the disease are better known, changes in the functional architecture of the brain, especially before the behavioral symptoms become apparent, are not fully understood. In this longitudinal investigation, we sought markers at pre, early and advanced phenotypic expression stages in the Q175 heterozygous (HET) mouse model, which resembles molecular, cellular, and circuitry alterations of the human disease2, using RS-fMRI.Methods
Data were acquired from 37 (18 wild-types (WT) and 19 HET) male mice at three, six, and ten months of age with a 9.4T Bruker Biospec MRI scanner, using a cryo-coil head under isoflurane (2% for induction; then 0.5%) and medetomidine (0.075mg/kg s.c. bolus; 0.15 mg/kg/h s.c. infusion) anesthesia. Data (T2*w single-shot EPI, TR/TE 500/15ms, 1200 repetitions, voxel size 300x300x400 µm) were pre-processed and co-registered to a subject-based 3D RARE image (TR/TE 2000/42 ms, voxel size 78 x 156 x 312 µm) and normalized to a study-based 3D template. The global signal was regressed out after smoothing, band-pass (0.01 – 0.2 Hz) filtering. We then assessed temporal fluctuations of neural activity in terms of instantaneous blood-oxygen-level-dependent (BOLD) co-activation patterns (CAPs), considered to be constituents of resting-state networks (RSNs). Images from all 37 animals at each age were concatenated to form a combined image-series and all time frames were partitioned into a range of 2 to 20 clusters using K-means++ clustering3. CAPs were obtained by voxel-wise averaging of BOLD signals across time frames belonging to identical clusters. Spatial features of CAPs were characterized by voxels showing statistically significant activations identified by one-sample T-tests (p < 0.01 Bonferroni corrected for multiple comparisons). Medians, across subjects, of duration and occurrence rates of every CAP within a partition were compared with a two-sample Wilcoxon rank-sum test between the WT and the HET group at each age (FDR corrected for the number of CAPs within each partition). We then trained a multinomial logistic regression (MLR) classifier using spatial and temporal features of CAPs from 80% of randomly chosen subjects and tested it on the remaining 20%. This was repeated for 100 different train-test splits and the resulting classification accuracy was compared with a chance-level distribution obtained by 100 trials of random shuffles of class labels. In order to prevent information leakage from the test-set features to the classifier, only training-set subjects’ data were used to extract the combined CAPs that were then projected on the individual image-series to extract CAP features at the subject-level.Results
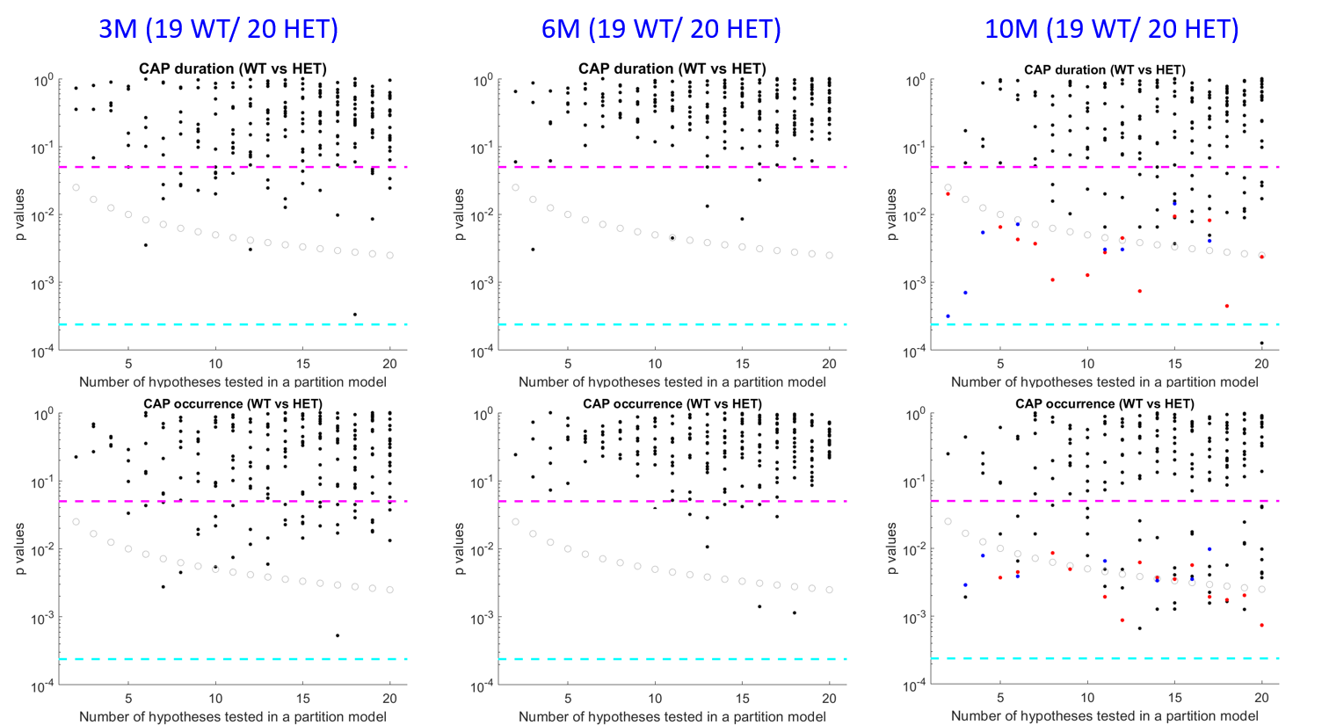
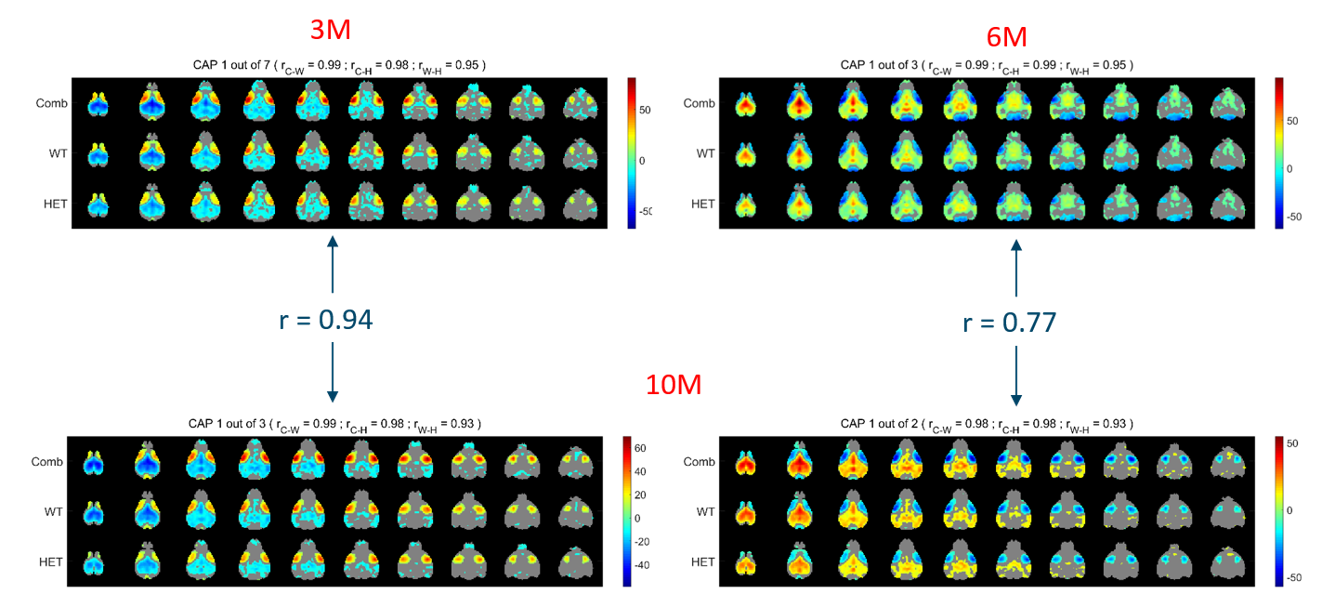
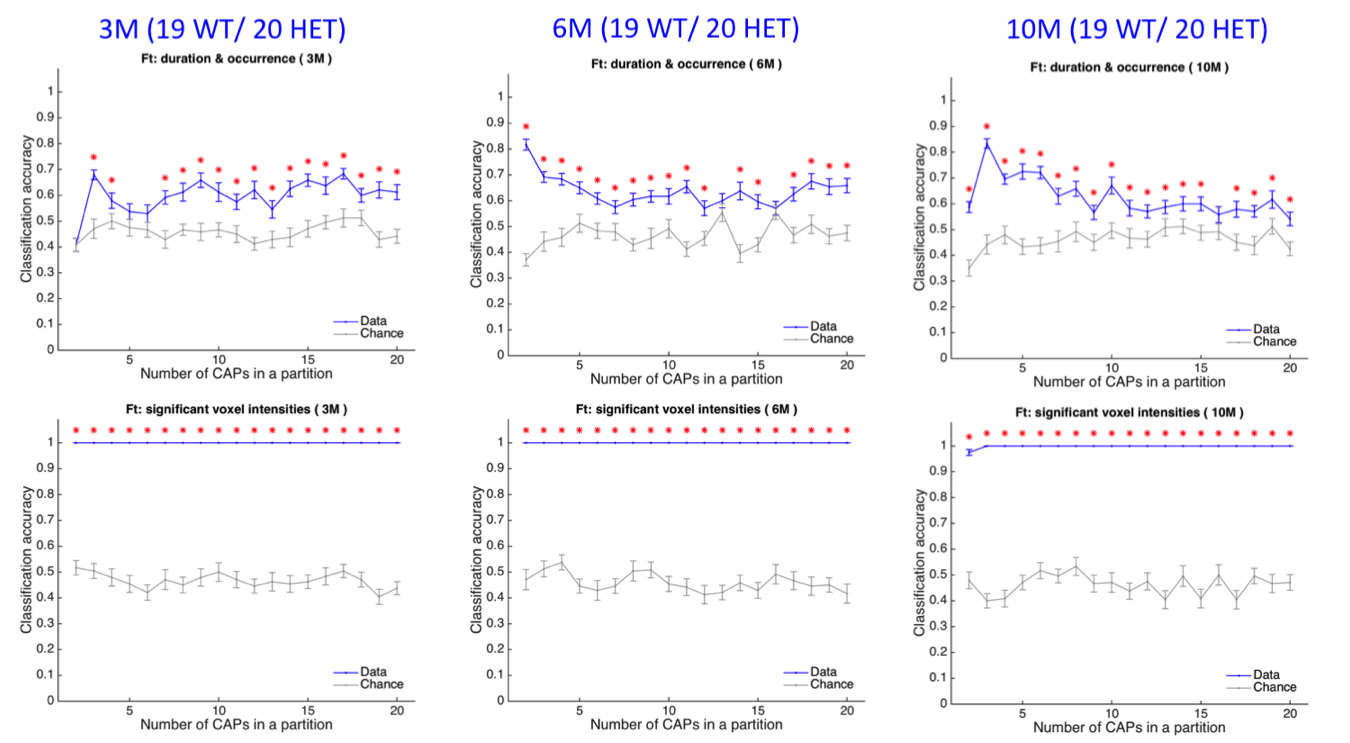
Across different partitions, 6 CAPs at the 3-month time-point, 4 CAPs at the 6-month time-point, and 55 CAPs at the 10-month time-point showed a significant inter-group difference in either the duration or the occurrence rate (Fig 1). The spatial similarity between these CAPs revealed two prototype patterns that consistently showed significantly reduced duration and/or occurrence rates in the HET group (p < 0.05). The first pattern showed simultaneous co-deactivations of the Default Mode (DM)-like network (composed of cingulate, latero-orbital, entorhinal, frontal association cortices, and dorsal hippocampus), and co-activation of the latero-cortical network (consisting of somatosensory, insular, and motor cortices) in mice (left panels, Fig 2). The second pattern, whose temporal properties were reduced in HET only at 6 and 10-month time-points, was anti-correlated to the first pattern (right panels, Fig 2). HET animals were distinguished from WT using the temporal components of CAPs (duration and occurrence rate) with greater accuracy compared to the chance-level for most partitions at each age (top panels, Fig 3). However, it was their spatial features (BOLD signals of voxels showing significant activations for each CAP) that predicted the subject identity with near perfection for all partitions (bottom panels, Fig 3).Disucussion
We identified two biologically robust transient brain states during the resting-state, that represent the constituents of commonly observed resting-state networks, and observed a significant reduction of their temporal properties in a mouse model of HD. These changes occurred before the appearance of behavioral alterations (the first motor deficits are observed at 6 months of age in this mouse model4) and become robust at the manifest stage of the disease. Therefore, RS-CAPs could prove to be promising early markers of the disease. We, therefore, tested their predictive ability to correctly classify WT and HET animals. While the temporal features of CAPs performed better than the chance-level, it was the spatial features of CAPs that distinguished WT animals from HET with near perfection at all three time-points.Conclusion
Our findings suggest that RS-CAPs are promising candidates in the development of RS-fMRI based biomarker of HD. Their ability to predict disease severity in terms of behavioral symptoms in patients, and to assess treatment efficacy would have to be further investigated in future preclinical and clinical studies to implement their use in the clinical setting.Acknowledgements
No acknowledgement found.References
1. Bates, G. P. et al. Huntington disease. Nat Rev Dis Primers 1, 1–21 (2015).
2. Menalled, L. B. et al. Comprehensive Behavioral and Molecular Characterization of a New Knock-In Mouse Model of Huntington’s Disease: zQ175. PLOS ONE 7, e49838 (2012).
3. Gutierrez-Barragan, D., Basson, M. A., Panzeri, S. & Gozzi, A. Infraslow State Fluctuations Govern Spontaneous fMRI Network Dynamics. Current Biology 29, 2295-2306.e5 (2019).
4. Data provided by CHDI Foundation; performed by/at Charles River Laboratories, Finland.
Figures