2937
Suppression of the default mode network in mouse affects memory consolidation
Zengmin Li1, Dilsher Athwal1, and Kai-Hsiang Chuang1,2
1Queensland Brain Institute, The University of Queensland, St Lucia, Australia, 2Centre for Advance Imaging, The University of Queensland, Brisbane, Australia
1Queensland Brain Institute, The University of Queensland, St Lucia, Australia, 2Centre for Advance Imaging, The University of Queensland, Brisbane, Australia
Synopsis
- 1. To understand the role of default mode network in memory consolidation, we target the retrosplenial cortex, area 30 (A30) by inhibition after mice learned a spatial memory task.
- 2. Using DREADDs to inhibit A30 during fMRI, significant decrease of functional connectivity from this area was detected.
- 3. Behavior–connectivity correlation analysis reveals connectivity reduction is correlated with behavior performance in the probe test.
- 4. Our results support a potential role of A30 in memory consolidation
Introduction
Since the first discovery of the human default mode network (DMN), this large-scale brain network has attracted widespread attention and has been suggested to play an important role in brain organization and support a variety of cognitive functions like learning and memory, envisioning the future, making social inferences and et al1-3. This network has been demonstrated to be conserved in evolution and has been detected in other lab animals like rodents and primates1,4,5. Increasing studies have suggested that the DMN is involved in learning and memory6-8, however, how does the DMN affect memory consolidation remains poorly understood. To address this question, we examined how inhibition of retrosplenial cortex (an important node of DMN) during memory consolidation can affect behavior performance in a spatial memory task, active place avoidance (APA), where animals need to learn to avoid a shock zone based on spatial cues.Methods
The study was approved by the animal ethic committee of the University of Queensland. Adult C57BL6/J mice at age of 14-16 weeks were conducted a virus injection surgery post under isoflurane anesthesia. Injection area were located at retrosplenial cortex, area 30 according to Paxinos and Franklin’s mouse brain atlas. Inhibitory DREADDs virus (pSyn-hM4D(Gi)-T2A-mScarlet) was constructed by Pankaj Sah Lab from the University of Queensland, Australia. There was a 4 weeks period for recovery and virus expression.fMRI scan: Animals went through one session of fMRI scan after recovery. MRI was conducted on Bruker 9.4 T system with mice sedated with 0.1 mg/kg/h continuous infusion of medetomidine and 0.5-0.25% isoflurane. The resting-state fMRI was acquired using multiband EPI11 with TR/TE = 300/15 ms, thickness = 0.5 mm, gap = 0.1 mm, 16 axial slices covering the whole cerebrum with in-plane resolution of 0.3 × 0.3 mm2. 2000 volumes were acquired in a 10 min session. First, a baseline resting fMRI was acquired. After the baseline scan, 1mg/kg CNO was injected via IP to inhibit neural activation in the target area. After 40min, another resting scan was acquired to measure brain networks under DREADDs inhibition. Raw data were first pre-processed to reduce motion, noise and nuisance and then registered to AMBMC mouse brain atlas. Seed-based correlation analysis was used to measure functional connectivity across the DMN for construction of correlation matrix. Paired Two-sample t-test was used to analyze the difference of connectivity maps before and after CNO injection.
Behavior task: About one week after MRI scan, an APA training was conducted. In the training, animals received 5 sessions of training within one day (10min per session, inter-session interval=1h). Right after the training, 1mg/kg CNO was injected via IP injection and 1mg/kg/day CNO was applied through drinking water for 1 week. After 1 week of memory consolidation, CNO water was changed back to normal water and another session of APA task (probe test) was performed the next day to test the memory retention. After collecting behavior indices, we did correlation analysis between correlation matrix and behavior indices. (Fig. 1)
Results
Fig.2. shows the two-sample t-test results between functional correlation maps before and after CNO injection. The two images show the correlation map when the seed was located at the retrosplenial cortex, area 30 rostral or caudal, separately. Inhibition of A30 can affect lots of functional connections from this target area to other brain areas, like the anterior cingulate cortex, caudate putamen, somatosensory cortex, dorsal hippocampus, retrosplenial cortex, temporal association cortex et al.After we got correlation matrix across DMN and behavior indices, we also did a correlation analysis between them. (Fig.1) For example, we found a significant correlation between the number of shocks in the probe test and the connectivity change of A30_left - A30_right, in which we injected DREADDs(Fig.3A). The higher the inhibition, the larger number of shocks in the probe test. Also, we found a significant correlation between time to the first entrance in the probe test and the connectivity change of secondary visual cortex medial_right - medial parietal association cortex_right(Fig.3B). The weaker the connection, the longer the time to the first entrance in the probe test.
Discussion
After injection of CNO during fMRI, a significant decrease of functional connections from the target area (retrosplenial cortex, area 30) was detected. Some areas were also overlapped with DMN, like the retrosplenial cortex, anterior cingulate cortex, and temporal association cortex, which suggest the A30 is an important node of DMN. The behavior-matrix correlation analysis also showed some aspects of how DMN involved in memory consolidation. For example, the number of shocks in the probe test is a mainly used index to indicate memory retention. We observed that this index significantly correlated with the changed functional connection between A30_left - A30_right which was measured in fMRI before APA training. This correlation suggested A30 may be involved in memory consolidation. Further studies are ongoing to determine how different DMN nodes are involved in memory consolidation and how it would affect behavior performance. The findings would provide a further understanding of the organization of DMN and the role in memory.Acknowledgements
No acknowledgement found.References
- Lu, H., Zou, Q., Gu, H., Raichle, M.E., Stein, E.A. and Yang, Y., 2012. Rat brains also have a default mode network. Proceedings of the National Academy of Sciences, 109(10), pp.3979-3984.
- Raichle, M.E. and Snyder, A.Z., 2007. A default mode of brain function: a brief history of an evolving idea. Neuroimage, 37(4), pp.1083-1090.
- Buckner, R.L., Andrews-Hanna, J.R. and Schacter, D.L., 2008. The brain's default network: anatomy, function, and relevance to disease.
- Vincent, J.L., Patel, G.H., Fox, M.D., Snyder, A.Z., Baker, J.T., Van Essen, D.C., Zempel, J.M., Snyder, L.H., Corbetta, M. and Raichle, M.E., 2007. Intrinsic functional architecture in the anaesthetized monkey brain. Nature, 447(7140), pp.83-86.
- Rilling, J.K., Barks, S.K., Parr, L.A., Preuss, T.M., Faber, T.L., Pagnoni, G., Bremner, J.D. and Votaw, J.R., 2007. A comparison of resting-state brain activity in humans and chimpanzees. Proceedings of the National Academy of Sciences, 104(43), pp.17146-17151.
- Powell, A., Connelly, W.M., Vasalauskaite, A., Nelson, A.J., Vann, S.D., Aggleton, J.P., Sengpiel, F. and Ranson, A., 2020. Stable encoding of visual cues in the mouse retrosplenial cortex. Cerebral Cortex, 30(8), pp.4424-4437.
- Czajkowski, R., Jayaprakash, B., Wiltgen, B., Rogerson, T., Guzman-Karlsson, M.C., Barth, A.L., Trachtenberg, J.T. and Silva, A.J., 2014. Encoding and storage of spatial information in the retrosplenial cortex. Proceedings of the National Academy of Sciences, 111(23), pp.8661-8666.
- de Sousa, A.F., Cowansage, K.K., Zutshi, I., Cardozo, L.M., Yoo, E.J., Leutgeb, S. and Mayford, M., 2019. Optogenetic reactivation of memory ensembles in the retrosplenial cortex induces systems consolidation. Proceedings of the National Academy of Sciences, 116(17), pp.8576-8581.
Figures
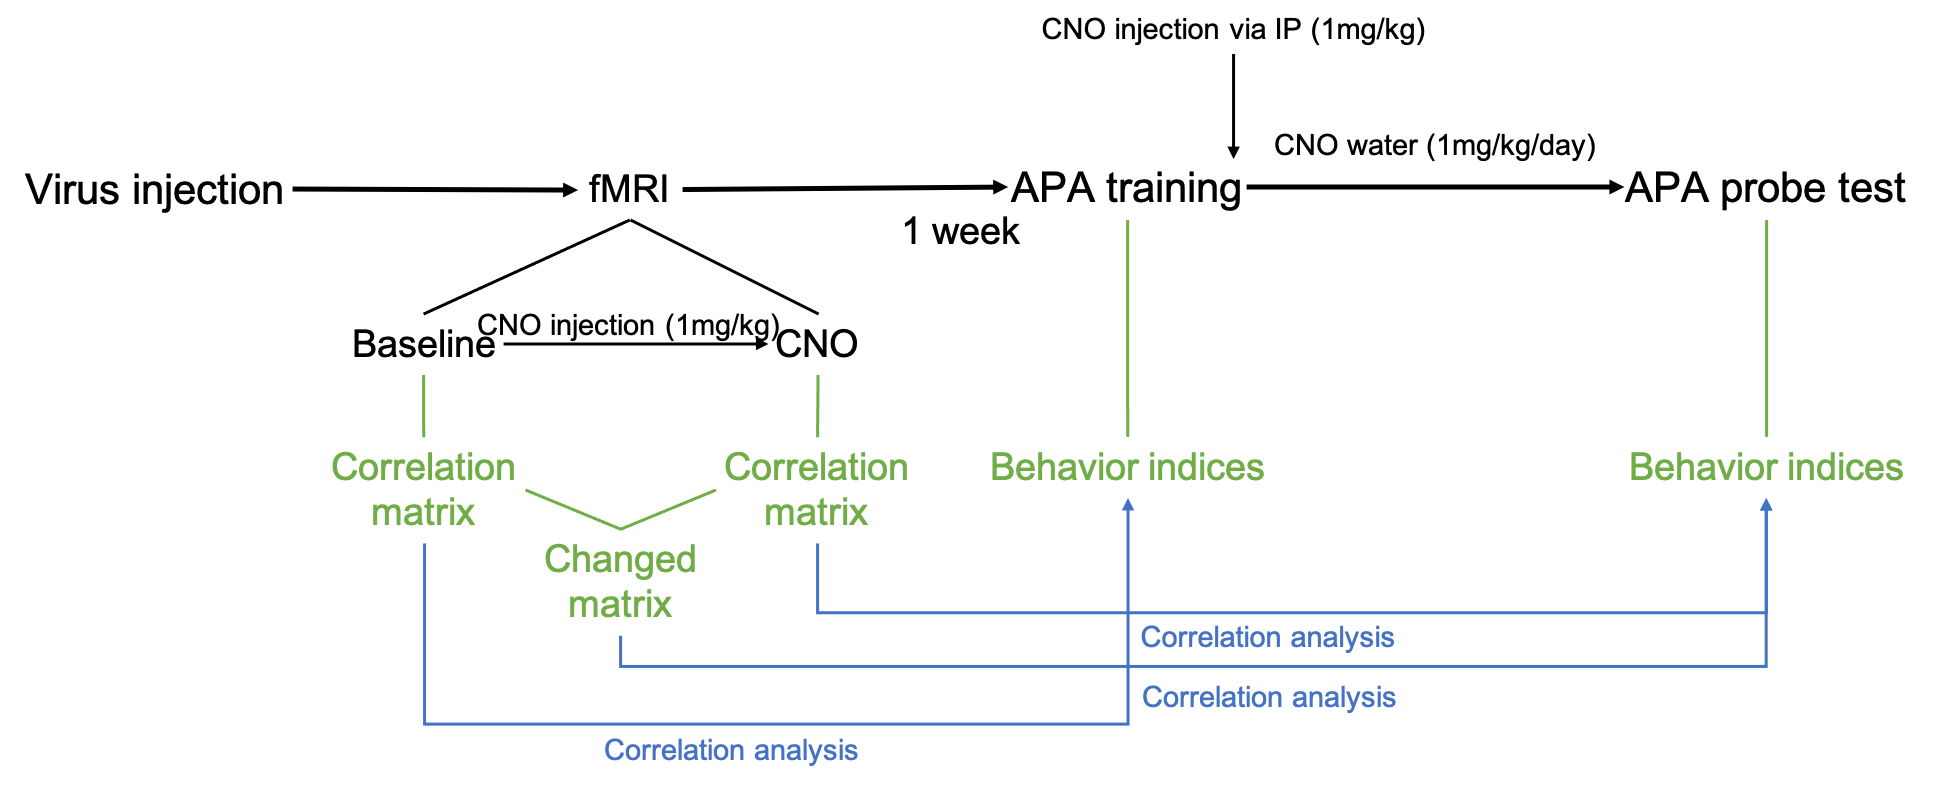
Fig.1 Experiment design
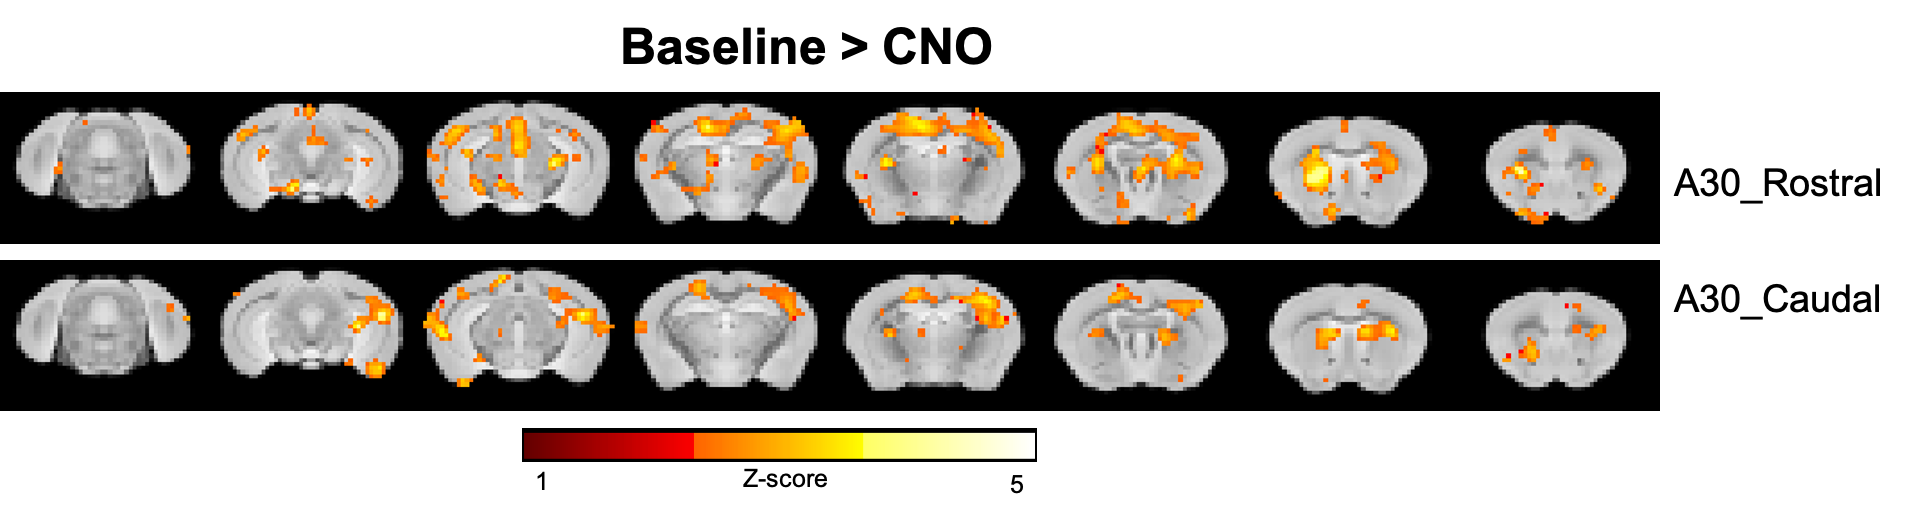
Fig.2 Group functional correlation maps. p<0.01, two-sample t-tests, uncorrected.
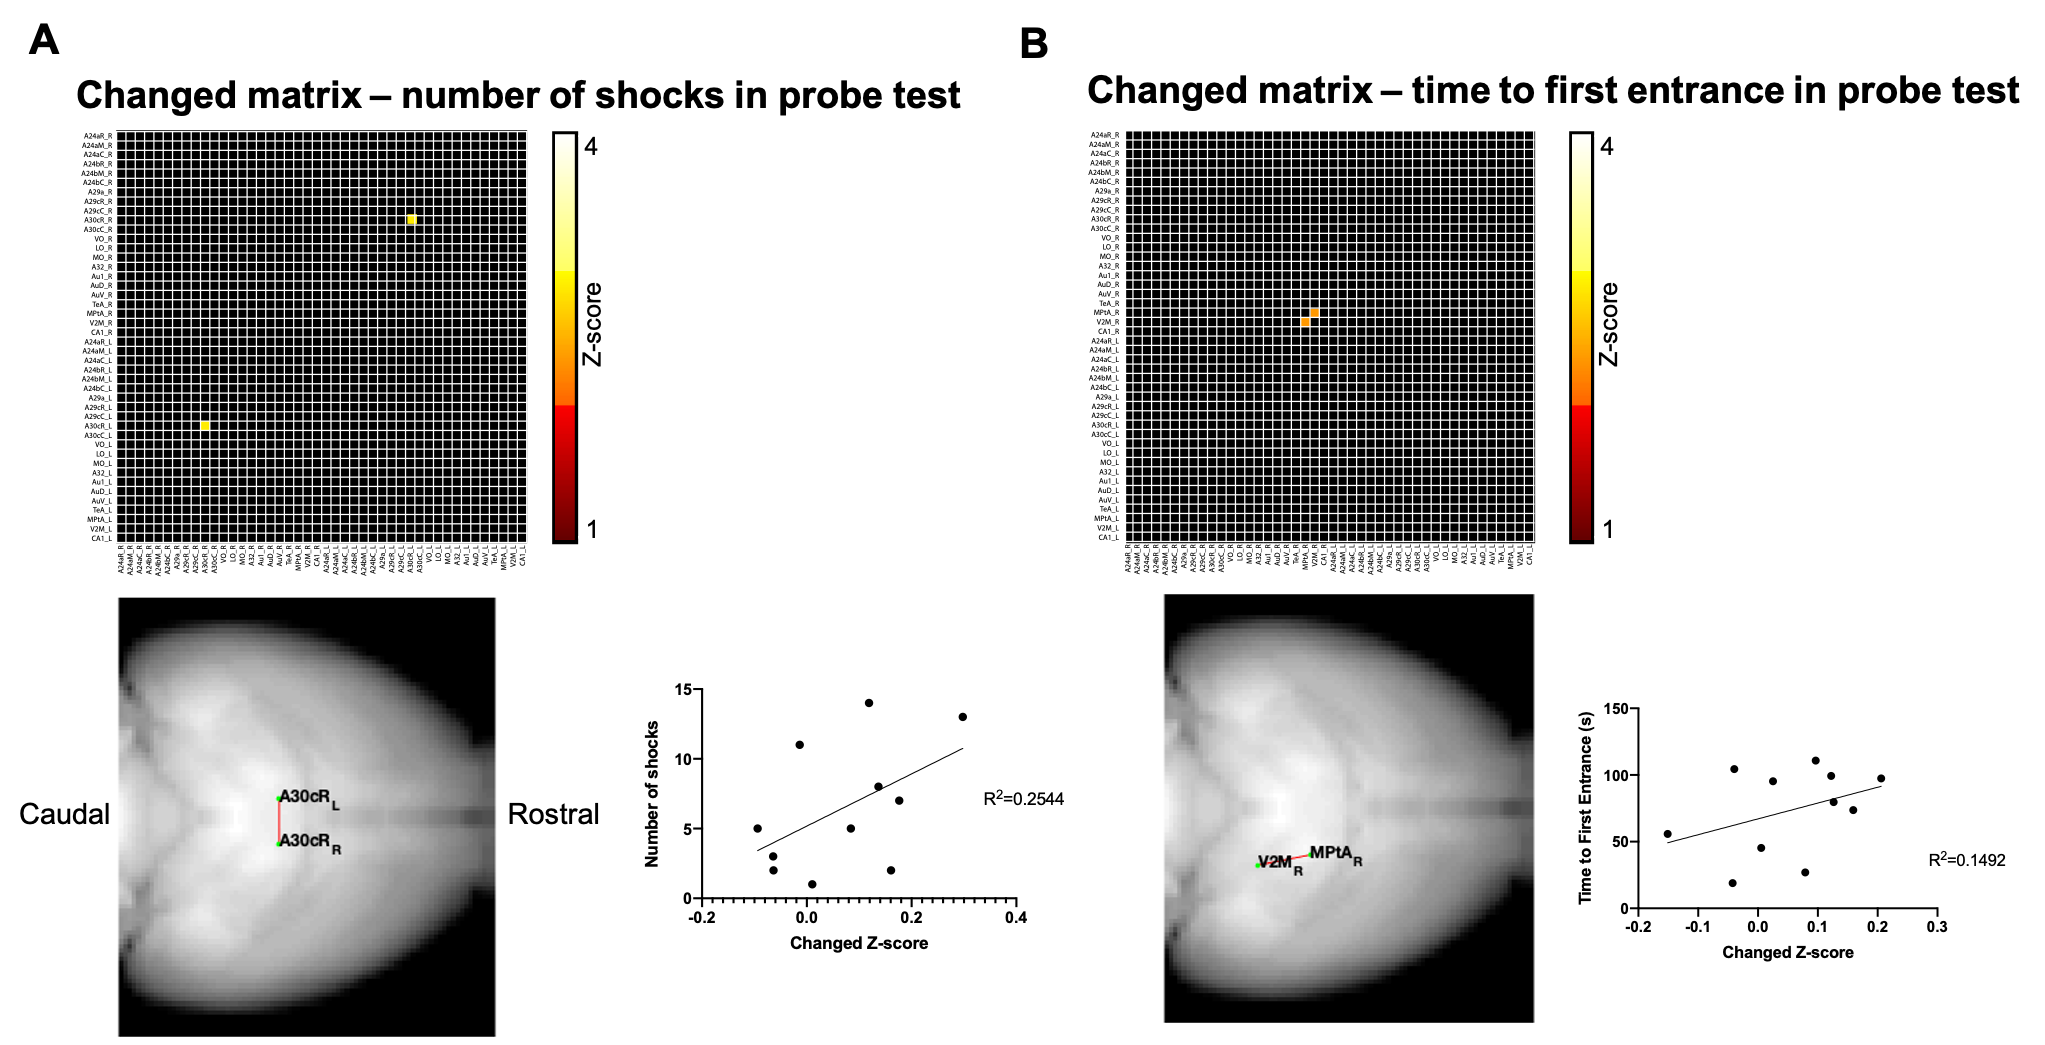
Fig.3 Two examples of the correlation between connectivity and behavior indices. (A,B) The upper matrix shows the functional connection which significantly correlated with either number of shocks or time to the first entrance in the probe test. p<0.01, uncorrected. The lower left shows the anatomical location of the connection. The lower right shows the scatter plot between connectivity change (Z-score) and behavior indices.