2936
Life-span development of brain functional connectivity in common marmosets1Department of Radiological Sciences, Human Health Sciences, Tokyo Metropolitan University, Tokyo, Japan, 2Live imaging Center, Central Institute for Experimental Animals, Kanagawa, Japan, 3Jikei University Graduate School of Medicine, Tokyo, Japan
Synopsis
Resting-state functional MRI enables to assess the psycho-neurological disease and developmental disability. The purpose of this study was finding the trend of functional connectivity life-span development in healthy common marmosets. We verified that the number of resting-state networks and its strength increased dramatically with age until common marmosets became adults (the age of 24 months) and declined steadily at older age after 24 months. The results demonstrated mostly the same data as human; therefore, it could apply as control models comparing with psycho-neurological disorder models in further research.
Introduction
The common marmosets (marmosets) are non-human primate and have some advantages to use this species: they are small size, which makes experiments easier, they grow rapidly (they become adults in 2 years) therefore it is suitable to a longitudinal experiment. Also, they are similar to humans in a variety of genomic, molecular, and neurobiological characteristics.1 Marmosets were genetically modified model for the first time in primates, and the development of genome editing technology allowed producing a variety of psycho-neurological disorder models. For investigations of the disease models, it was necessary to examine healthy model data as the first step. In this study, the development of brain functional connectivity (FC) was evaluated by resting-state functional MRI (rs-fMRI) in healthy marmosets.Methods
All MR imaging was performed on a 7.0 T Biospec 70/16 MRI scanner (Bruker BioSpin: Ettlingen, Germany) with Transmit coil; a conventional linear polarized birdcage resonator, inner diameter 72mm (Bruker BioSpin: Ettlingen, Germany) and Receiver coil; Bespoke 4 ch phased array coil (Takashima Seisakusho Co., Ltd.; Tokyo, Japan). A total of 62 healthy marmosets (age: 1-186 months, 268 times) were longitudinally observed. In this study, the developmental stages were categorized into 3, 6, 12, 18, 24 months, middle age (60-120 months), old age (120 months -). The T2 weighted imaging (T2WI) was collected with rapid acquisition with relaxation enhancement (RARE) sequence: effective TE = 48 ms, TR = 6500 ms, RARE factor = 8, number of averages = 3, FOV = 50 mm×50 mm, matrix = 256×256, slice thickness = 0.6 mm, number of slices = 54. The rs-fMRI was collected with gradient echo with echo planar imaging (GRE-EPI) sequence: TE = 17.5 ms, TR = 1500 ms, number of averages = 1, segment = 1, repetitions = 400, FOV = 51.2 mm×51.2 mm, matrix = 128×128, slice thickness = 1 mm, number of slices = 24. For the pre-processing of structural and functional data, antsRegistraionSyN2 was used for normalization with optimized registration parameters. CONN toolbox3 which is implemented in MATLAB was used to perform motion correction, artifact scrubbing, spatial smoothing and temporal band-pass filter (0.008 to 0.1 Hz). Region of interest (ROIs) of gray matter, white matter, and CSF were configured, and 51 brain regions4 was exported and calculated FC. Correlation matrixes were computed using in-house MATLAB code and FC network images were constructed by BrainNet Viewer5 in MATLAB.Results
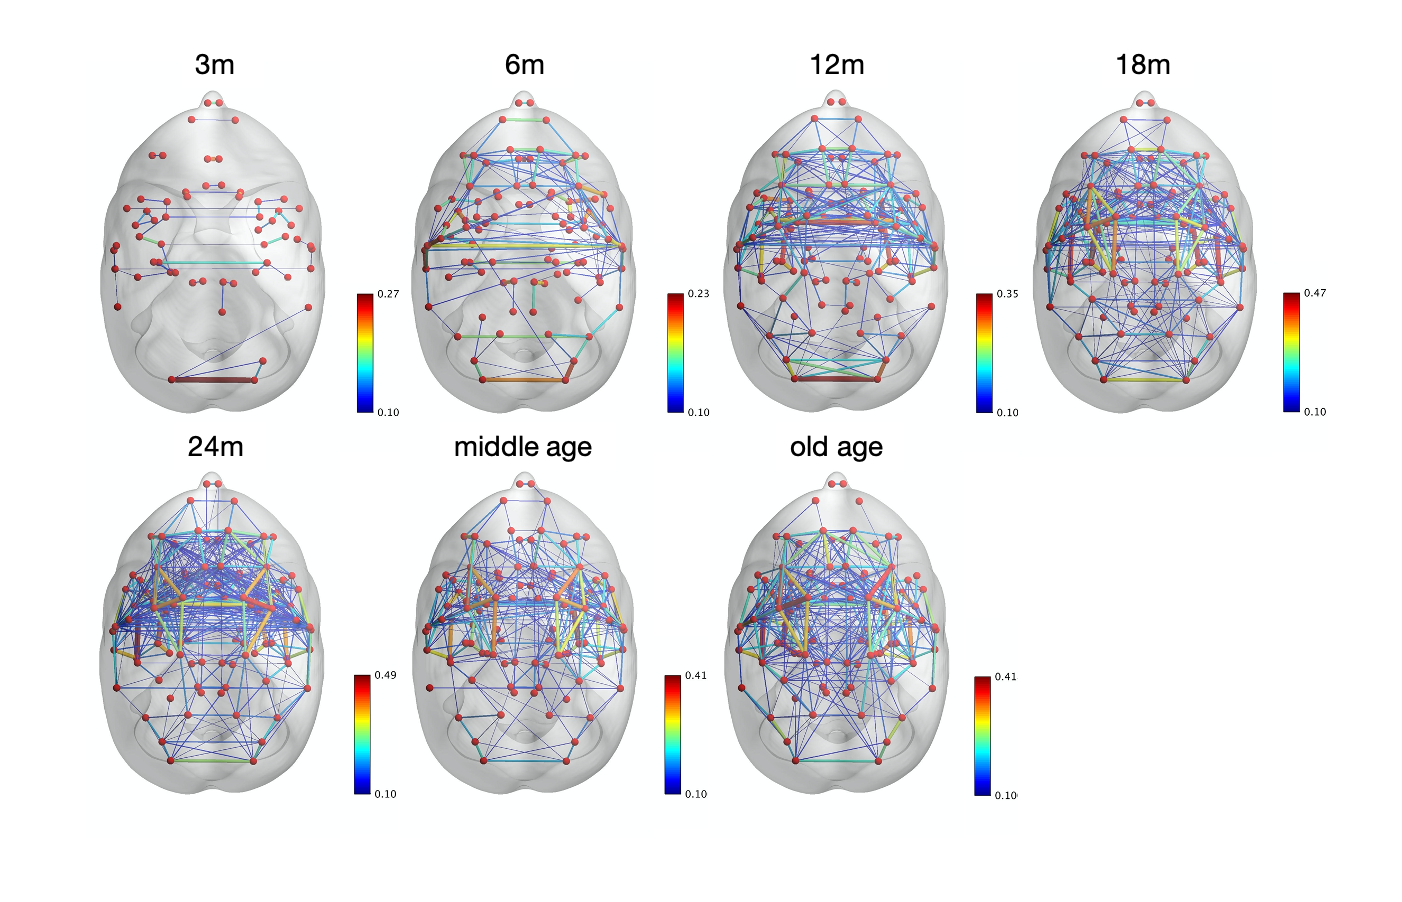
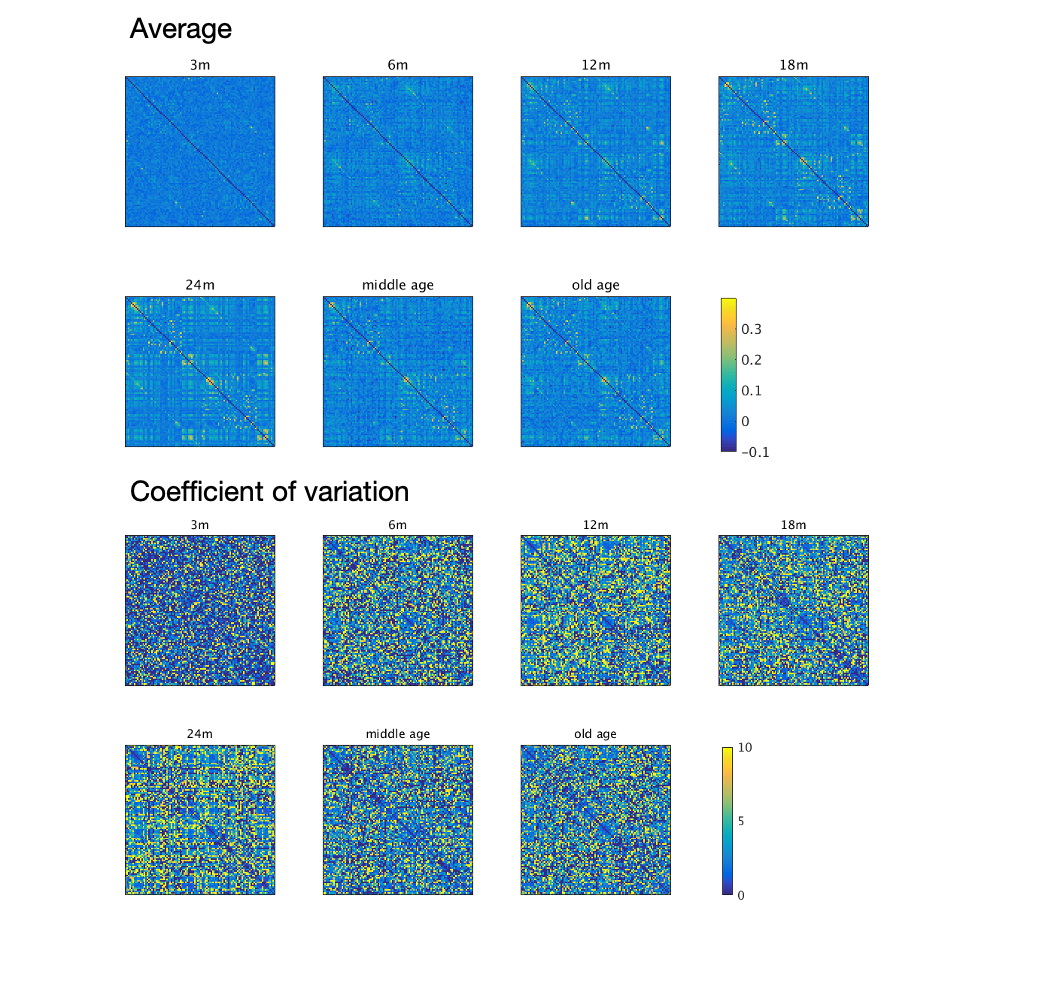
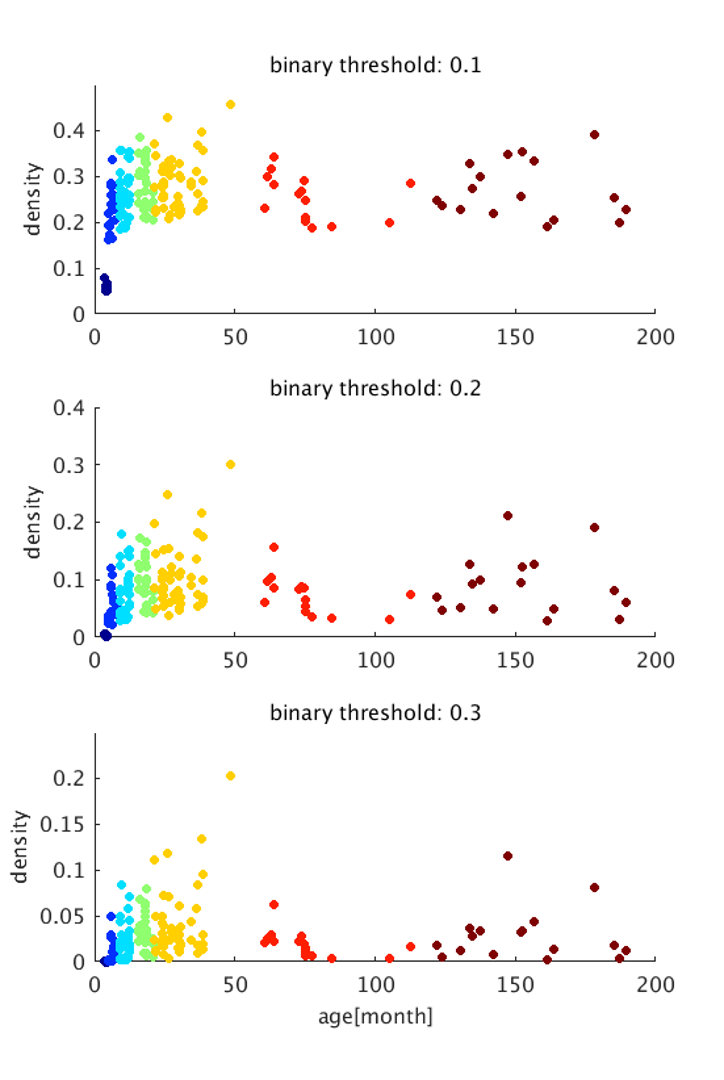
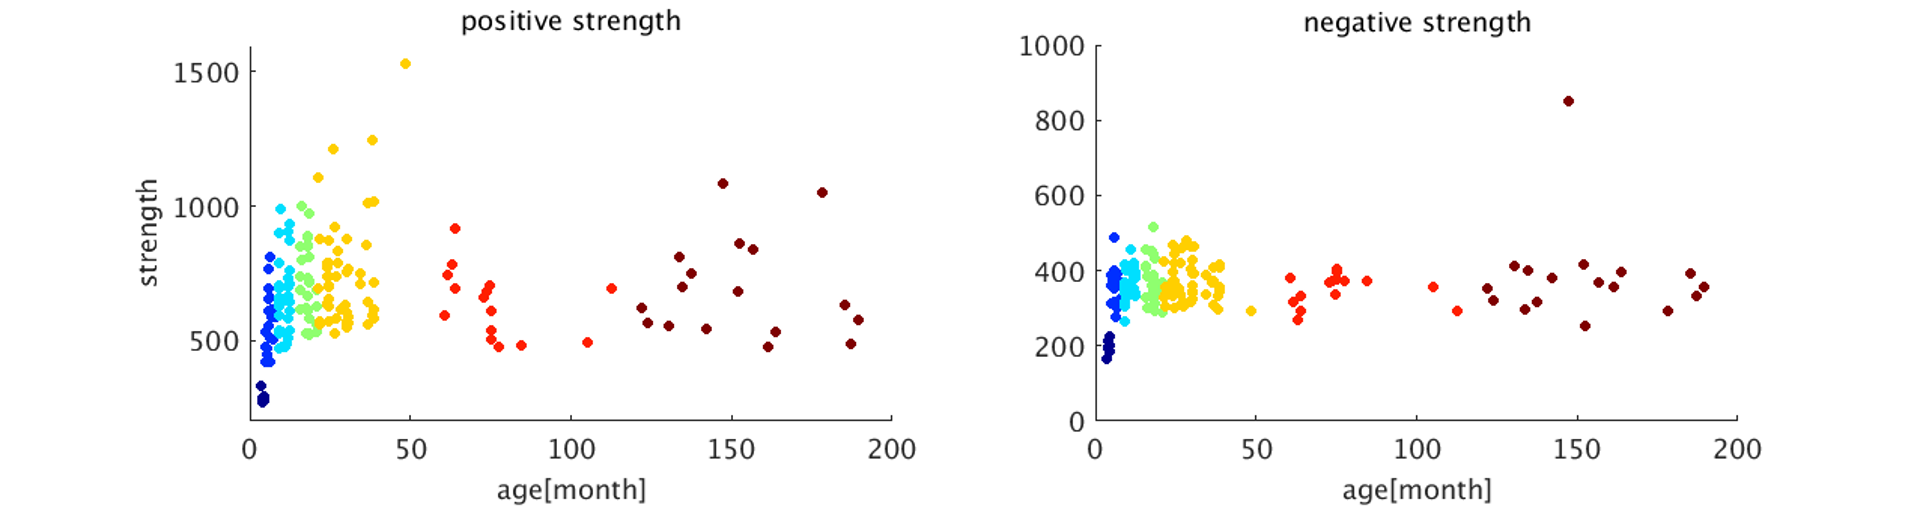
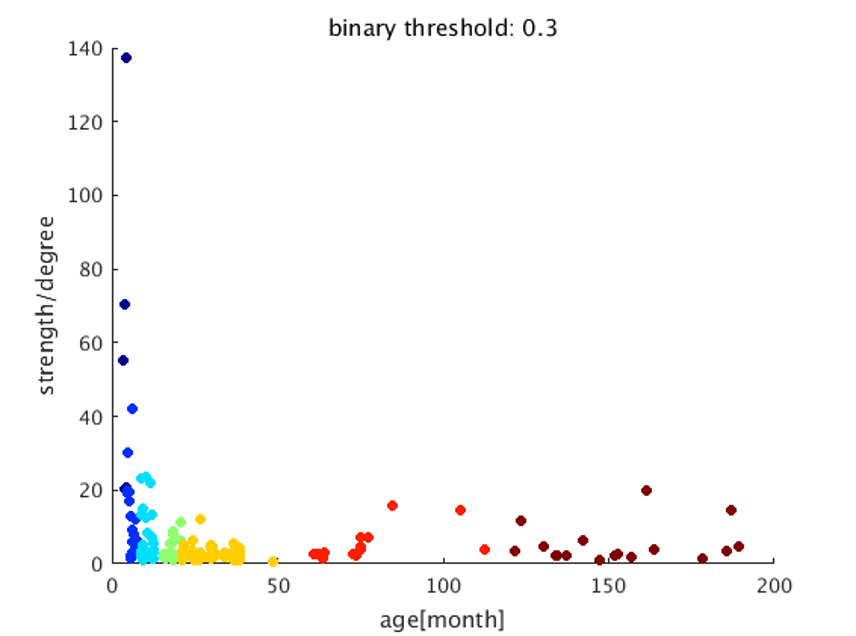
The image of functional networks and FC matrix (Figure 1, 2) showed the increase of network connectivity as the number of nodes and edges was getting larger over time. Especially, the age of 24 months at which marmosets become adults reached its peak. In addition, there was wide variation at older age. The development of FC was showed quantitatively by the distribution of edge density and strength (Figure 3, 4). From 3 months to 24 months, the amount of edge density and strength increased dramatically. When the binary threshold was set 0.3, the density at middle and old age had weaker connectivity than at age of 24 months. The number of edges was less at younger age. However, the edge weight (weight per edge) showed bigger value than adults (Figure 5).Discussion
The rs-fMRI was able to observe the process of brain network development by graph theoretical analysis. The prior study proved that adult marmosets act complicatedly with facial, limb and body gestures, specific body movements, and vocal and olfactory signals.6 It is assumed that the behavior has changed by the surrounding environment and it caused the wide variation of FC as marmosets grow (Figure 2; coefficient of variation FC matrix). A previous research of FC in humans has reported that at the age of 12 years, not only network size, but also FC strength were less amount in comparison with adults.7 Similarly, the edge density and strength at age of 12 and 18 months of marmosets which is the same developmental stage of human indicated the growth to some extent, but it was immature compared with adults (Figure 3, 4). In a previous study in humans, the tendency such as the decline of FC within brain networks and increase of FC between networks, were shown as matured.8 Correspondingly, we could confirm the average weight of an edge reached the largest value at the age of 3 months and decreased steeply with age in this study (Figure 5). However, it was uncertain whether connectivity of specific functional area such as visual and motor areas which have had from infants declined; therefore, it is necessary to investigate FC in detail.Conclusion
We successfully demonstrated the process of brain functional development in common marmosets by rs-fMRI visually and quantitatively. This research will be useful as control data for models of psycho-neurological disorders.Acknowledgements
This research is partially supported by the program for Brain Mapping by Integrated Neurotechnologies for Disease Studies (Brain/MINDS) from Japan Agency for Medical Research and development, AMED.References
1. Preuss, T. M. Critique of pure marmoset. Brain. Behav. Evol. 93, 92–107 (2019).
2. Avants, B. B. et al. A reproducible evaluation of ANTs similarity metric performance in brain image registration. Neuroimage 54, 2033–2044 (2011).
3. Whitfield-Gabrieli, S. & Nieto-Castanon, A. Conn: A Functional Connectivity Toolbox for Correlated and Anticorrelated Brain Networks. Brain Connect. 2, 125–141 (2012).
4. Seki, F. et al. Developmental trajectories of macroanatomical structures in common marmoset brain. Neuroscience 364, 143–156 (2017).
5. Xia, M., Wang, J. & He, Y. BrainNet Viewer: A Network Visualization Tool for Human Brain Connectomics. PLoS One 8, e68910 (2013).
6. Abbott, D. H., Barnett, D. K., Colman, R. J., Yamamoto, M. E. & Schultz-Darken, N. J. Aspects of common marmoset basic biology and life history important for biomedical research. Comp. Med. 53, 339–350 (2003).
7. Jolles, D. D., Van Buchem, M. A., Crone, E. A. & Rombouts, S. A. R. B. A comprehensive study of whole-brain functional connectivity in children and young adults. Cereb. Cortex 21, 385–391 (2011).
8. Betzel, R. F. et al. Changes in structural and functional connectivity among resting-state networks across the human lifespan. Neuroimage 102, 345–357 (2014).
Figures