2935
The brain activity of Rhesus monkeys in anesthesia
Yifan Miao1
1Institute of Biophysics, CAS., Beijing, China
1Institute of Biophysics, CAS., Beijing, China
Synopsis
In this study, we have observed a dose-dependent difference the brain activity and functional connectivity of Rhesus monkeys during propofol-induced anesthesia. The overall change of ALFF values was insignificant, but under lighter level there was an increase in the prefrontal and occipital lobes and in the frontal lobe inversely. The FC values across hemispheres were highly synchronized under deep anesthesia, and gradually decreased under lighter. The pattern of change in functional connectivity values showed a significant decrease followed by a small increase, which may have some reference significance to reveal the brain network formation mechanisms during resting state.
INTRODUCTION
The mechanism of resting state networks has not been clearly explained. And anesthesia could suppress brain activity, it may help us to study the effect of anesthetized on resting state, and explore the mechanisms of resting state. In this study, we focus on the effects of anesthesia on monkey’s brain activation and functional connectivity in different brain regions.METHODS
Fourteen rhesus macaques (Macaca mulatta, male, age close to 3.8y and weight close to 8kg) were included in this study, all approved by the Ethics Committee of the IBP,CAS, accordance with guidelines for experimental animals. Data were obtained from a 3T scanner(Siemens Trio Tim, Germany)in Beijing MRI Center for Brain Research. Monkeys were imaged using an house-made 4-channel head coil. The rs-fMRI were collected using EPI(29 slices, FoV 119×119mm², TR/TE=2000/29ms, flip angle=90°, voxel size=1.8×1.8×1.8mm³). Structural images were acquired by MPRAG(TR/TE=2200/3.68ms, flip angle=8°, voxel size=0.5×0.5×0.5mm³). An MR-compatible stereotaxic instrument was used to fix the monkey brain at the center of the coil and to ensure that head movements were minimized during the scan. Propofol was used to anesthetize monkeys, and adjusted flow rate from 100 ml/h to significant head movements were observed, by a decreasing gradient of 10 ml/h for each rs-fMRI session. Respiration, pulse and oxygen saturation were recorded throughout the experiment using pulse oximeter (SALL, http://www.i4sa.com) in two monkeys. All the rs-fMRI data were preprocessed using SPM8 (http://www.fil.ion.ucl.ac.uk/spm). The main steps include: 1. reorientation to AC-PC plane; 2. slice-timing; 3. motion correction; 4. co-registration to structural imaging; 5. image segmentation according to the inia19 atlas (http://nitrc.org/projects/inia19); 5. normalization of the functional and structural images according to the segmentation results 6. spatial smoothing; 7. detrend; 8. regress out global signal ;9. band-pass filtering (0.01Hz-0.08Hz). The ALFF value for each voxel was calculated by REST (http://www.restfmri.net/forum/v1.8). Functional connectivity(FC) value of whole brain regions was calculated: (1) parcellated into 26 brain regions according to the inia19 atlas, and extracted the time course; (2) ROI-ROI correlation matrix were calculated and converted to z values.RESULTS
The ALFF values at the deepest level of anesthesia minus the lightest one, the result tended to plateau overall (Figure 1). Only parts of the frontal and occipital lobes showed variability. The prefrontal and occipital cortices were more active in the lightest anesthesia, while the frontal cortex was relatively less active. T-tests of FC values between the deepest and lightest level of anesthesia showed significant changes at bilateral insulas, bilateral parietal lobes and many other brain areas (Figure 2(a), P < 0.05, and Table 1 for detail data). A one-way ANOVA was performed on 26 brain regions with gradients of anesthetic concentration as variables, showing significant changes in functional connectivity between the right insula and left corpus callosum, right cerebellum and left temporal visual, right occipital and right temporal auditory, and many other brain aeras (Figure 2(b), P < 0.05, and Table 2 for detail data). The brain regions that showed significant changes in the ANOVA can be classified into three patterns, A, B and C, based on the different trends (Figure 3). In pattern A, the FC values showed an overall decreasing trend, then reached its lowest value at the flow rate of 80 ml/h, after which it rebounded. In pattern B, the FC values showed a steady decline, dropping to negative values at 80 ml/h, followed by a small increase in negative correlation. In pattern C, the FC values were all negatively correlated, and the negative correlation was lowest at 80 ml/h, followed by an increasing trend. We also calculated mean of all FC values and the result was similar to group A, but flatter.DISCUSSION
The overall ALFF values of anesthetic brain was not significant, which may due to the inhibition by propofol1. Our results extend previous studies in the reverse direction, showing that propofol-induced inhibition affects most brain regions, except for parts of the frontal, prefrontal and occipital lobes. Under deeper anesthesia, the brain areas are highly synchronized; under lighter anesthesia, the brain areas start to work independently and may receive some external stimulus signals and make preliminary analytical responses. Results ranged from the deepest level of anesthesia to a flow rate of 80 ml/h showing an increasing independence and complexity of brain activity; and from the 80 ml/h flow rate to the lightest level may indicate a potential process of different brain networks formation.Acknowledgements
I would like to express my gratitude to my dearest Xu Xiaolinlu, and love you 3,000 times.References
1. Emery N. Brown, Ralph Lydic, and Nicholas D. Schiff, et al. General anesthesia, sleep, and coma. N Engl. J Med 2010; 363:2638-2650.Figures
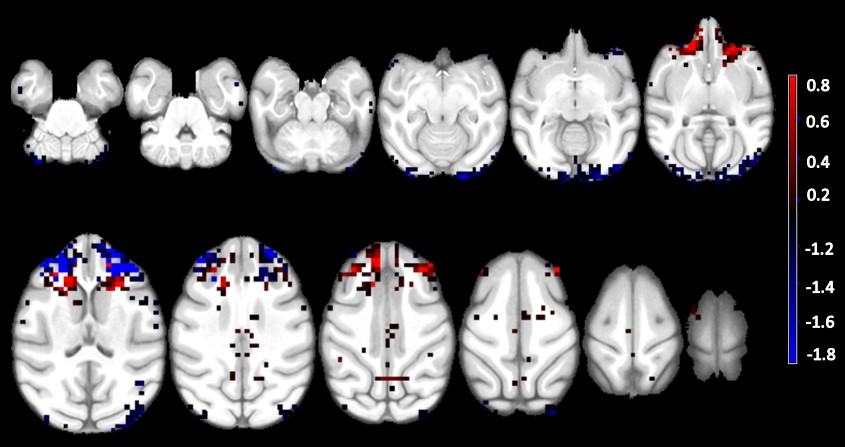
Figure 1 Differences
in ALFF values of brain activity in rhesus monkeys under propofol-induced
anesthesia in the deepest and lightest states of anesthesia
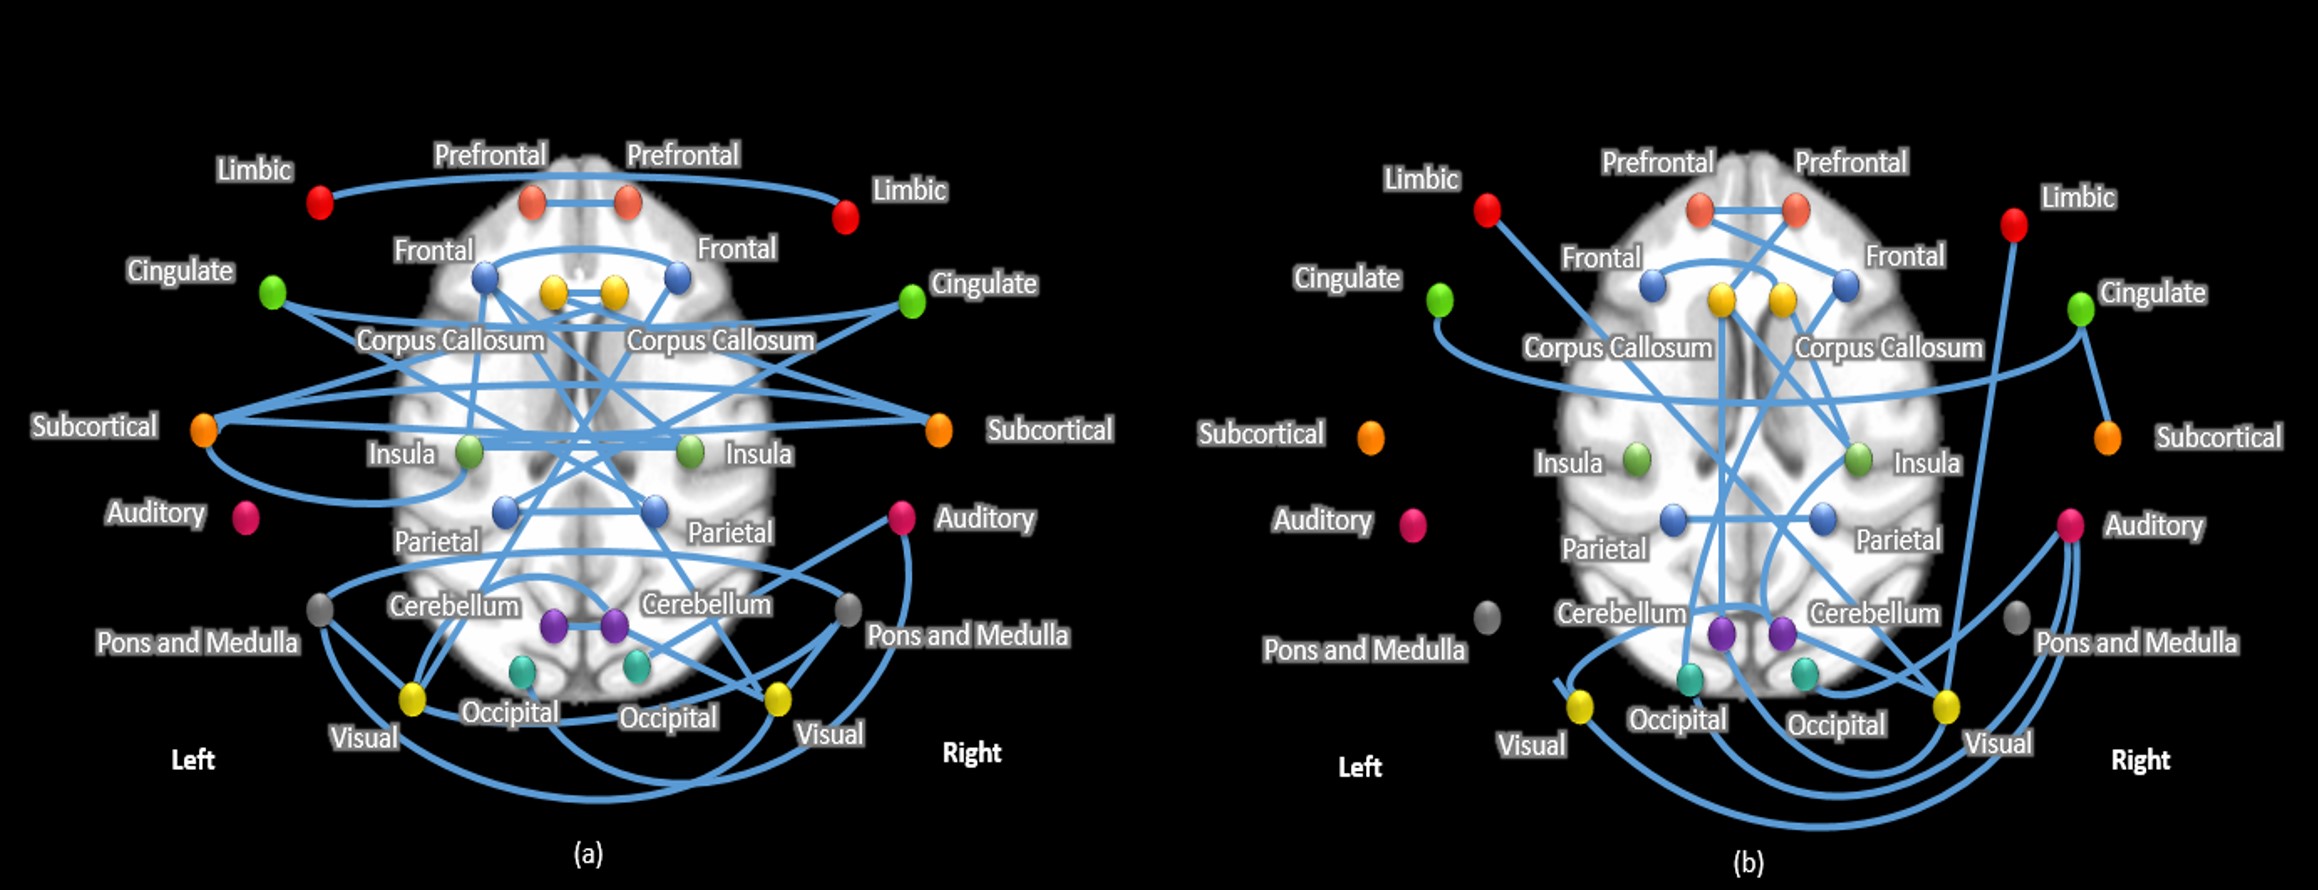
Figure 2 Brain
areas showing significant changes in FC values(p<0.05)
(a) Schematic diagram of brain areas showing significant changes
in the deepest and lightest level of anesthesia
(b)Schematic diagram of brain areas
showing significant changes in ANOVA at different levels of anesthesia
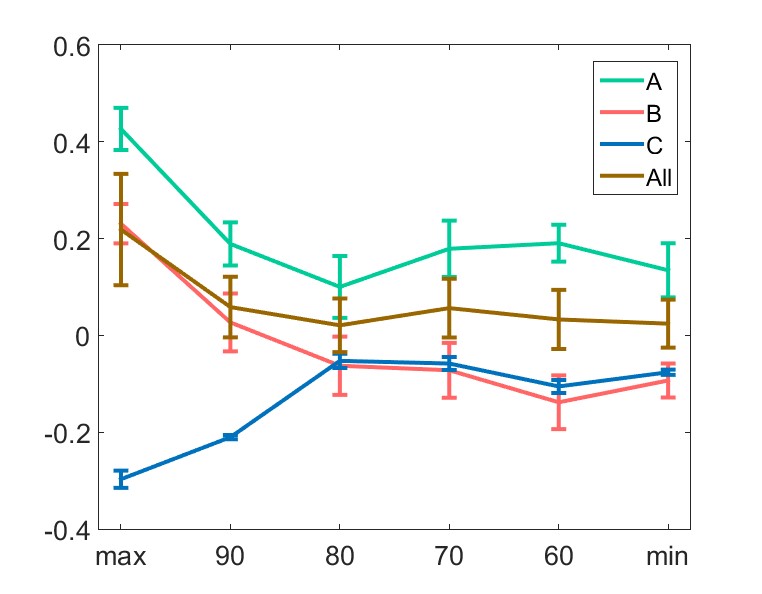
Figure
3 FC values that show different change patterns as
anesthesia decreases
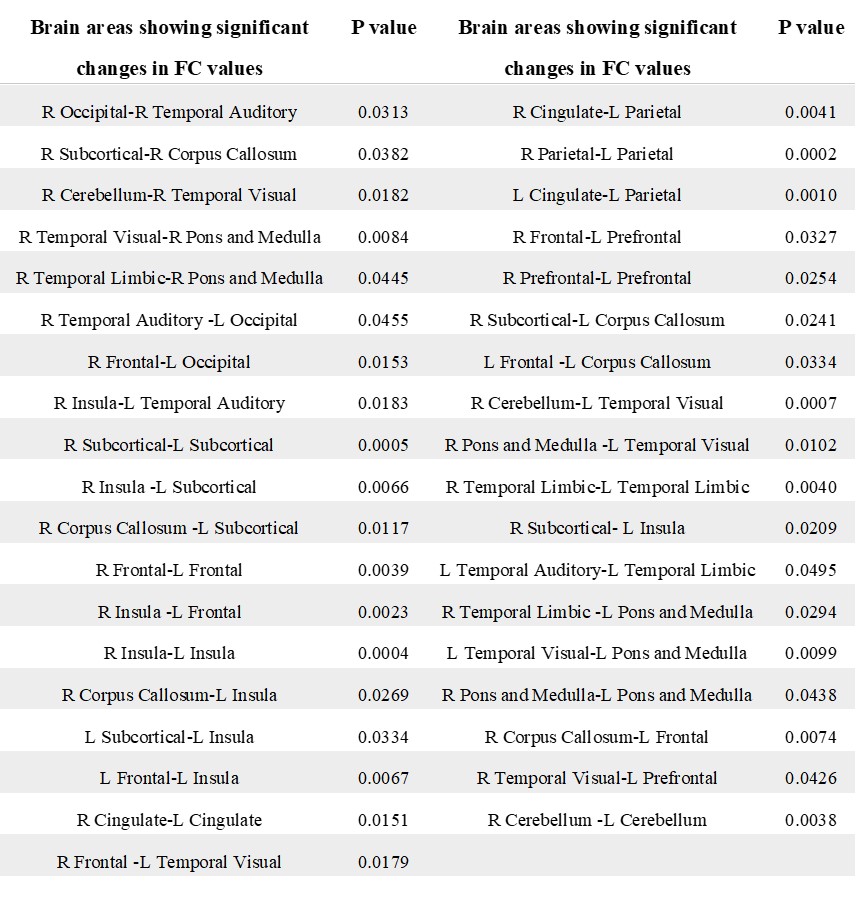
Table1 brain areas showing significant
changes in the deepest and lightest level of anesthesia
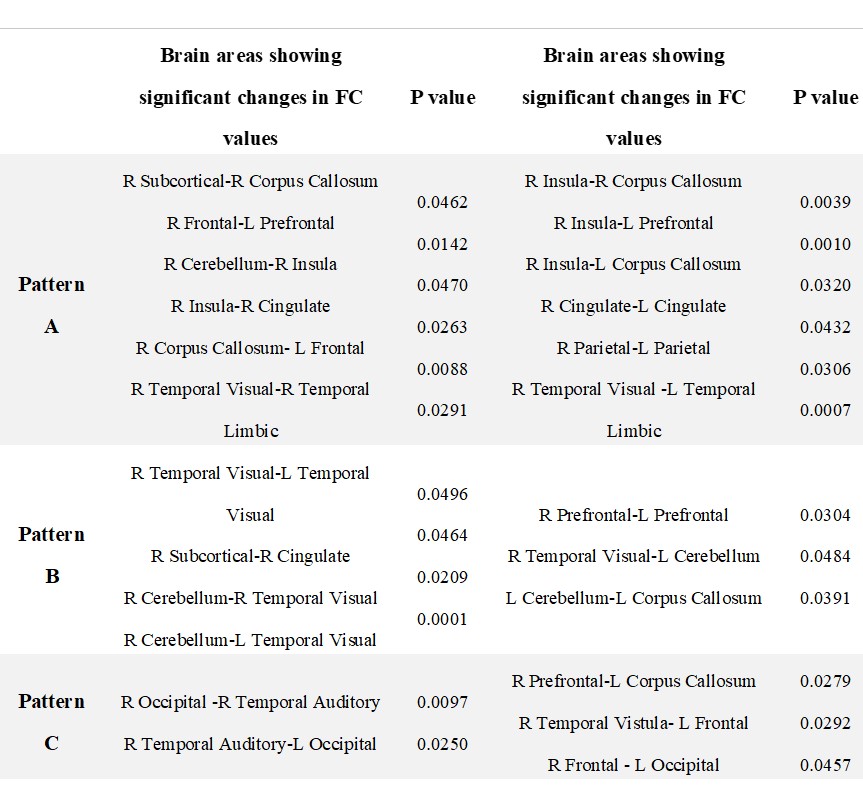
Table
2 brain
areas showing significant changes in ANOVA at different levels of anesthesia