2933
The Effect of Somatostatin+ Interneurons on the Negative BOLD Response.1Institute of Neuroinformatics University and ETH Zurich, Zurich, Switzerland
Synopsis
How the exact interaction between excitatory and inhibitory neurons shapes the fMRI BOLD response is currently not well understood. As such, this often hinders any precise conclusions about the causal involvement of a brain area during a specific task. Here we show a demonstration of stimulus-dependent excitatory and inhibitory processing that could explain previously reported observations in BOLD polarity (Niranjan et al., 2016). We show evidence that the activity of Somatostatin+ interneurons is related to a negative inflection in the BOLD signal even when there is a simultaneous increase in local excitatory activation.
Introduction
Functional Magnetic Resonance Imaging (fMRI) is one of the most powerful tools that allows us to measure neural activity non-invasively. Since its inception, the neural underpinnings of the Blood-Oxygen Level Dependent (BOLD) response have been studied intensively. However, there are still several unanswered questions that make the interpretation of the BOLD response difficult.Previous work has shown that an increase in the BOLD response could be interpreted as the vascular response to the functional involvement of neurons that exhibit task-related output in a certain area (1). In addition, it was later shown that a decrease in neural activity in an area was correlated with a decrease in neuronal spiking (2). However, this interpretation could be affected by other characteristics of neural activity such as feedforward/feedback processing, massive recurrent signaling, and the organization of the brain in local excitatory-inhibitory (EI) networks (3). Especially the fact that the brain is organized in EI networks could influence the interpretation of fMRI significantly. For example, EI networks can increase the metabolic need by increasing the local synaptic activity through feed-forward inhibition, while simultaneously decreasing the task-related excitatory spiking output (4). These situations pose a challenge to the interpretation of fMRI and are strongly dependent on the cytoarchitectural and local microcircuit features of the involved area as well as the task characteristics (3).
To investigate how EI cortical processing shapes the BOLD response, we use a fiber-based calcium imaging approach to measure bulk activity of genetically predefined excitatory and inhibitory populations. Our preliminary results show that, similar to previously reported fMRI results, there exists a differentiating stimulus-dependent processing of inhibitory and excitatory neural substrates on the mesoscopic scale.
Methods
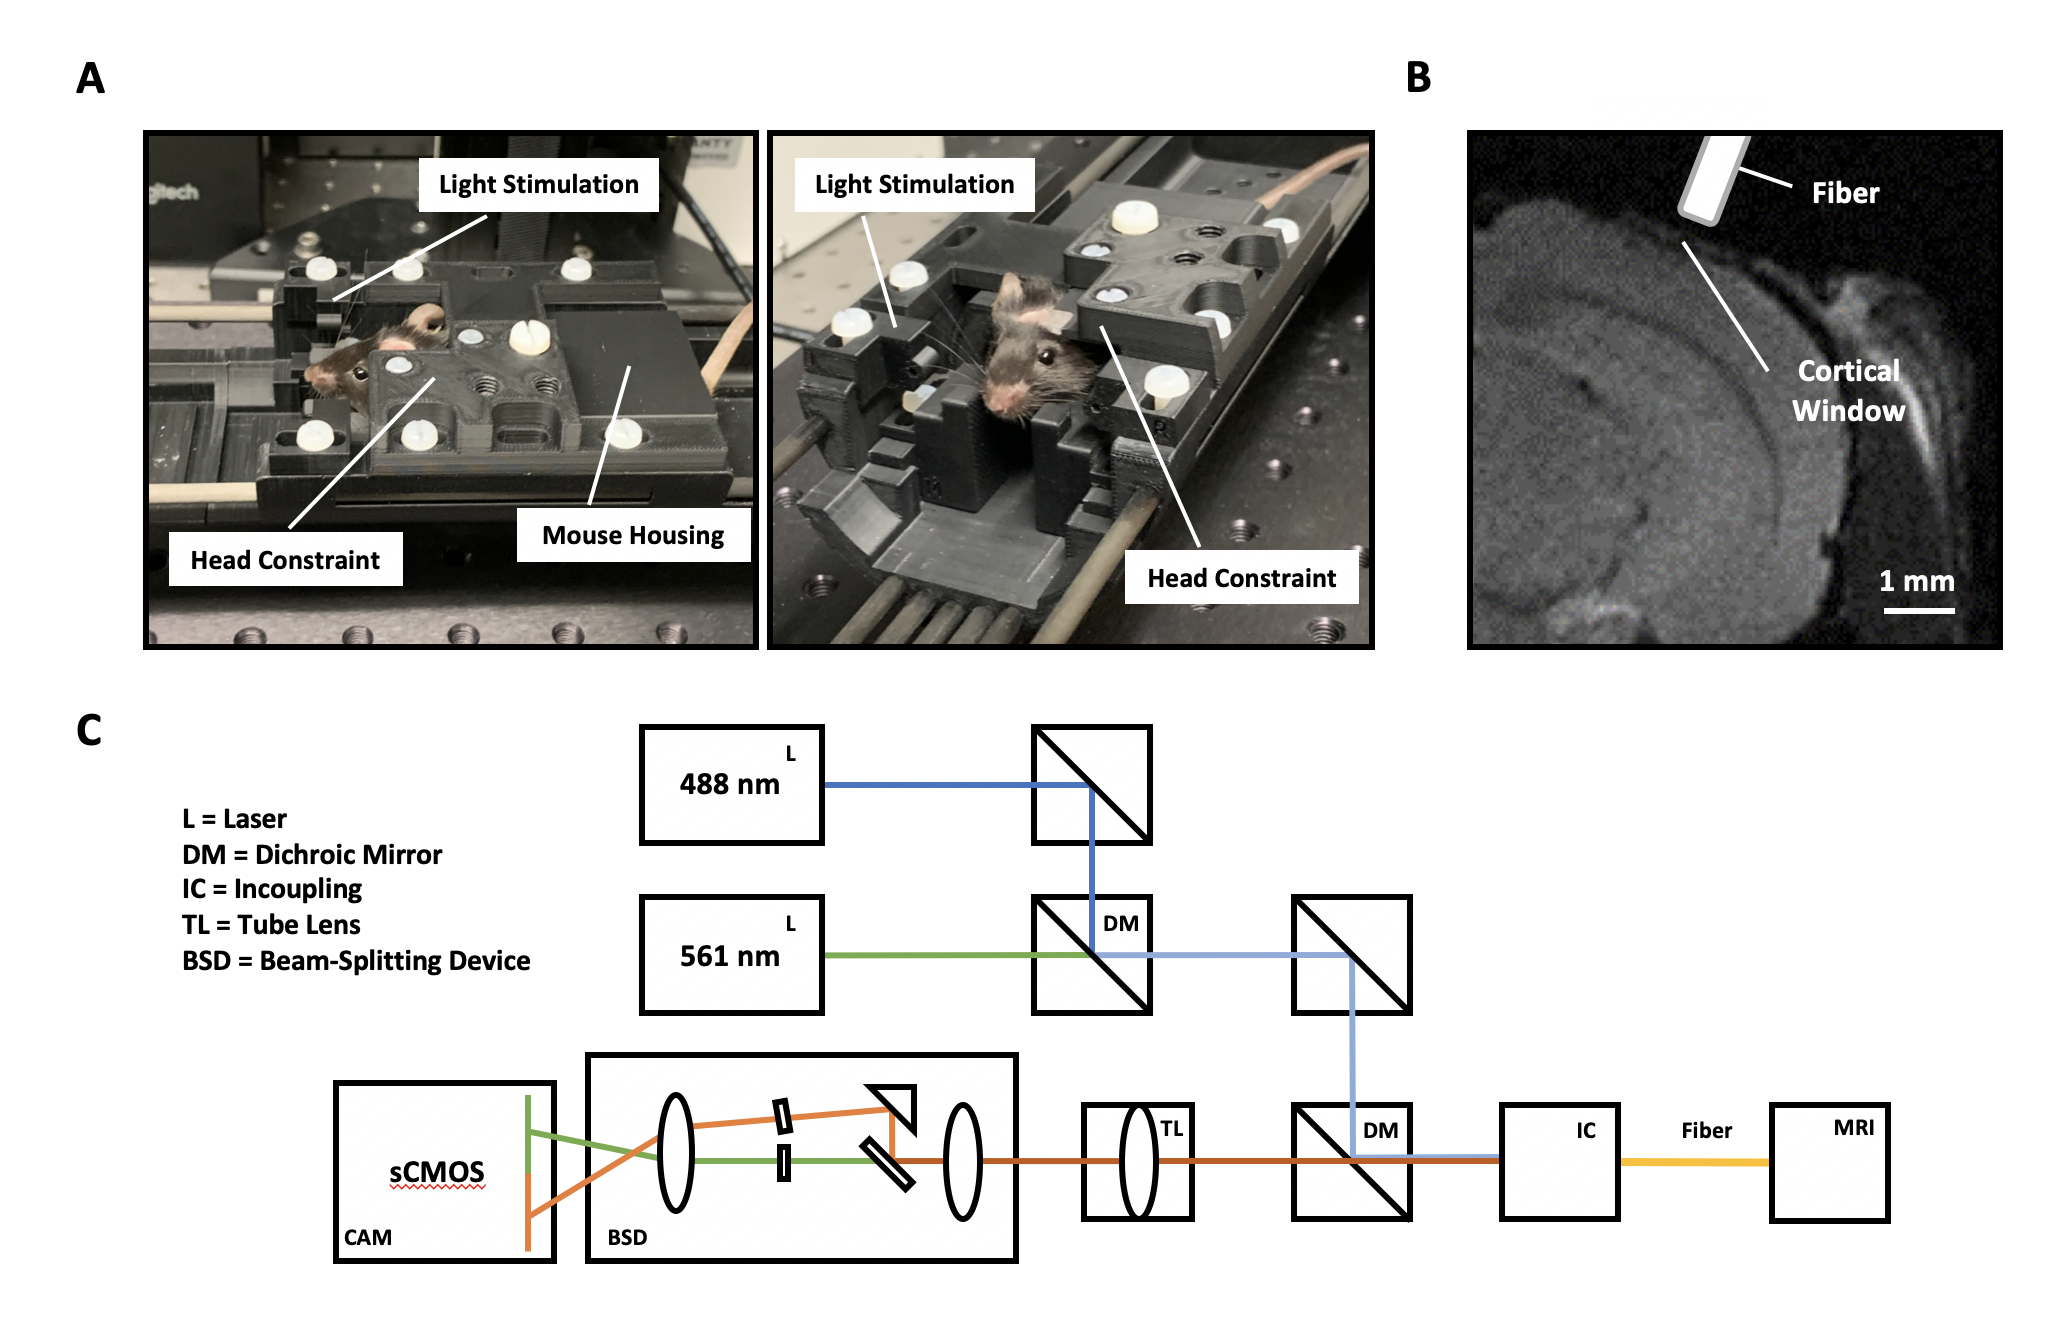
We use an adapted version of a previously published multifiber-photometry setup for calcium imaging (5). By adding an additional laser and a beam-splitter before the sCMOS camera readout, we were able to measure the bulk activity of excitatory and inhibitory neurons (Fig. 1C). All the equipment described in figure 1A/B is MR-compatible and does not degrade the MR-signal during sustained measurements.We injected a genetically modified mouse line that expresses Cre in Somatostatin+ cells with either CamKII-GCaMP6m (targeting excitatory neurons) or Cre dependent RCaMP1.07 (targeting Somatostatin+ neurons) in the primary visual cortex (Visp). A cortical window was implanted for visual access to the injected site, as well as a D2O container to maximize the sample to air distance for improved fMRI signal-to-noise.
In order to make sure that anesthesia did not induce any non-linear effects on the neurovascular coupling, we performed all experiments in awake mice. To minimize stress and movement related artifacts, we used a rigorous habituation protocol that presented the mouse with both MR sound and the experimental protocol. We habituated the mice for a minimum of 10 days, during which we visually inspected mice behavior to determine the success of the habituation protocol.
The stimulation protocol is based on Niranjan et al. (2016), in which mice were presented with a pulsating blue light (480 nm, 0.73 mW) at high (10 Hz) or low (2 Hz) frequency with a duty cycle of 50 milliseconds. In our experiments, trials lasted for either 3000 or 5000 ms. The authors found that lower frequencies led to a strong and reliable positive BOLD signal while higher frequencies showed a negative inflection, providing a great model for studying BOLD signal directionality.
Results
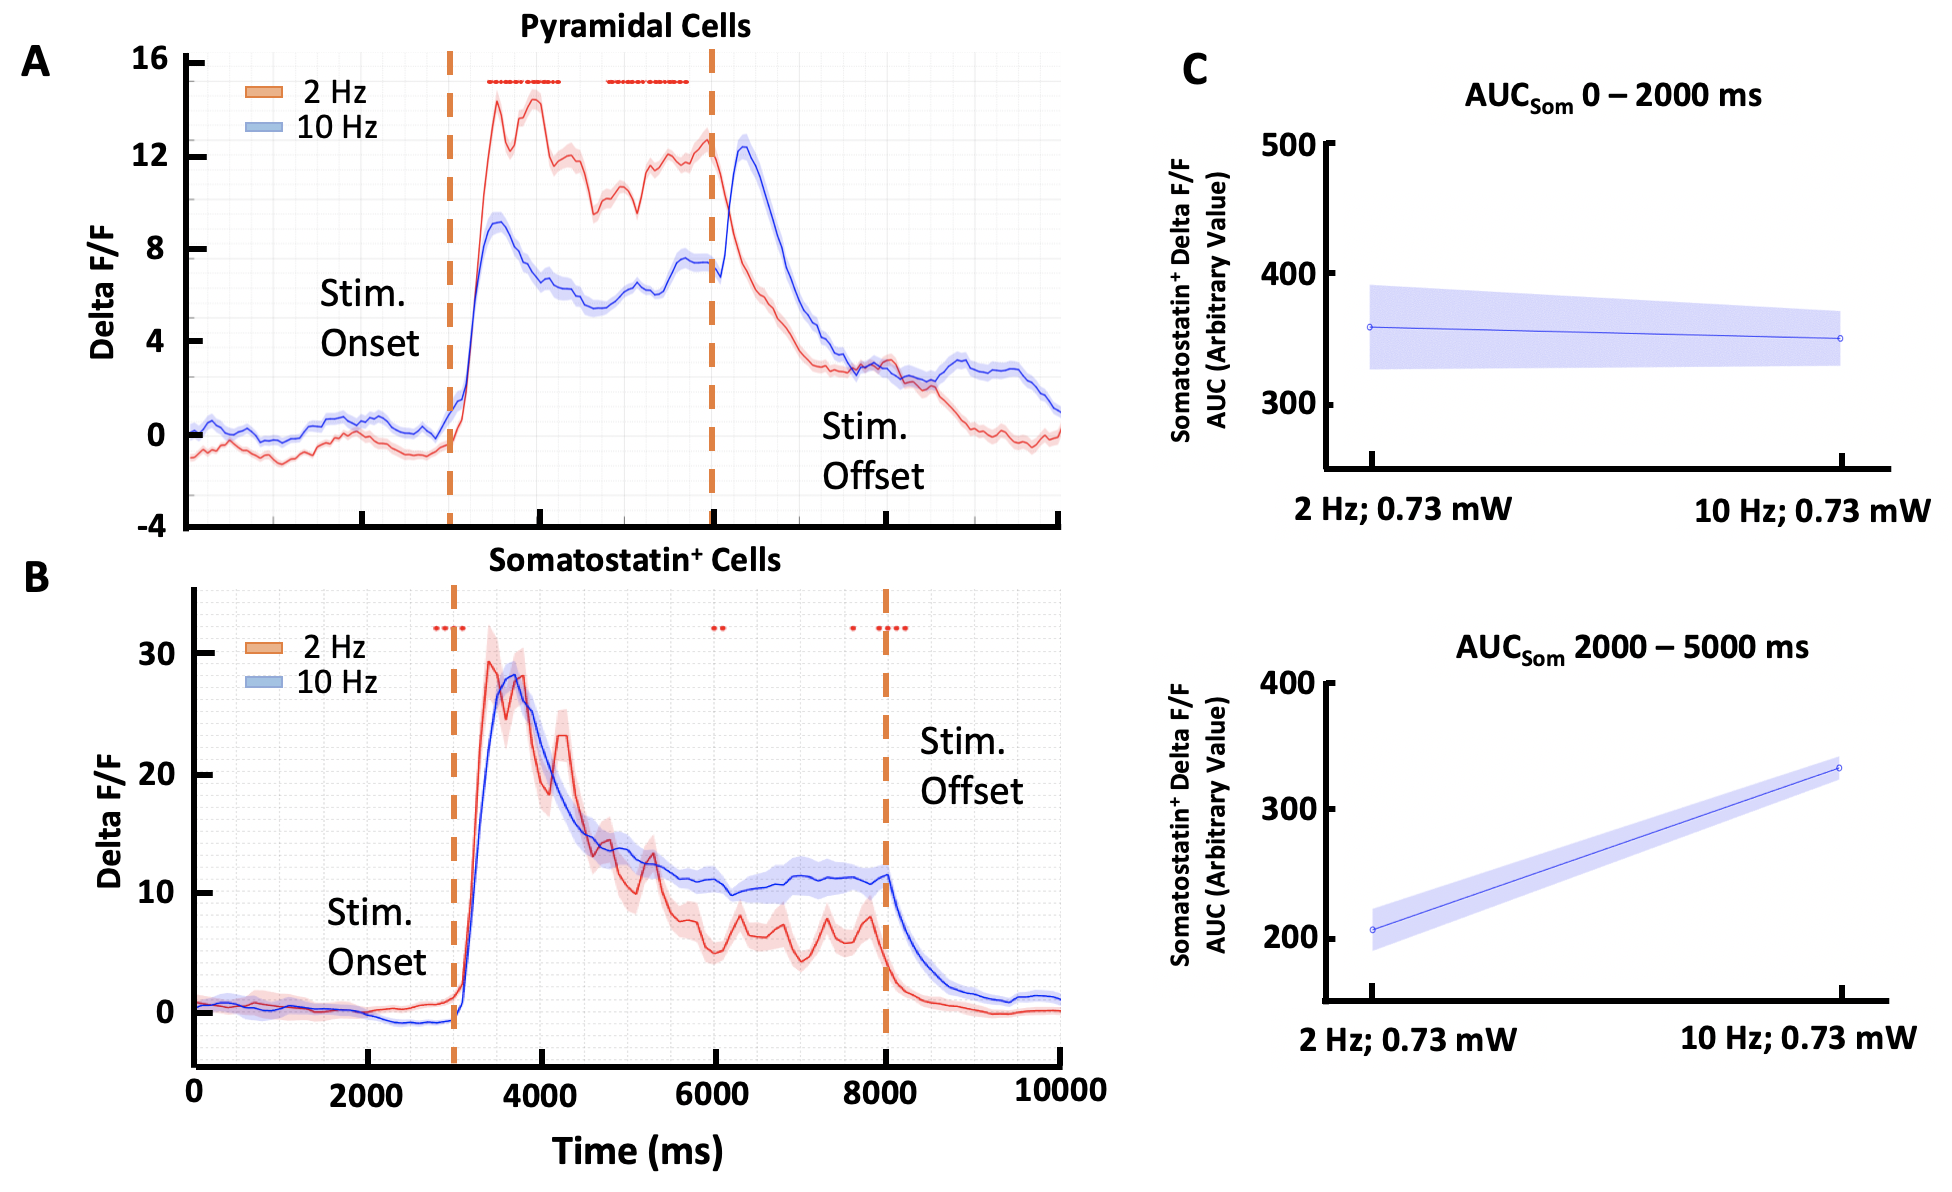
Our results show that there is a stimulus-dependent change in activity for both the excitatory pyramidal and inhibitory Somatostatin+ neurons at the population level (Fig. 2A and 2B). The fluorescence of the pyramidal neurons was higher during 2 Hz stimulation (peak dF/F = 11.9, mean dF/F = 8.8 with SEM = 2.8) than during the 10 Hz stimulation (peak dF/F = 6.9, mean dF/F = 4.7 with SEM = 3.5). In contrast the Somatostatin+ cells lowered their response (2 Hz: peak dF/F = 29.4, mean dF/F = 15.7 with SEM = 2.5; 10 Hz: peak dF/F = 28.2, mean dF/F = 17.9 with SEM = 3.1). This was confirmed by area under the curve (AUC) analysis performed at different time intervals. This analysis demonstrated that inhibitory Somatostatin+ neurons show lower activation during the 2 Hz as compared to 10 Hz stimulation, especially during the 2000 – 5000 ms interval (Fig. 2C; 2 Hz: Arbitrary value = 205.6; 10 Hz: Arbitrary value = 341.7).Conclusion
Our results reveal a stimulus-dependent effect of the EI network on the BOLD signal in the VISp. While previous studies have shown that excitatory activation increases the BOLD signal through a rise in the local metabolic need, our results suggest that excitatory activation can also be associated with a negative BOLD signal in certain situations. Furthermore, we show that this difference could be explained by an increase in the activity of local Somatostatin+ inhibitory neurons. Previous findings have shown that Somatostatin which is released upon inhibitory firing has a strong constricting effect on the local vasculature which leads to a reduction in the fMRI BOLD signal. Taken together, these results suggest that the BOLD signal is not only the result of excitatory activity but also needs to take into account the local EI network activity.Acknowledgements
No acknowledgement found.References
1. Logothetis, N.K., Pauls, J., Augath, M., Trinath, T. and Oeltermann, A., 2001. Neurophysiological investigation of the basis of the fMRI signal. nature, 412(6843), pp.150-157.
2. Shmuel, A., Yacoub, E., Pfeuffer, J., Van de Moortele, P.F., Adriany, G., Hu, X. and Ugurbil, K., 2002. Sustained negative BOLD, blood flow and oxygen consumption response and its coupling to the positive response in the human brain. Neuron, 36(6), pp.1195-1210.
3. Logothetis, N.K., 2008. What we can do and what we cannot do with fMRI. Nature, 453(7197), pp.869-878.
4. Douglas, R.J., Martin, K.A. and Whitteridge, D., 1989. A canonical microcircuit for neocortex. Neural computation, 1(4), pp.480-488.
5. Sych, Y., Chernysheva, M., Sumanovski, L.T. and Helmchen, F., 2019. High-density multi-fiber photometry for studying large-scale brain circuit dynamics. Nature methods, 16(6), p.553.
6. Niranjan, A., Christie, I.N., Solomon, S.G., Wells, J.A. and Lythgoe, M.F., 2016. fMRI mapping of the visual system in the mouse brain with interleaved snapshot GE-EPI. Neuroimage, 139, pp.337-345.
Figures