2930
Lack of visual critical period of plasticity induces BOLD modulations in the rat binocular subregion of the primary visual cortex1Champalimaud Centre for the Unknown, Lisbon, Portugal
Synopsis
Experience induced visual cortical (VC) plasticity is key for adequate pathway maturation and circuitry refinement. Competing inputs from each eye arriving to the thalamic lateral geniculate nucleus and, later, to VC, are necessary to shape and develop visual binocularity. Without such competition, an increased responsiveness and number of binocular cortical neurons has been reported. Here, we investigated monocular stimulation in rats that had been dark reared and compared their cortical BOLD responses with normal reared animals. Increased BOLD responses appeared along the VC of the dark reared group, suggesting a lack of pathway maturation and binocular integration.
Introduction
The development of the visual system is shaped by early-life sensory experience that instructs the maturation of neural circuits in the cortex during critical periods of plasticity1,2,3. In the visual cortex (VC), experience changes visual responsiveness of cortical neurons and competitive interactions between the two eyes regulate the firing of the binocular subregion (V1B), where inputs from the two eyes converge4. In the rat, two sources of binocularity exist: the retinogeniculate pathway and the callosal pathway2. Thalamocortical connections carrying visual drive from each eye are not hardwired and thus, normal vision is required for the development of cortical wiring that supports binocular vision5. On the other hand, callosal connections play a critical role in determining cortical binocularity. By modulating visual experience, callosal development is affected along with the communication between the two hemispheres2. One way to manipulate visual experience is by dark rearing (DR) the animals and this has shown to prevent postnatal maturation of visual cortical functions with most cells receiving binocular input and visual acuity decreasing by half6. Due to the clear modulation of binocularity with altered visual experience, we wanted to investigate BOLD modulations, in particular in the V1B region, in dark reared rats that received monocular stimulation.Methods
Animal experiments were preapproved by institutional and national authorities and were carried out according to European Directive 2010/63. Adult Long Evans rats were sedated with medetomidine while temperature and respiration rate were monitored and kept stable. Dark reared animals spent the first 7 weeks in a room especially designed for complete darkness before imaging.MRI experiments: A 9.4T BioSpec scanner (Bruker, Karlsruhe, Germany) with an 86mm quadrature resonator for transmittance and a 4-element array cryoprobe7,8 (Bruker, Fallanden, Switzerland) for signal reception was used. Data was acquired under enriched oxygen medical air condition (28%O2) with a GE-EPI sequence (TE/TR=14/1000ms, FOV=20x13mm2, in-plane resolution=250x250μm2, slice thickness=1mm, tacq= 6min 45s).
Visual Stimulation: A blue LED (𝜆=470nm and I=8.1×10⁻¹W/m2) was used to perform monocular stimulation to the left eye. Stimulation paradigm consisted of eight repetitions of 15s stimulation and 45s rest (Fig.1A).
Data analysis: Pre-processing steps included manual outlier correction; slice-timing (sinc-interpolation); smoothing (3D Gaussian kernel, FWHM=0.250mm isotropic); mean volume realignment and co-registration to an anatomical reference. An HRF peaking at 1s was convolved que the paradigm. In the general linear model analysis, a minimum significance level of 0.001 (FDR corrected) with a minimum cluster size of 20 voxels were used. Manual drawing of atlas-based9 ROIs (Fig.1B) was done for calculation of individual runs followed by a 5th polynomial fit to the resting periods. A two-sample t-test was used for the statistical comparison as data did not reject the Shapiro-Wilk10 test’s null hypothesis.
Results
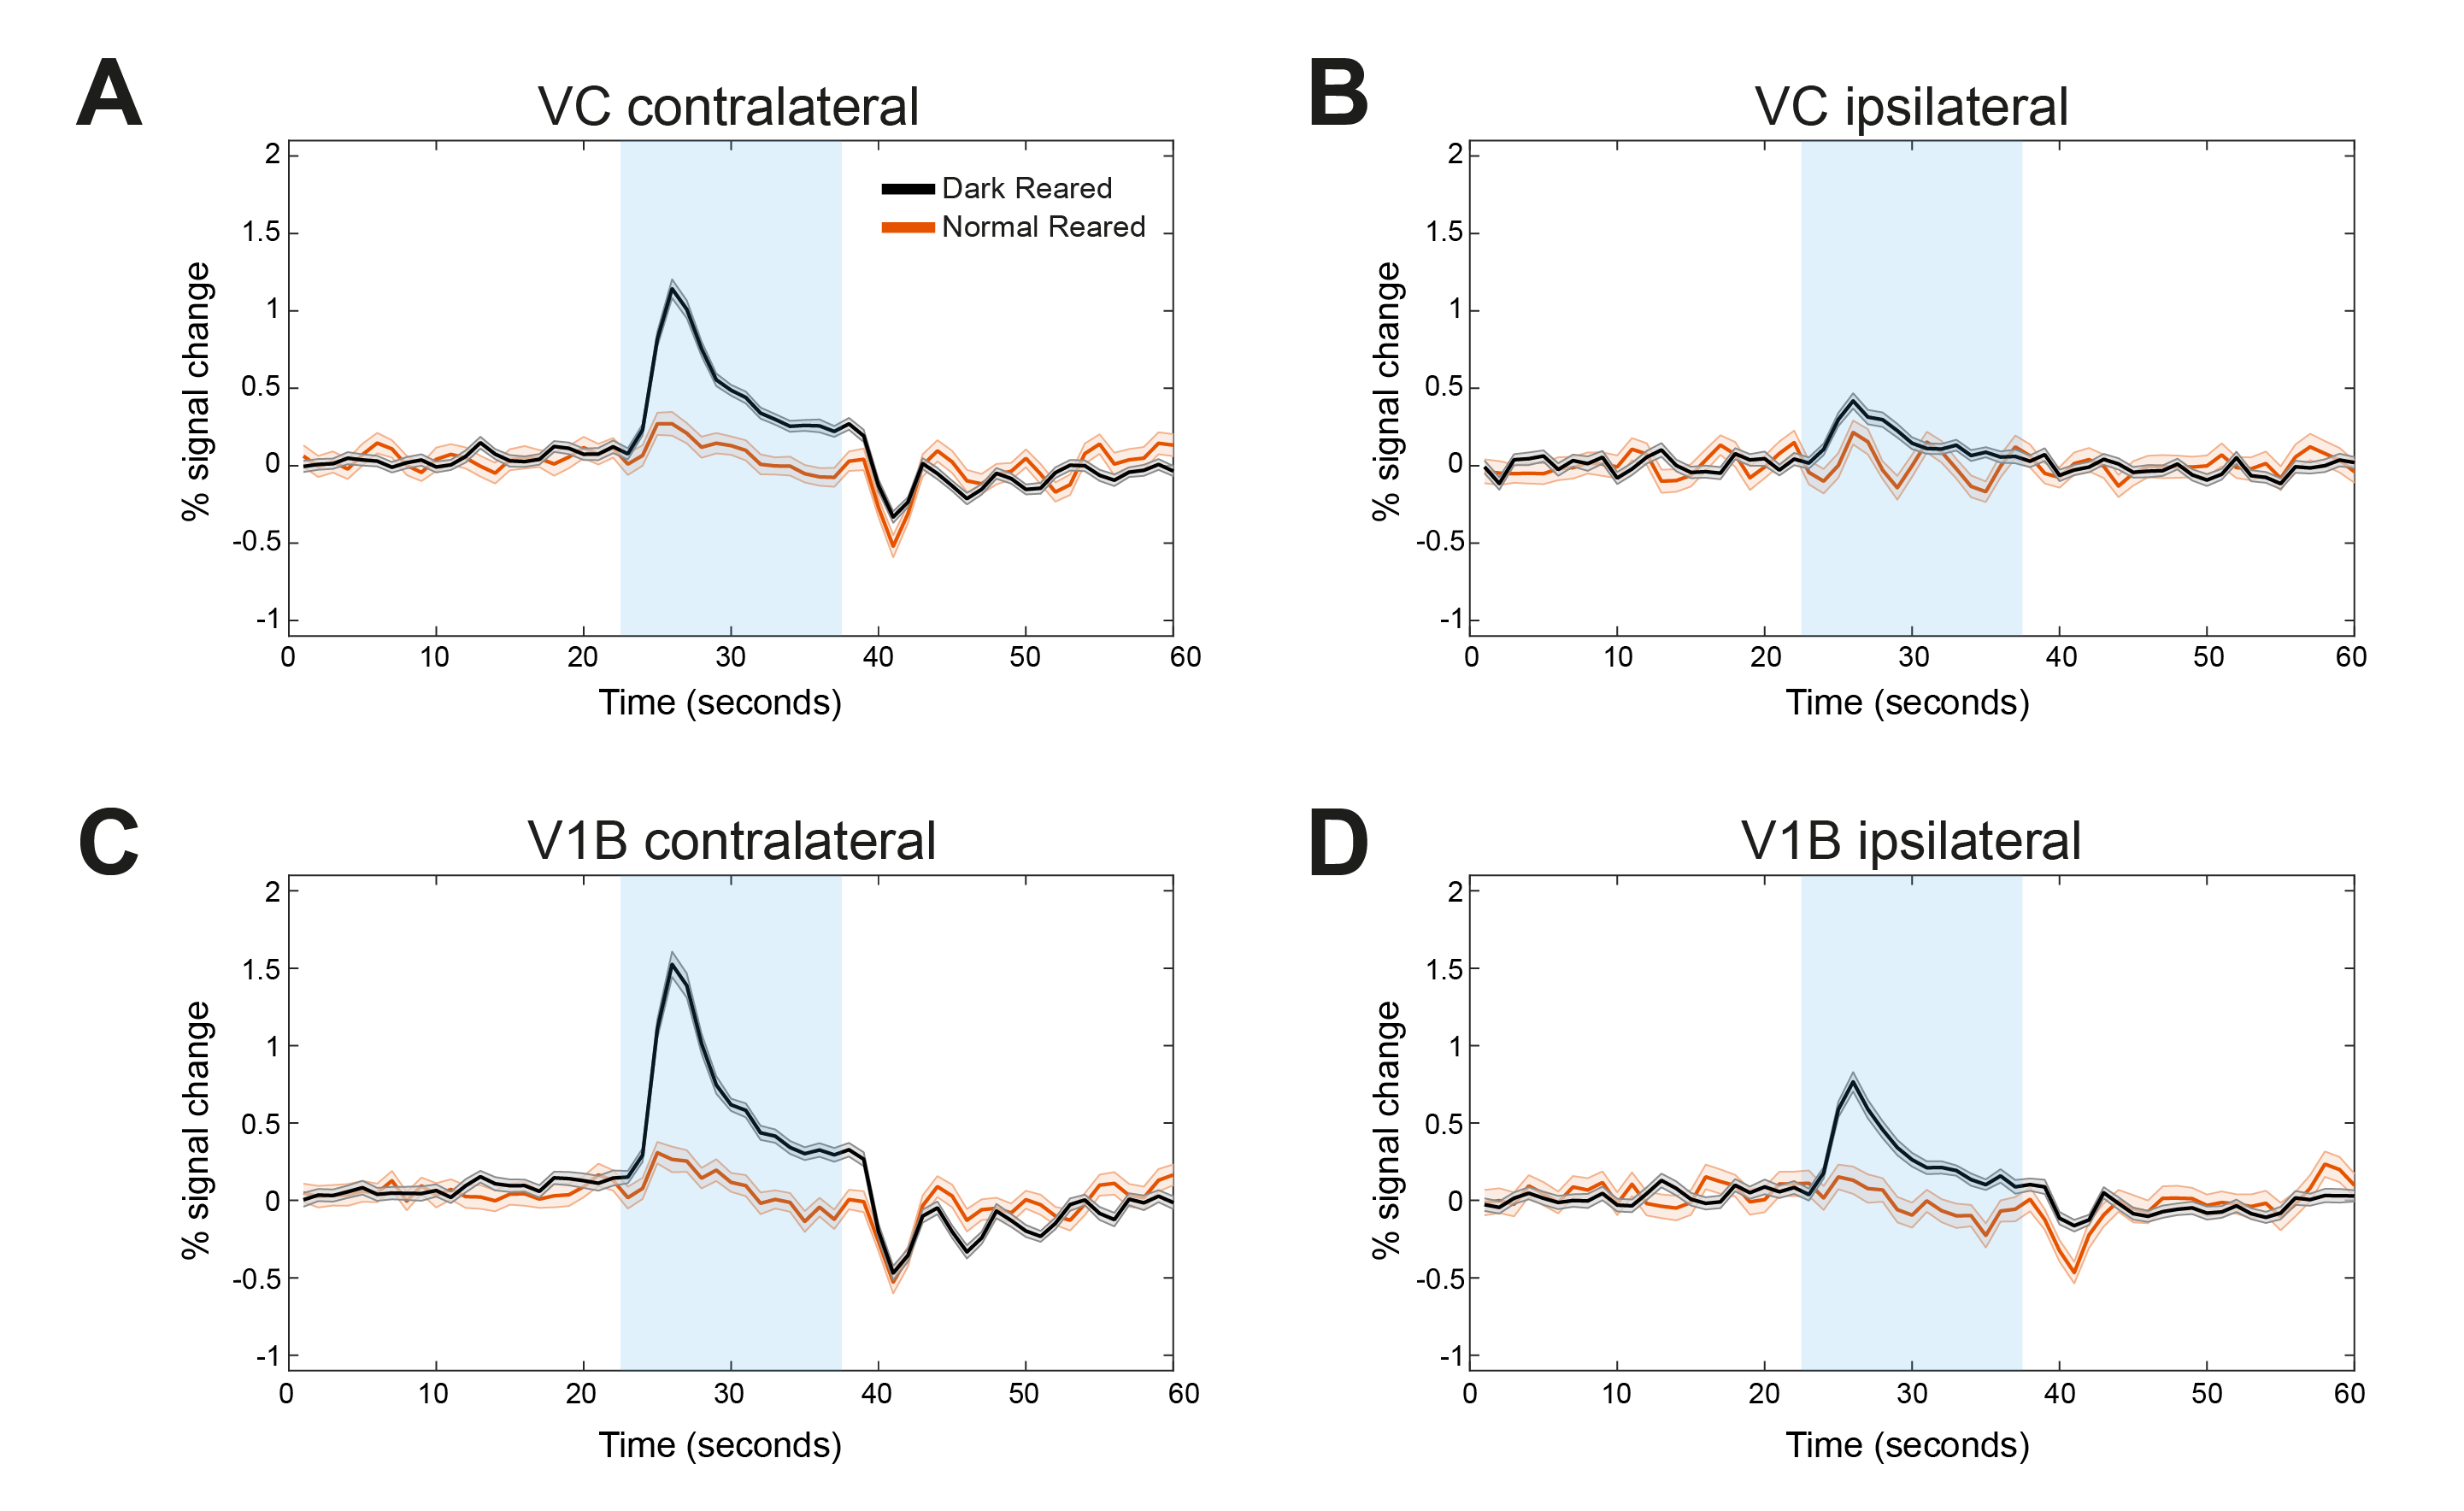
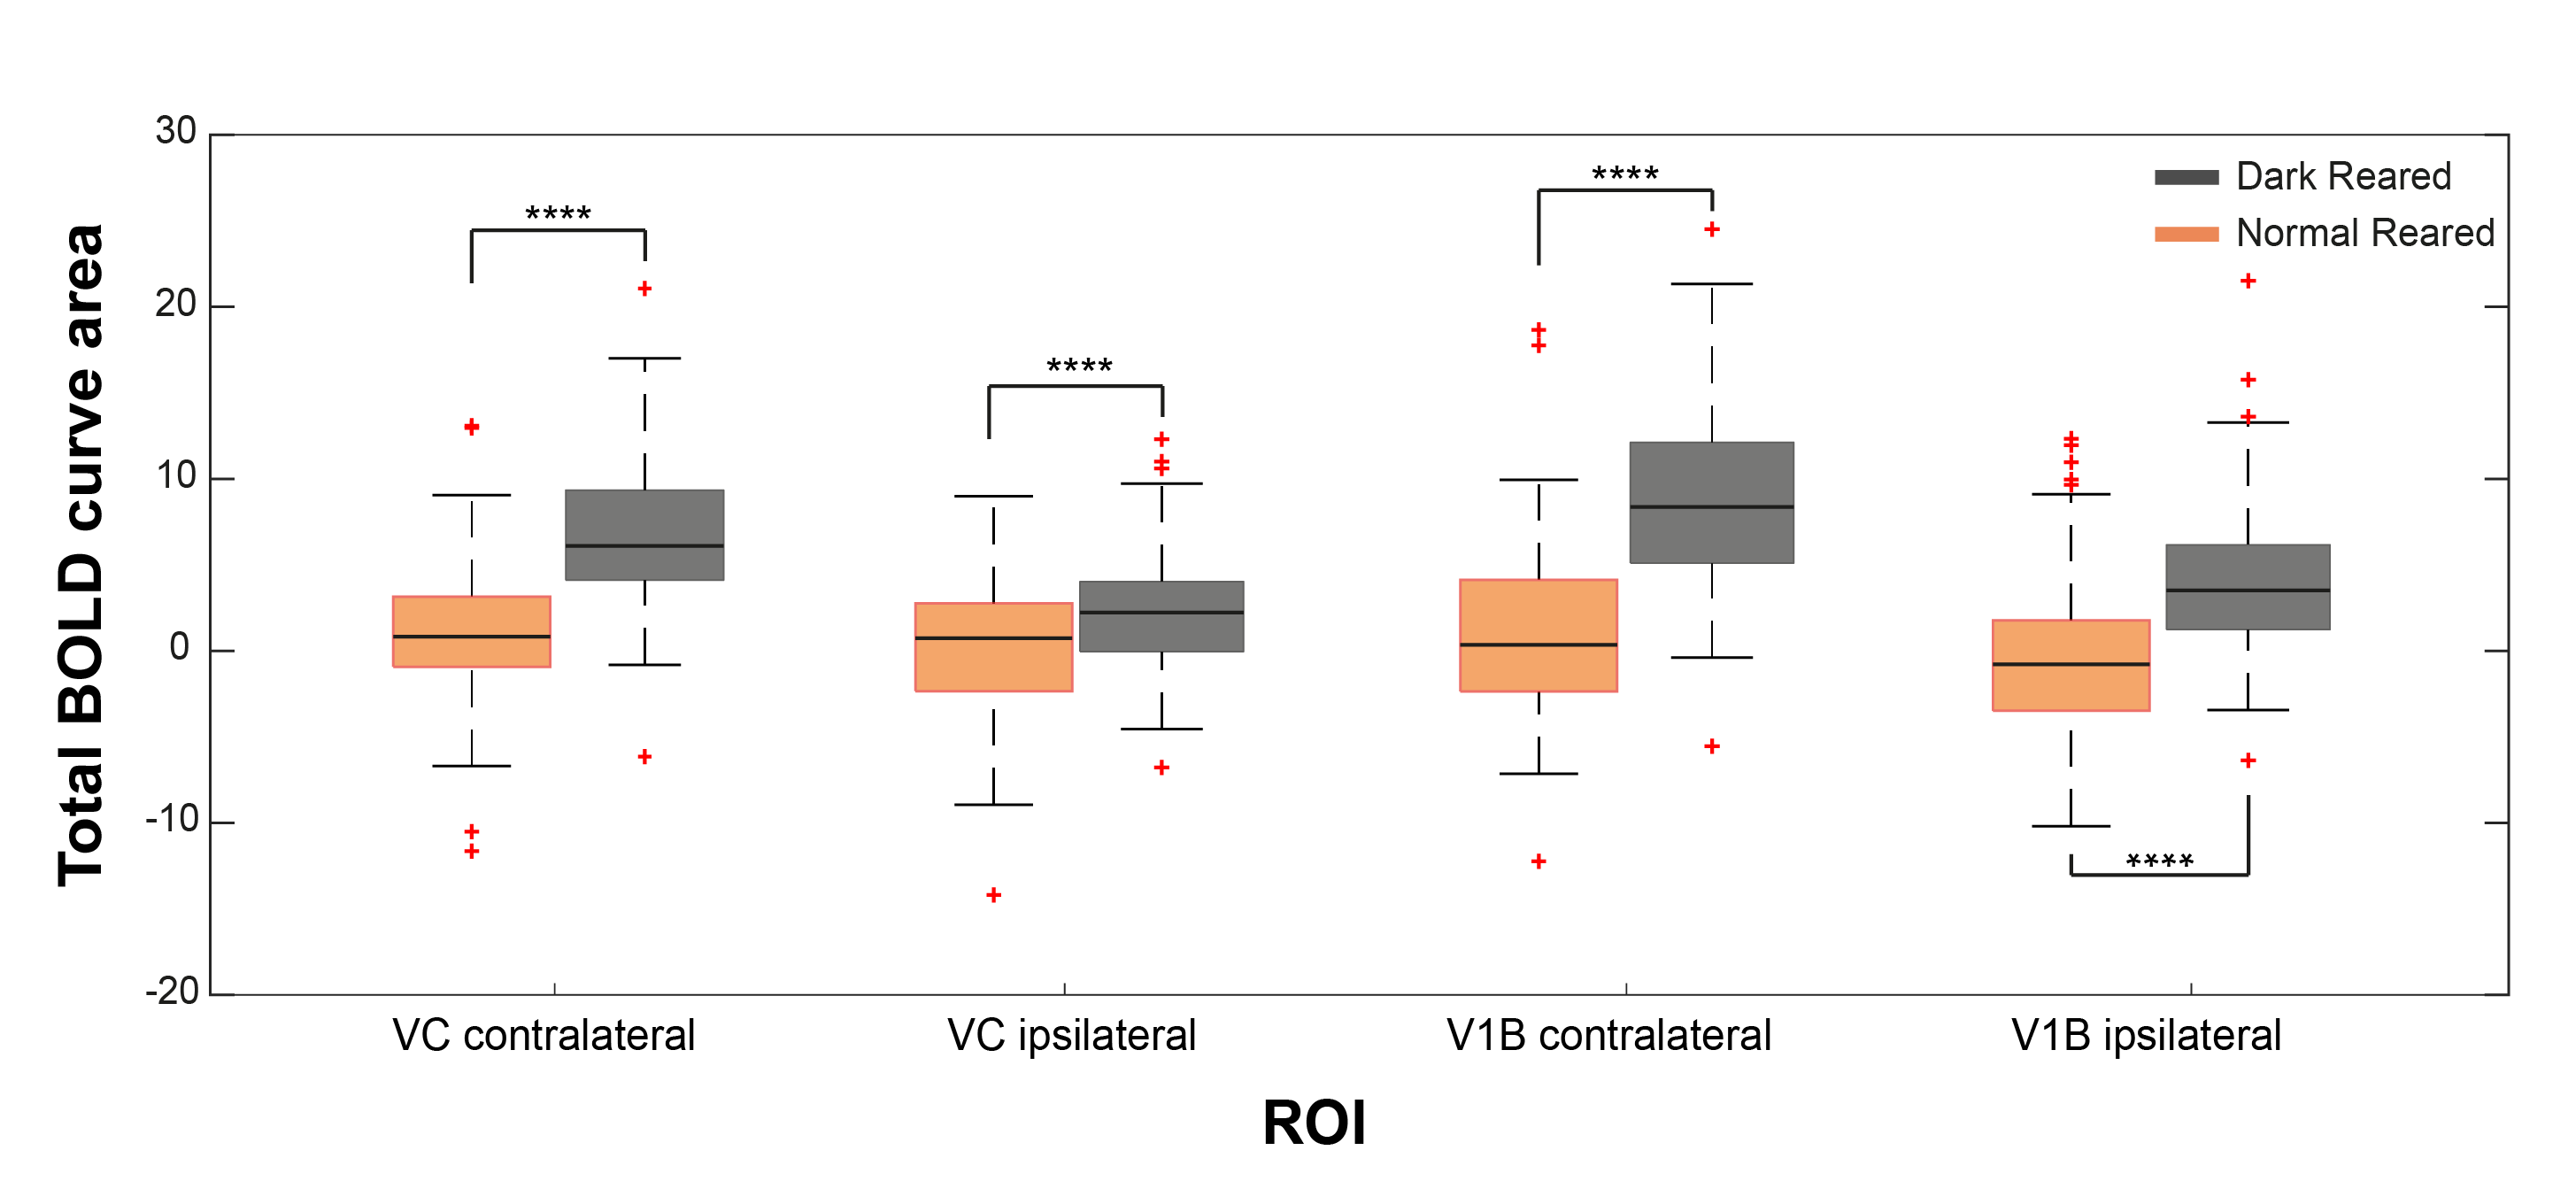
Fig.2 shows the BOLD t-maps obtained for the two rearing conditions. Overall broader cortical BOLD responses can be observed in the contralateral VC of dark reared animals along with broader responses in the lateral geniculate nucleus of the thalamus (LGN), highlighted in the figure with blue and yellow arrows, respectively. In particular, cortical BOLD in the V1B region of normal reared animals was absent. Conversely, strong positive BOLD responses were observed in this area for the dark reared group. Superior colliculus presents higher t-values in the normal rearing condition. Cortical time-courses (Fig.3) confirm the strong increase in contralateral BOLD responses along with a slight increase in ipsilateral responses. A two-sample t-test (Fig.4) confirmed the significant differences of cortical total BOLD curve areas between the rearing regimes (p≤0.0001 for contralateral VC and V1B and for ipsilateral VC and V1B).Discussion
Ample evidence suggests that cortical plasticity depends on sensory-experience1,2,3,4,11,12. One study showed that after 24h monocular deprivation, bilateral stimulation potentiates responses in L2/3 V1B contralateral to the deprived eye. This rapid increase in responsiveness of V1B was attributed to a weakening of inhibitory drive onto pyramidal neurons4. In another study, the measured percentage of binocular cells was significantly higher (95%) than that of normal adult rats (80%) with, however a dramatic decrease in orientation selective cells (1.6% vs 50% in normal rats)6.The increases in V1B BOLD responses observed in this study for the first time, are in-line with these findings suggesting a more immature and unspecialised brain where experience-related plasticity did not take place. The absence of normal reared animals V1B responses upon monocular stimulation might result from competing inputs from the stimulated and non-stimulated eye, that do not exist or are unrefined in the dark reared brain. Also, the broader dark reared LGN responses, where thalamocortical afferents initiate, might indicate that these projections might be altered contributing to the increased V1B responses upon dark rearing. These results shed light in the cortical plasticity upon dark rearing.Conclusions
Sensory experience influences cortical maturation and binocularity. Results show significantly increased VC BOLD responses in dark reared rats, particularly in the V1B subregion, where inputs from both eyes converge. This might indicate that the immature brain that did not go though the critical period of plasticity does not have the refined circuitry for binocular integration.Acknowledgements
This study was funded in part by the European Research Council (ERC) (agreement No. 679058). The authors acknowledge the vivarium of the Champalimaud Centre for the Unknown, a facility of CONGENTO which is a research infrastructure co-financed by Lisboa Regional Operational Programme (Lisboa 2020), under the PORTUGAL 2020 Partnership Agreement through the European Regional Development Fund (ERDF) and Fundação para a Ciência e Tecnologia (Portugal), project LISBOA-01-0145-FEDER-022170. Finally, the authors would like to thank Francisca F. Fernandes for the assistance during fMRI data analysis.References
[1] Hubel DH, Wiesel TN. 1970. The period of susceptibility to the physiological effects of unilateral eye closure in kittens. J. Physiol. 206:419–36;
[2] Pietrasanta, Marta, Laura Restani, and Matteo Caleo. "The corpus callosum and the visual cortex: plasticity is a game for two." Neural plasticity 2012 (2012);
[3] Kuhlman, Sandra J., et al. "A disinhibitory microcircuit initiates critical-period plasticity in the visual cortex." Nature 501.7468 (2013): 543-546;
[4] Griffen, Trevor C., et al. "Rapid plasticity of visually evoked responses in rat monocular visual cortex." Plos one 12.9 (2017): e0184618;
[5] Berry, Kalen P., and Elly Nedivi. "Experience-dependent structural plasticity in the visual system." Annual review of vision science 2 (2016): 17-35;
[6] Fagiolini, Michela, et al. "Functional postnatal development of the rat primary visual cortex and the role of visual experience: dark rearing and monocular deprivation." Vision research 34.6 (1994): 709-720;
[7] Niendorf, Thoralf, et al. "Advancing cardiovascular, neurovascular and renal magnetic resonance imaging in small rodents using cryogenic radiofrequency coil technology." Frontiers in pharmacology 6 (2015): 255;
[8] Baltes, Christof, et al. "Micro MRI of the mouse brain using a novel 400 MHz cryogenic quadrature RF probe." NMR in Biomedicine: An International Journal Devoted to the Development and Application of Magnetic Resonance In vivo22.8 (2009): 834-842;
[9] Paxinos, George, and Charles Watson. The rat brain in stereotaxic coordinates: hard cover edition. Elsevier, 2006;
[10] Shapiro, Samuel Sanford, and Martin B. Wilk. "An analysis of variance test for normality (complete samples)." Biometrika52.3/4 (1965): 591-611;
[11] Gordon, Joshua A., and Michael P. Stryker. "Experience-dependent plasticity of binocular responses in the primary visual cortex of the mouse." Journal of Neuroscience 16.10 (1996): 3274-3286;
[12] He, Hai-Yan, William Hodos, and Elizabeth M. Quinlan. "Visual deprivation reactivates rapid ocular dominance plasticity in adult visual cortex." Journal of Neuroscience 26.11 (2006): 2951-2955.
Figures
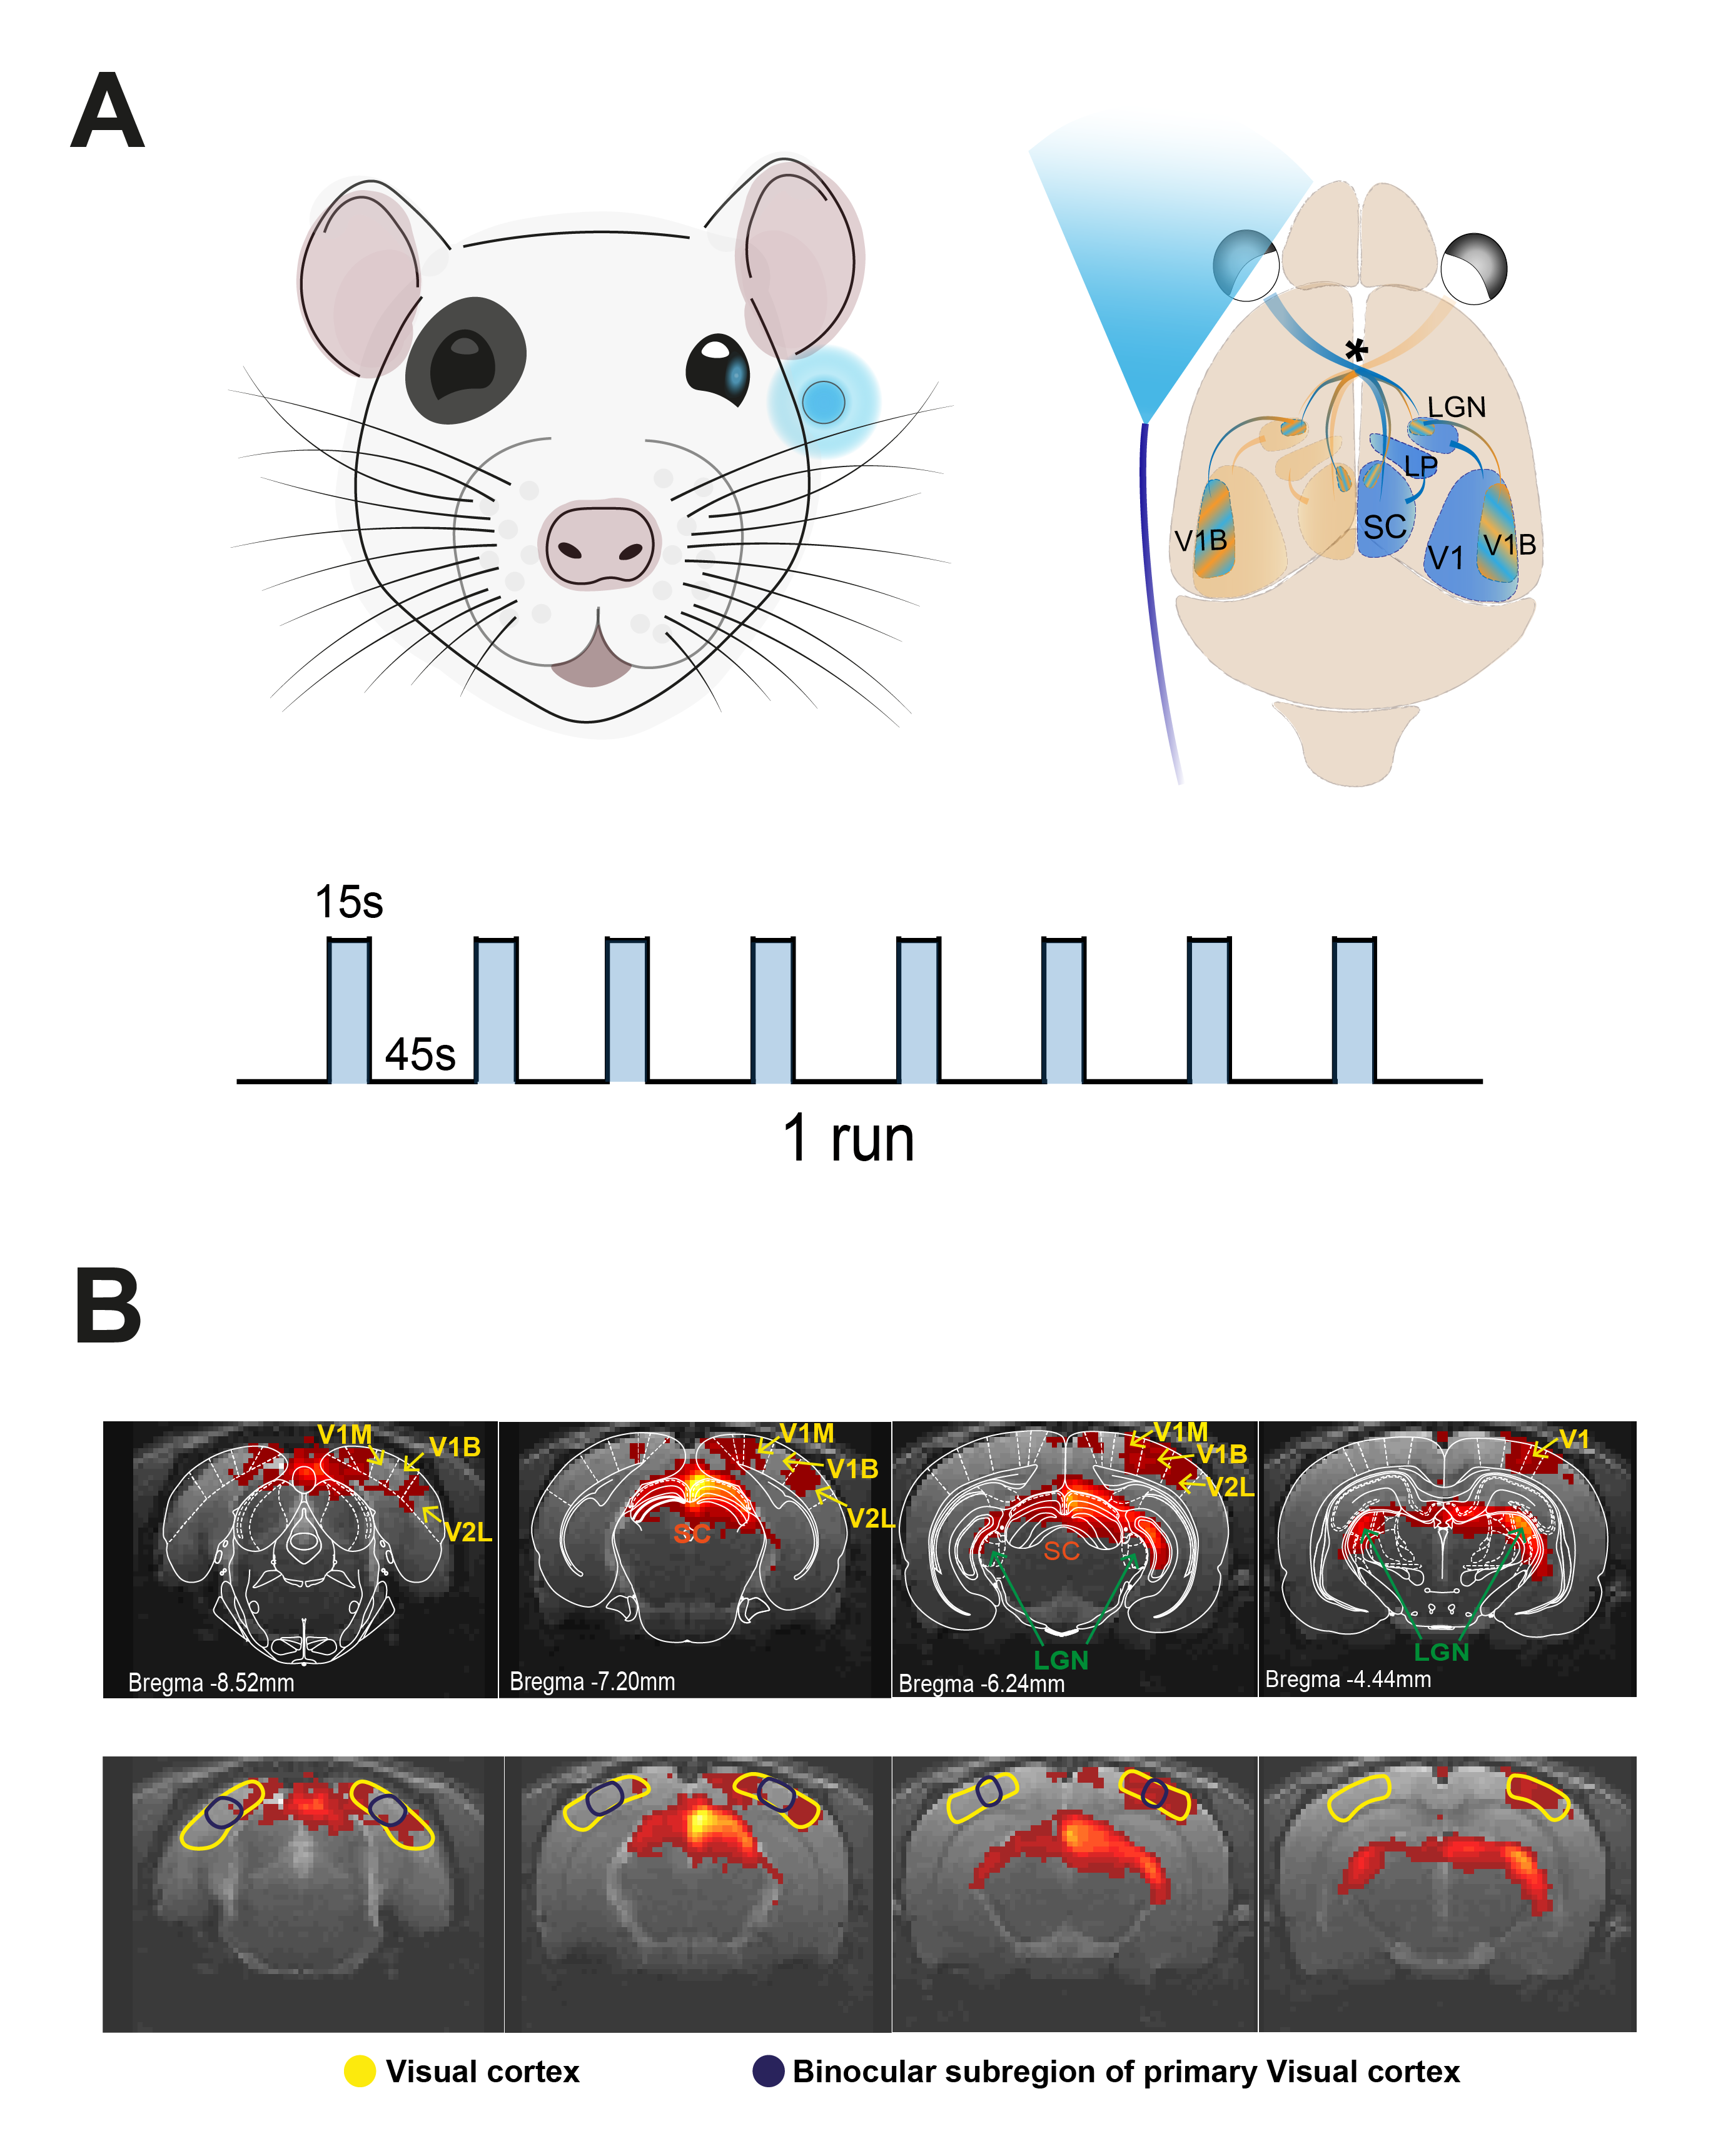
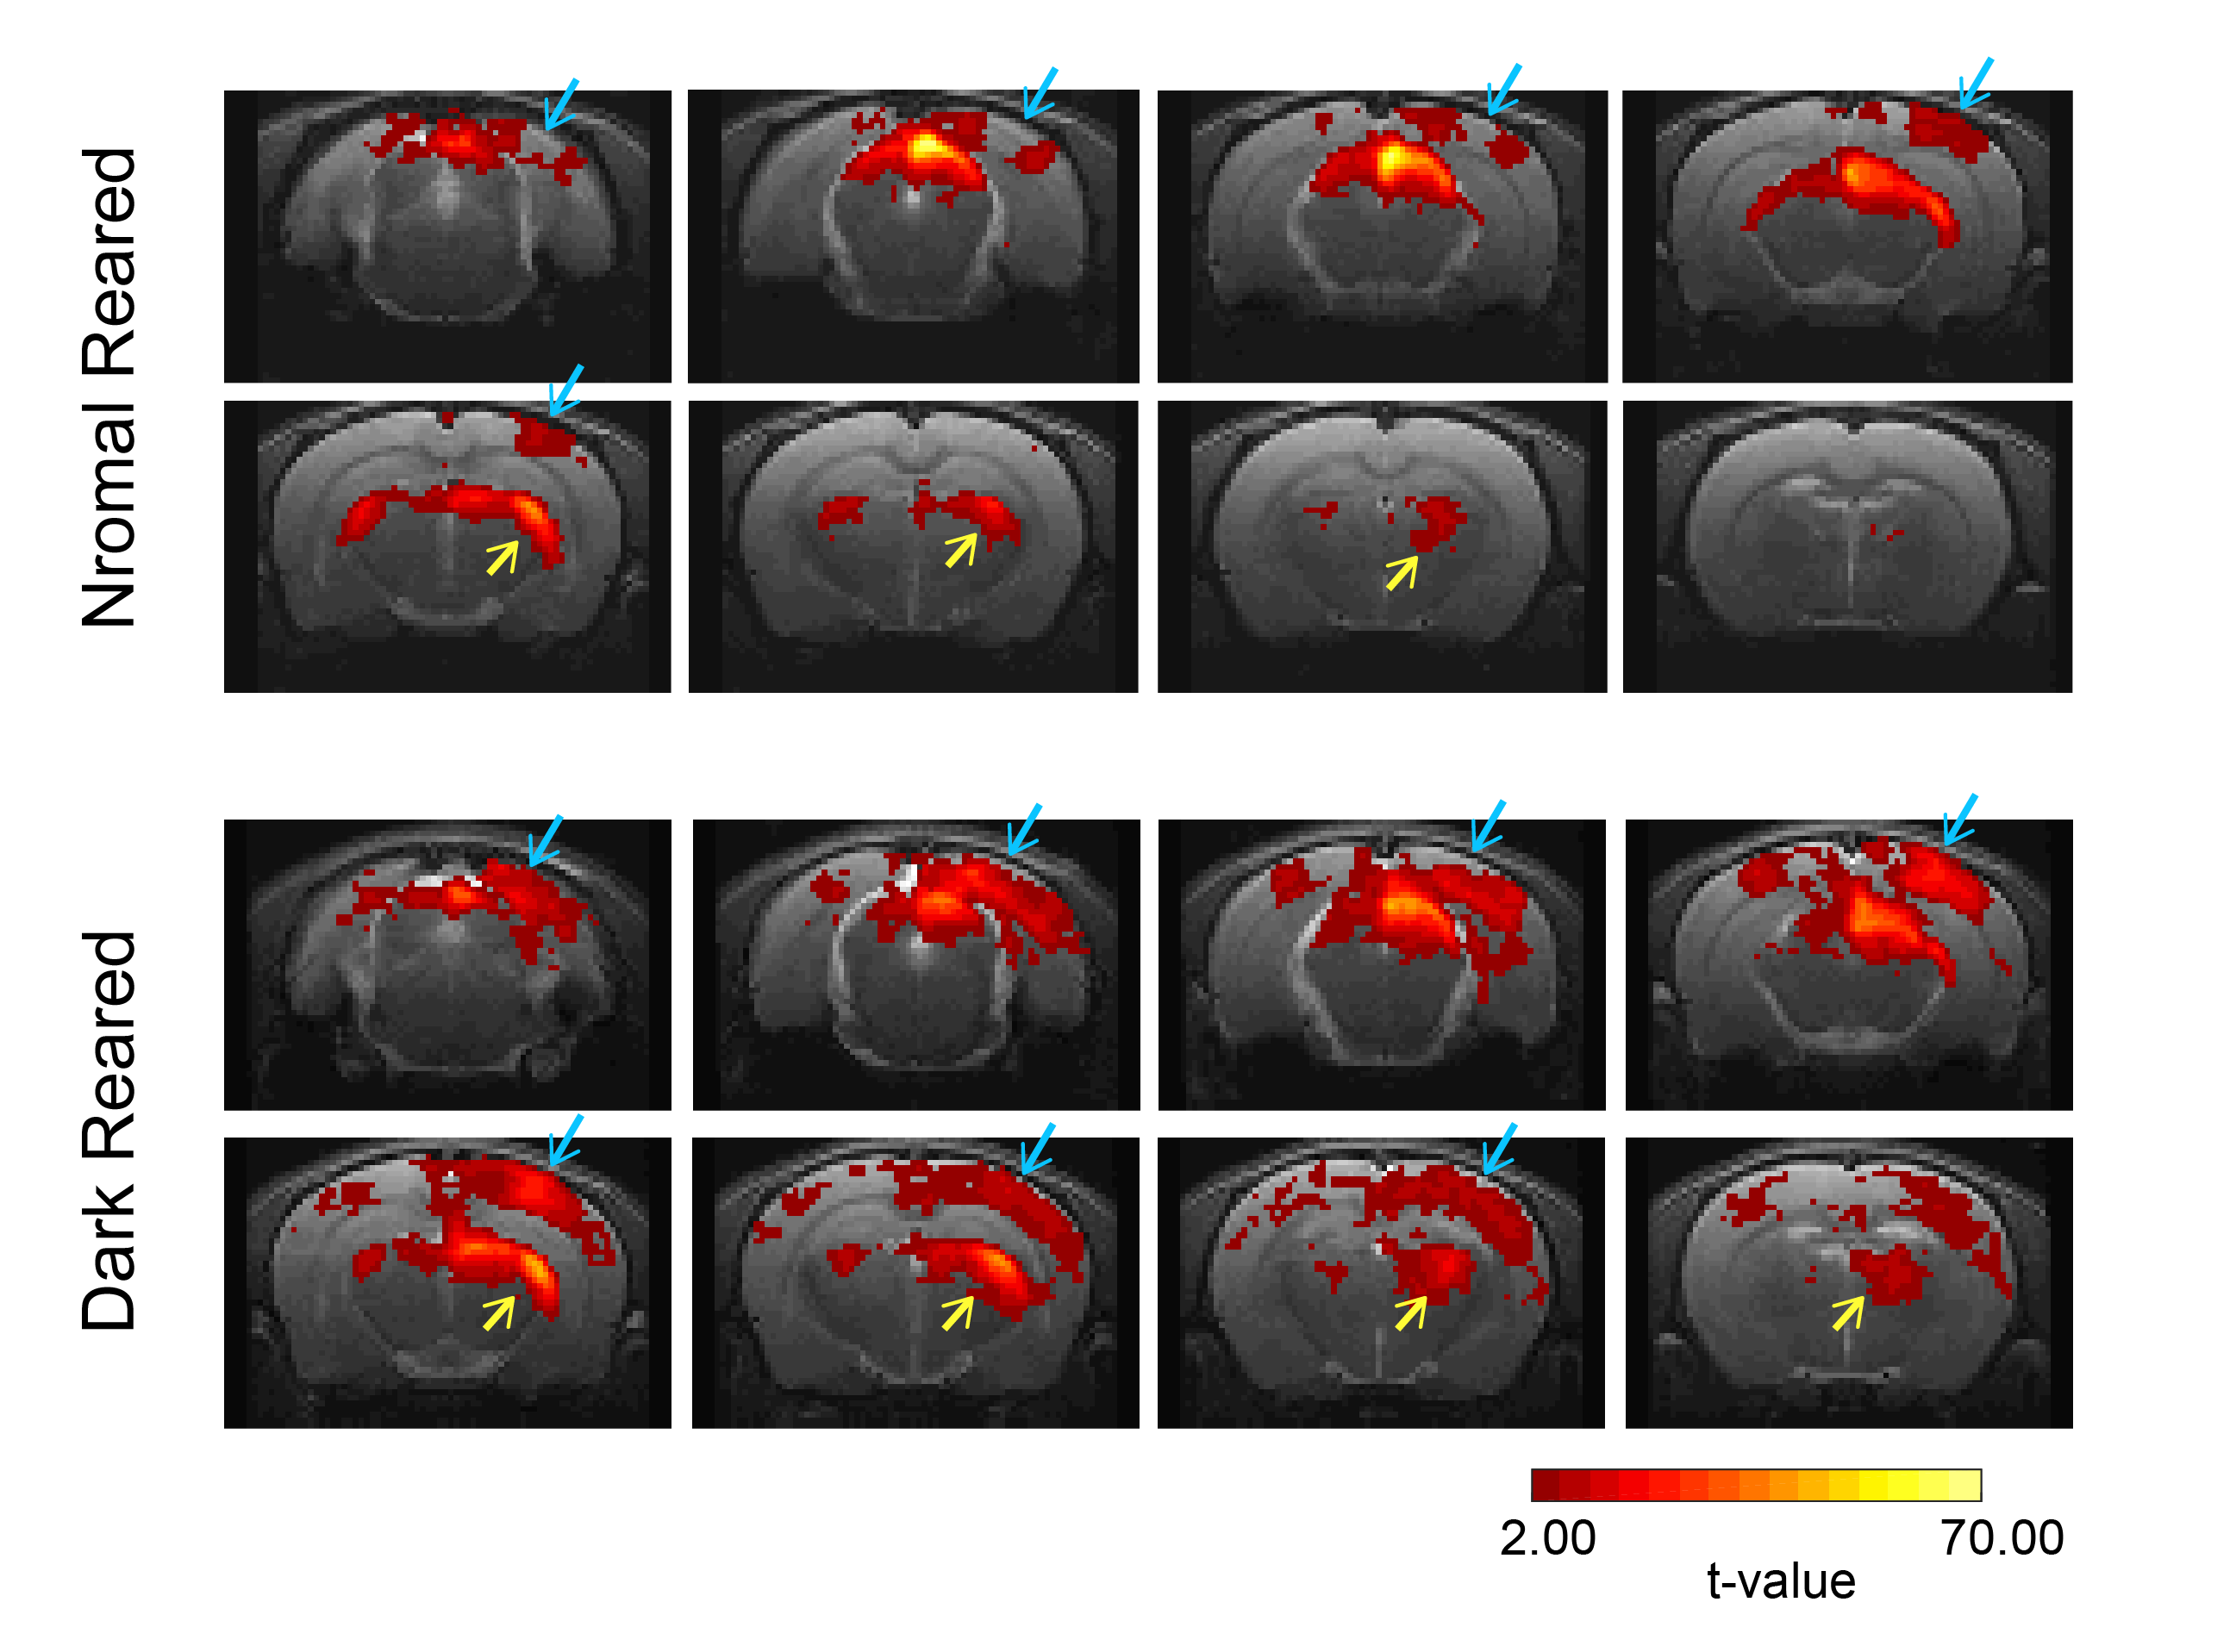
Fig.2: BOLD t-maps. TOP: Normal reared animals (N=7, 15 runs); BOTTOM: Dark reared animals (N=6, 16 runs). A significance value of 0.001 (FDR corrected) with minimum cluster size of 20 voxels was used in the generation of the maps. Blue arrows are pointing to the contralateral V1B region while yellow arrows are pointing to the contralateral lateral geniculate nucleus of the thalamus.