2927
MRI based retinotopy of the rat visual pathway1Champalimaud Centre for the Unknown, Lisbon, Portugal
Synopsis
Unravelling the fine-grained organization of the visual system is essential for understanding the foundations of vision in health and disease. Receptive field (RF) properties and retinotopic maps across the visual pathway were estimated non-invasively at unprecedented resolution, for the first-time in rodents. We tailored a set-up to deliver complex stimuli in preclinical scanners, and combined BOLD-fMRI with biologically-inspired models to investigate how RFs vary across cortical depth and hierarchy. We show that Lateral Geniculate Nucleus (LGN), Visual Cortex (VC) and Superior Colliculus (SC) are retinotopically organized and that RF sizes vary across cortical layers, spiking at layers IV and VI.
Introduction
Accurate, non-invasive, large-scale mapping of RF properties and retinotopic organization of the visual pathway, preferably with high-resolution, is fundamental for understanding the neural basis of sensory and cognitive behaviour. FMRI is particularly suitable for RF characterization as it allows to examine the entire brain non-invasively at extraordinary spatial resolution, albeit relying on an indirect neurovascular coupling. Indeed, fMRI has enabled the estimation of population RFs properties non-invasively in humans, although at a coarse level of detail1-3. In rodents, however, RF characterization has to date only been estimated using local electrophysiological and optical measurements that lack the ability to report on brain-wide aspects4–7. Here, we describe a novel setup specifically designed for high-resolution mapping of rodents' RFs across the visual pathway using high-field fMRI. We applied BOLD-fMRI and neurocomputational models to investigate how RF properties and retinotopic maps vary across cortical laminae and hierarchy of the rat visual pathway.Methods
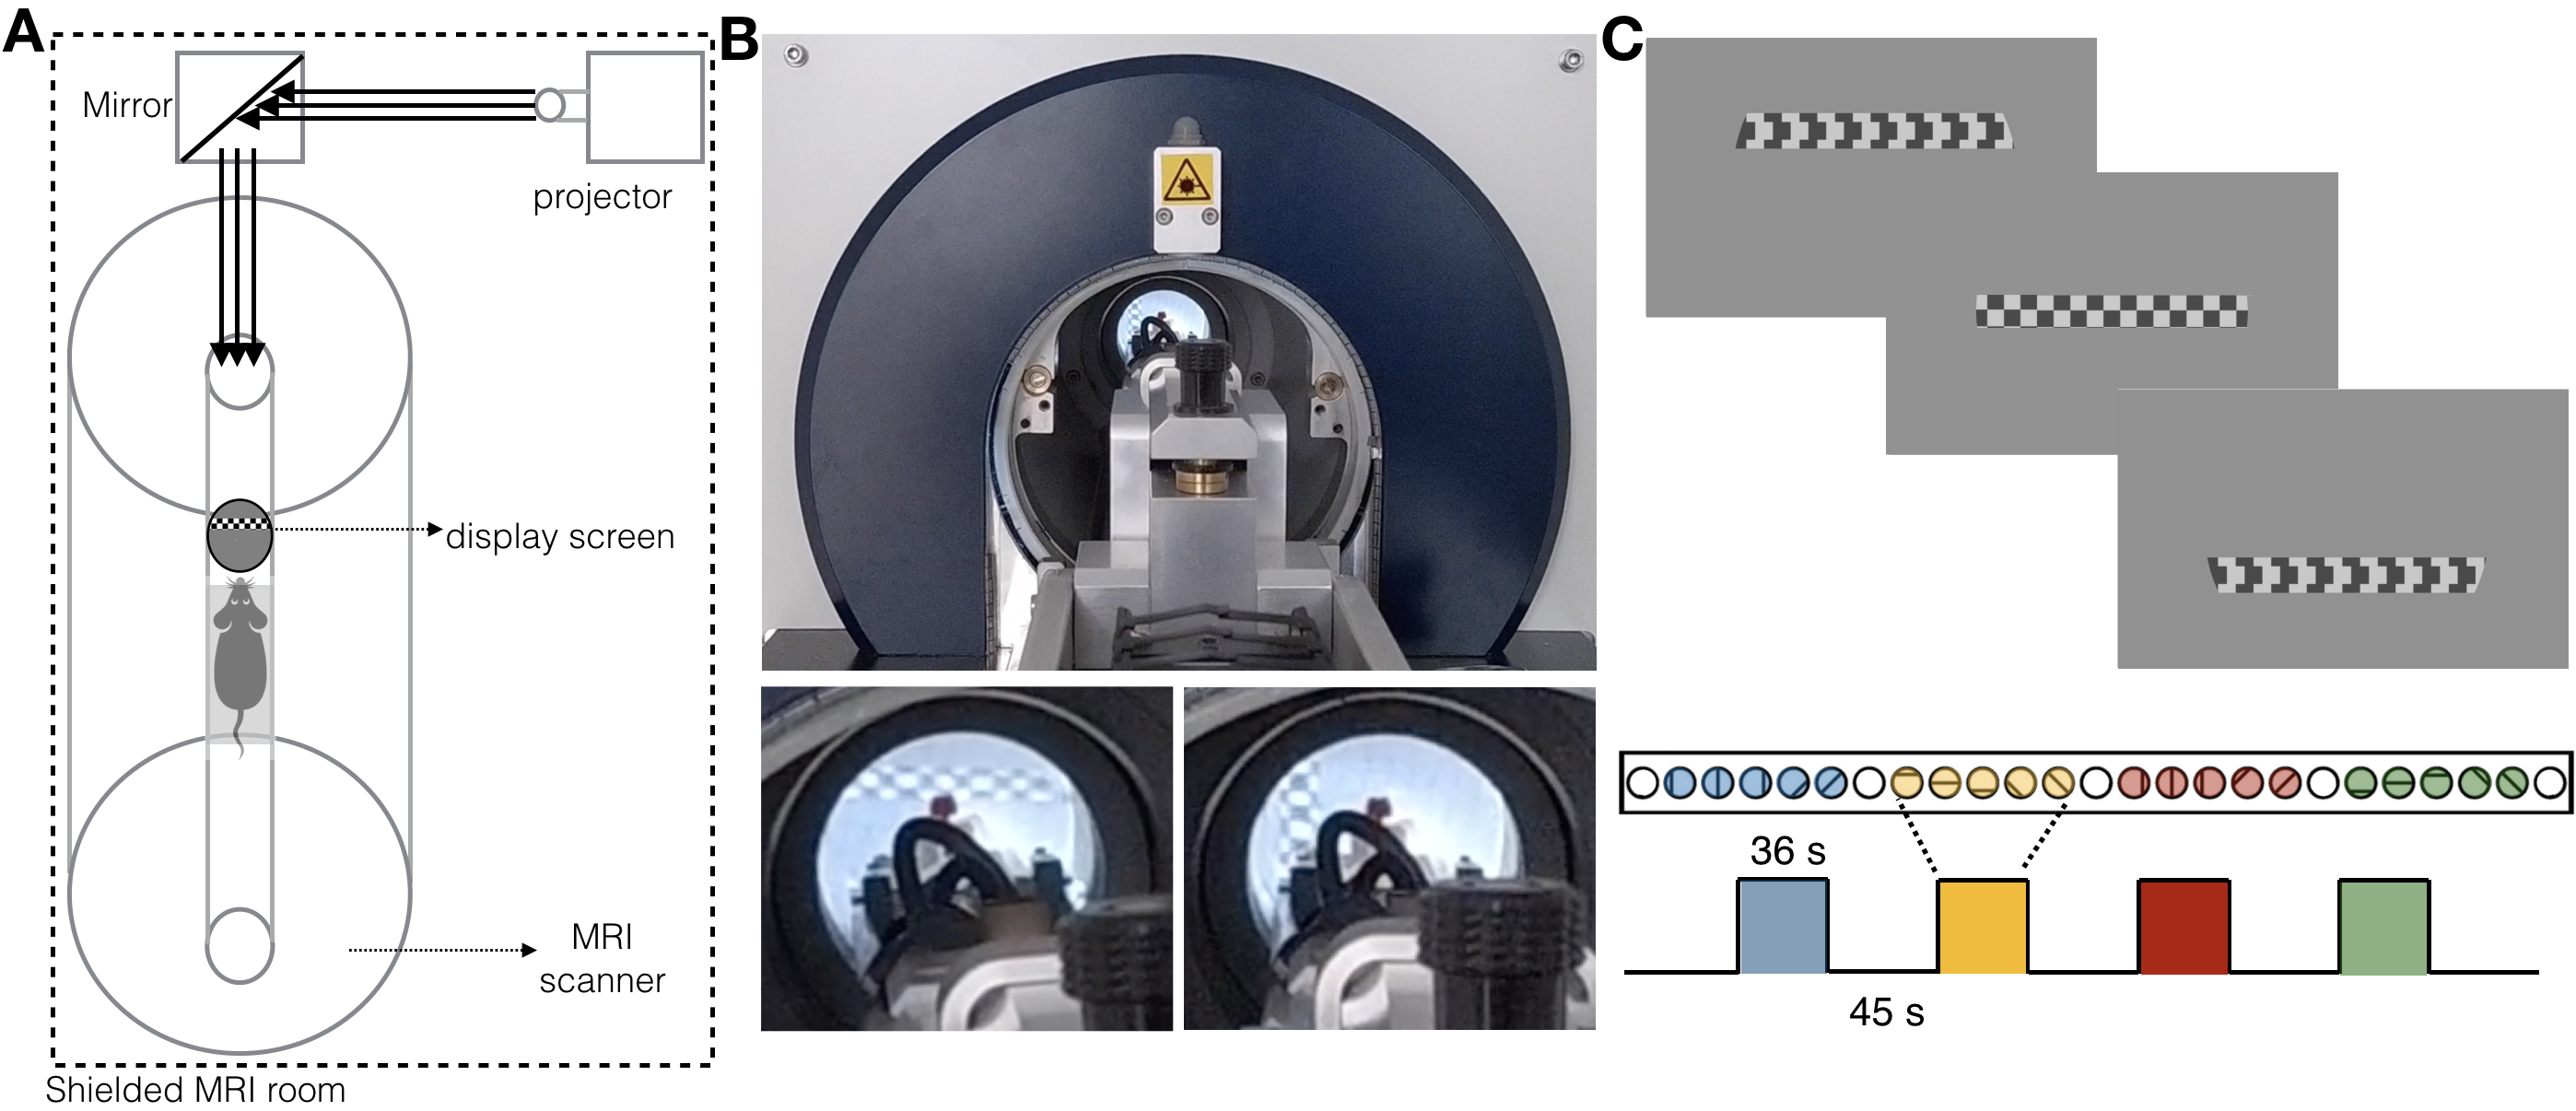
Animal preparation and MRI experiments: All experiments were preapproved by the local animal ethics committee operating under local and EU laws. Six Adult Long Evan rats (4 Females) were sedated using medetomidine 0.05mg/kg bolus and 0.1mg/kg/h infusion. Temperature and respiration rate were continuously monitored and remained stable throughout the sessions. BOLD-fMRI experiments were performed using a 9.4T BioSpec scanner (Bruker, Karlsruhe, Germany) equipped with an 86mm quadrature resonator for transmittance and a 20mm loop surface coil for multislice gradient-echo echo-planar imaging (GE-EPI) experiments (TE/TR=16.7/1500msec, FOV=20.5x15mm2, resolution=125x125μm2, slice thickness=0.650mm, tacq=7min39sec).Visual stimulus delivery set-up and paradigm: The complex visual stimuli necessary for retinotopic mapping, insofar never achieved in rodent fMRI, is generated outside the scanner and back-projected to a scannerside screen (Figure 1A-B). The visual stimuli consisted of a luminance contrast-inverting checkerboard drifting bar. The bar aperture moved in 8 different directions (4 bar orientations: horizontal, vertical and the two diagonal orientations, with two opposite drift directions for each orientation, Figure 1C). After 1.5 passes (36sec), a blank screen was presented for 45sec. Each run was repeated 4-6 times per animal. A single retinotopic mapping run consisted of 246 functional images (60 pre-scan images were deliberately discarded due to coil heating).
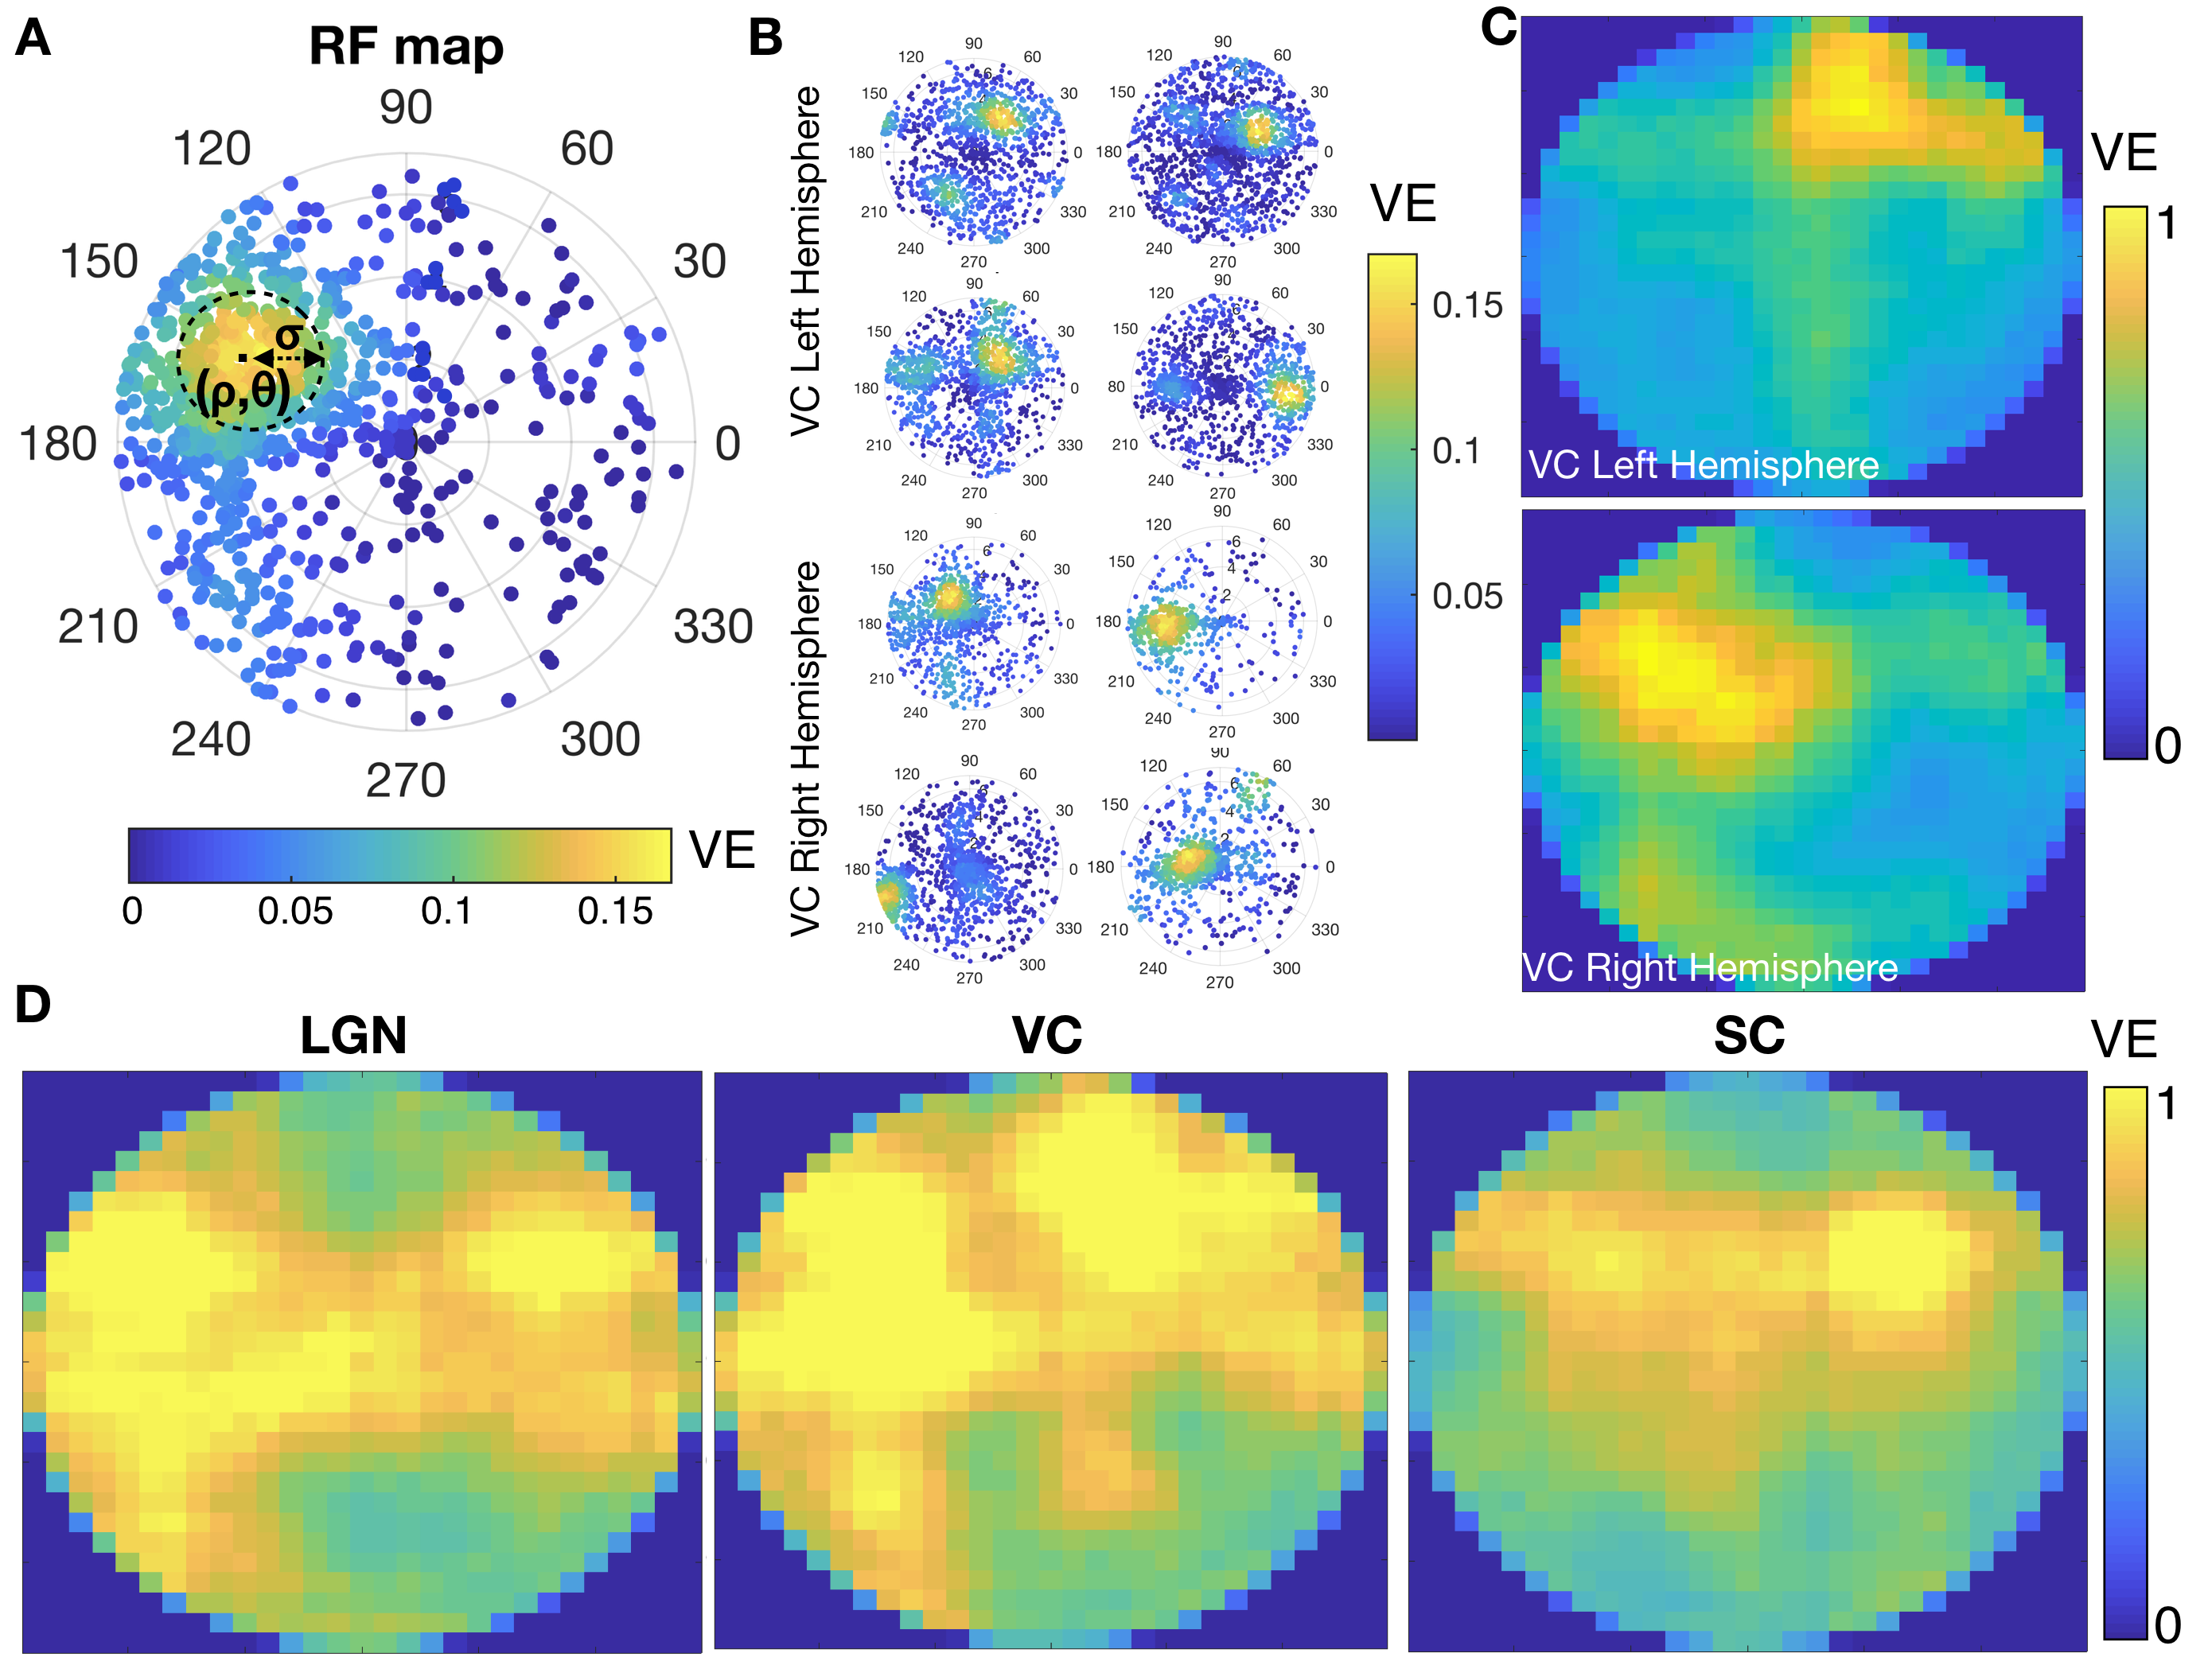
Data analysis and RF estimation: Images were slice-timing and motion corrected, coregistered and normalized to an atlas and spatially smoothed (FWHM=0.15mm2) using a home-written Python pipeline. Region of interest (ROIs) were defined according to the SIGMA atlas8. The voxel’s time-series were drift corrected and temporally smoothed (Savitzky-Golay filter with polynomial order of 3 and window size of 5). The average cycle was calculated by averaging all stimulation epochs. The population RF characterization was performed using two independent methods, micro-probing9 and population RF analysis1. In short, a 2D-Gaussian model of an RF was fitted for: center (ρ,θ) and size (σ - Gaussian-width) parameters in each voxel (Figure 3A).
Results
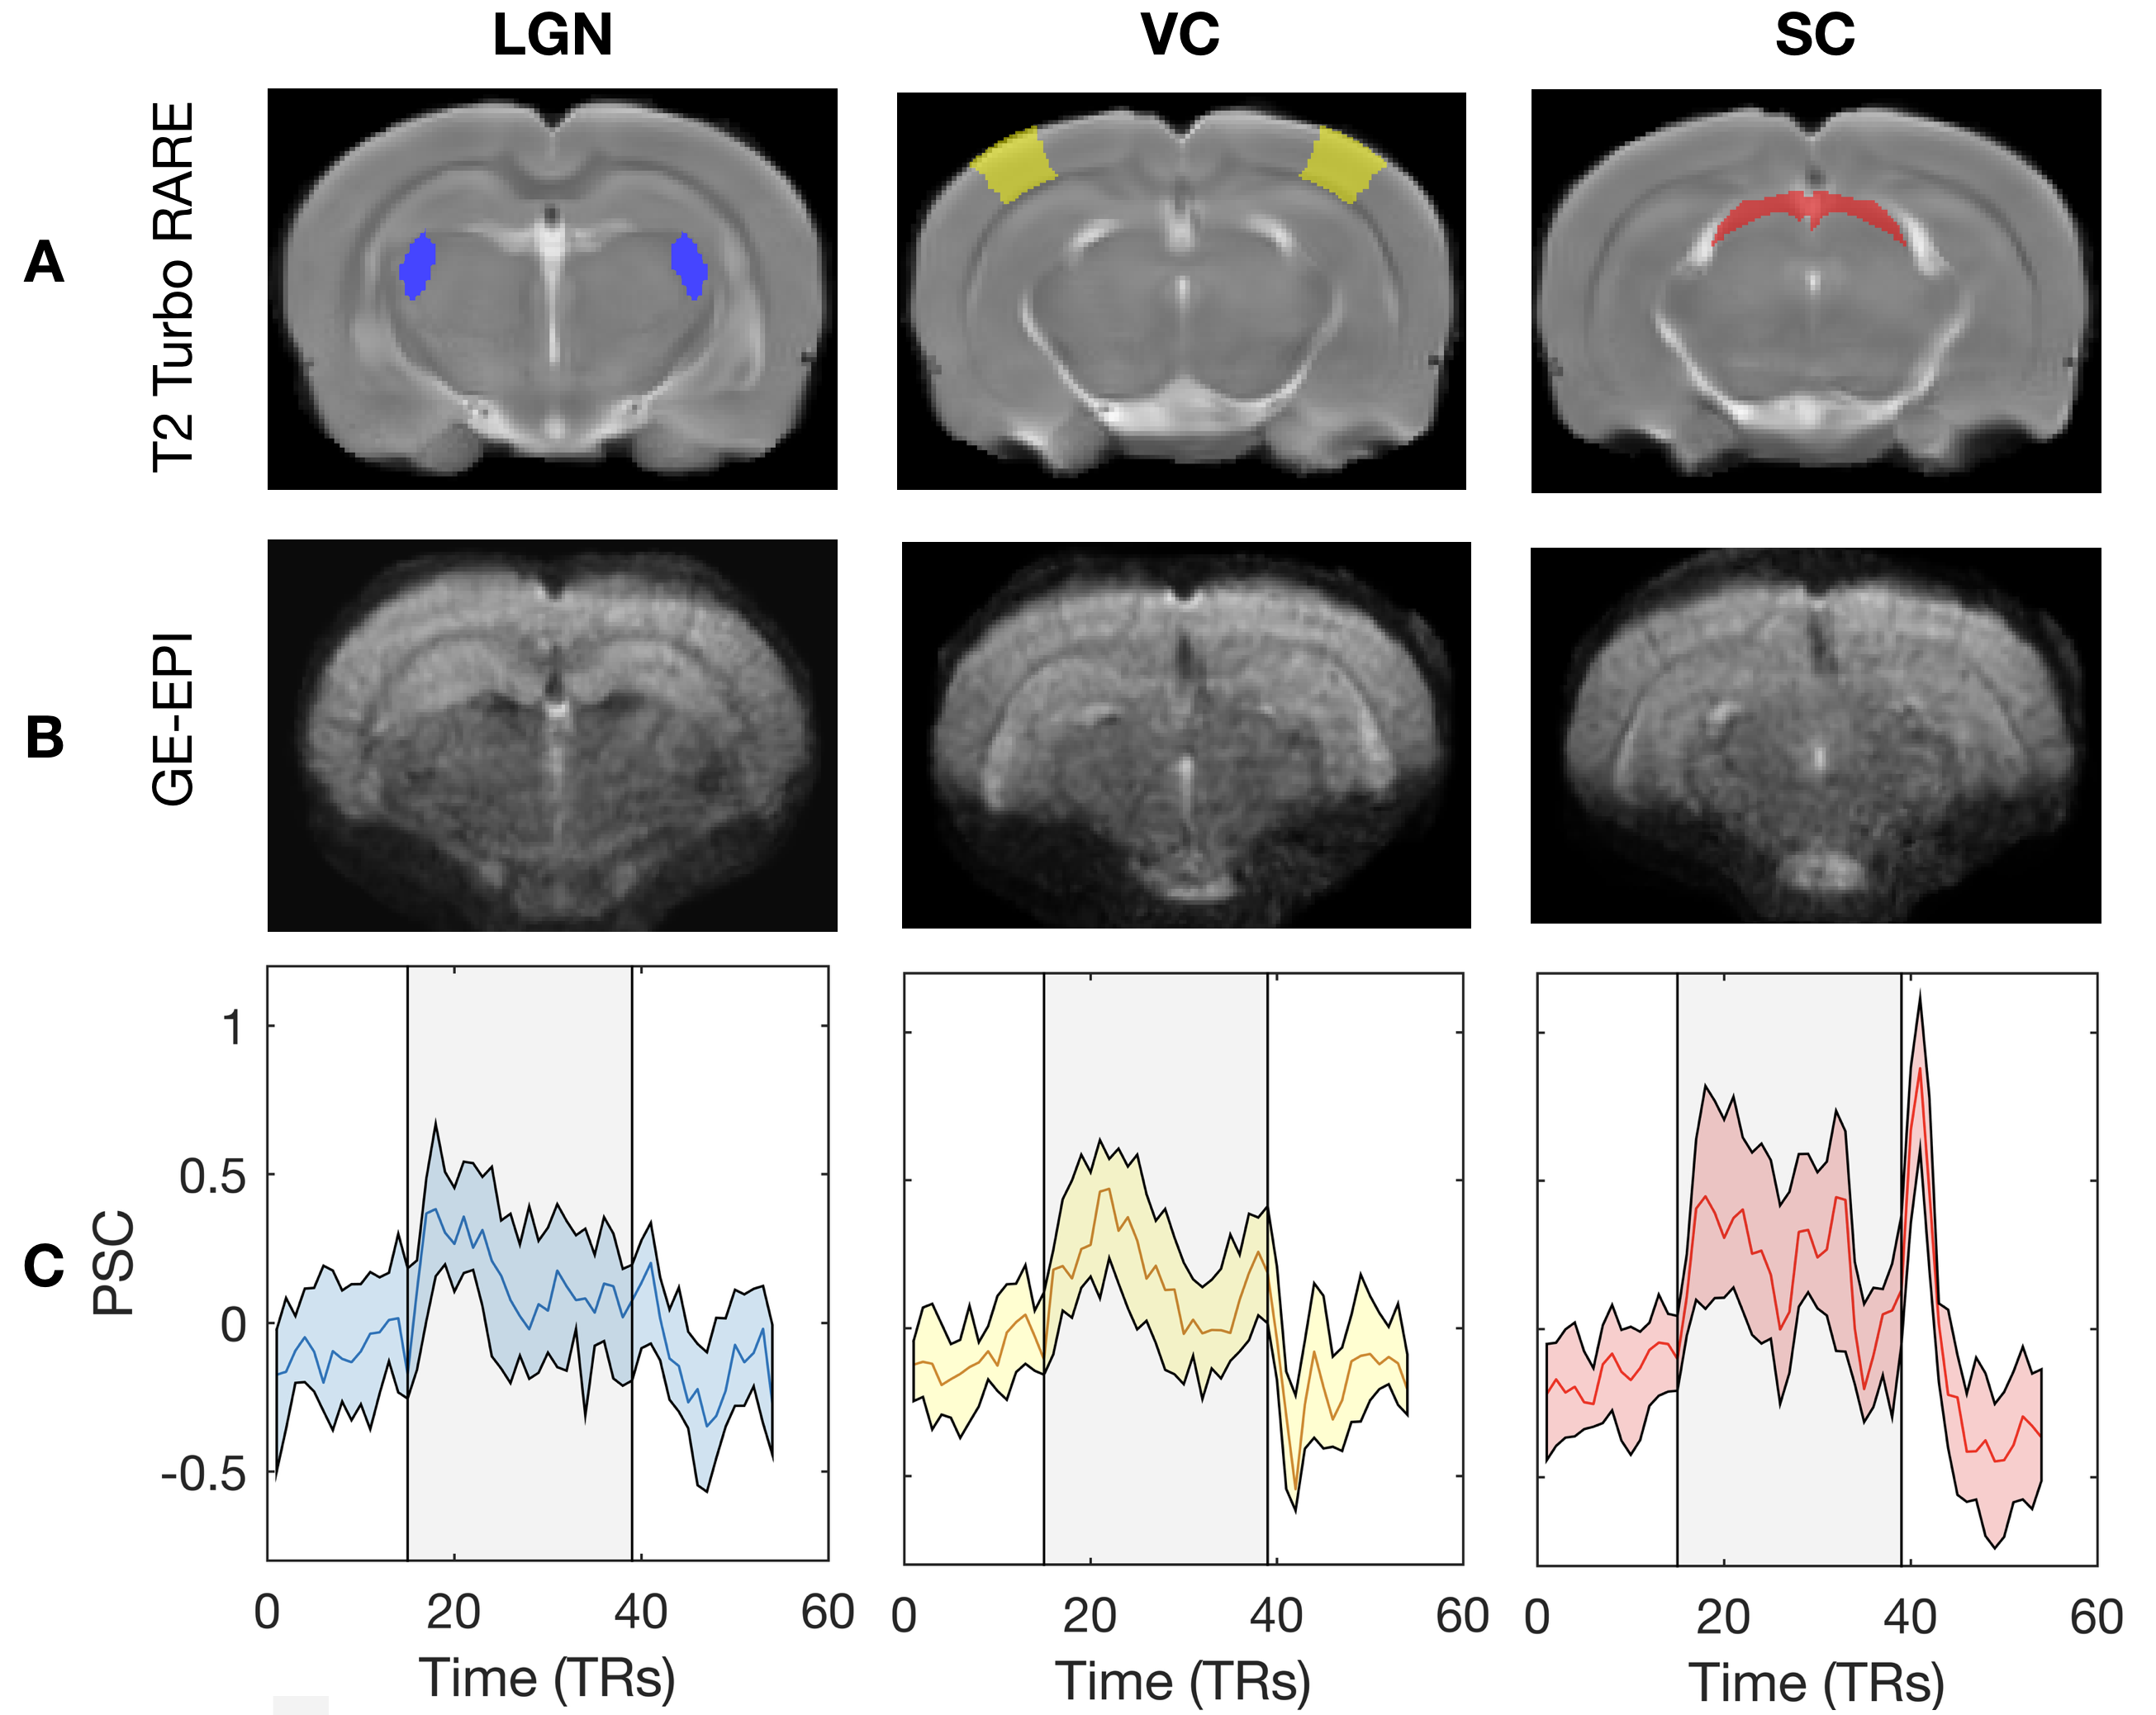
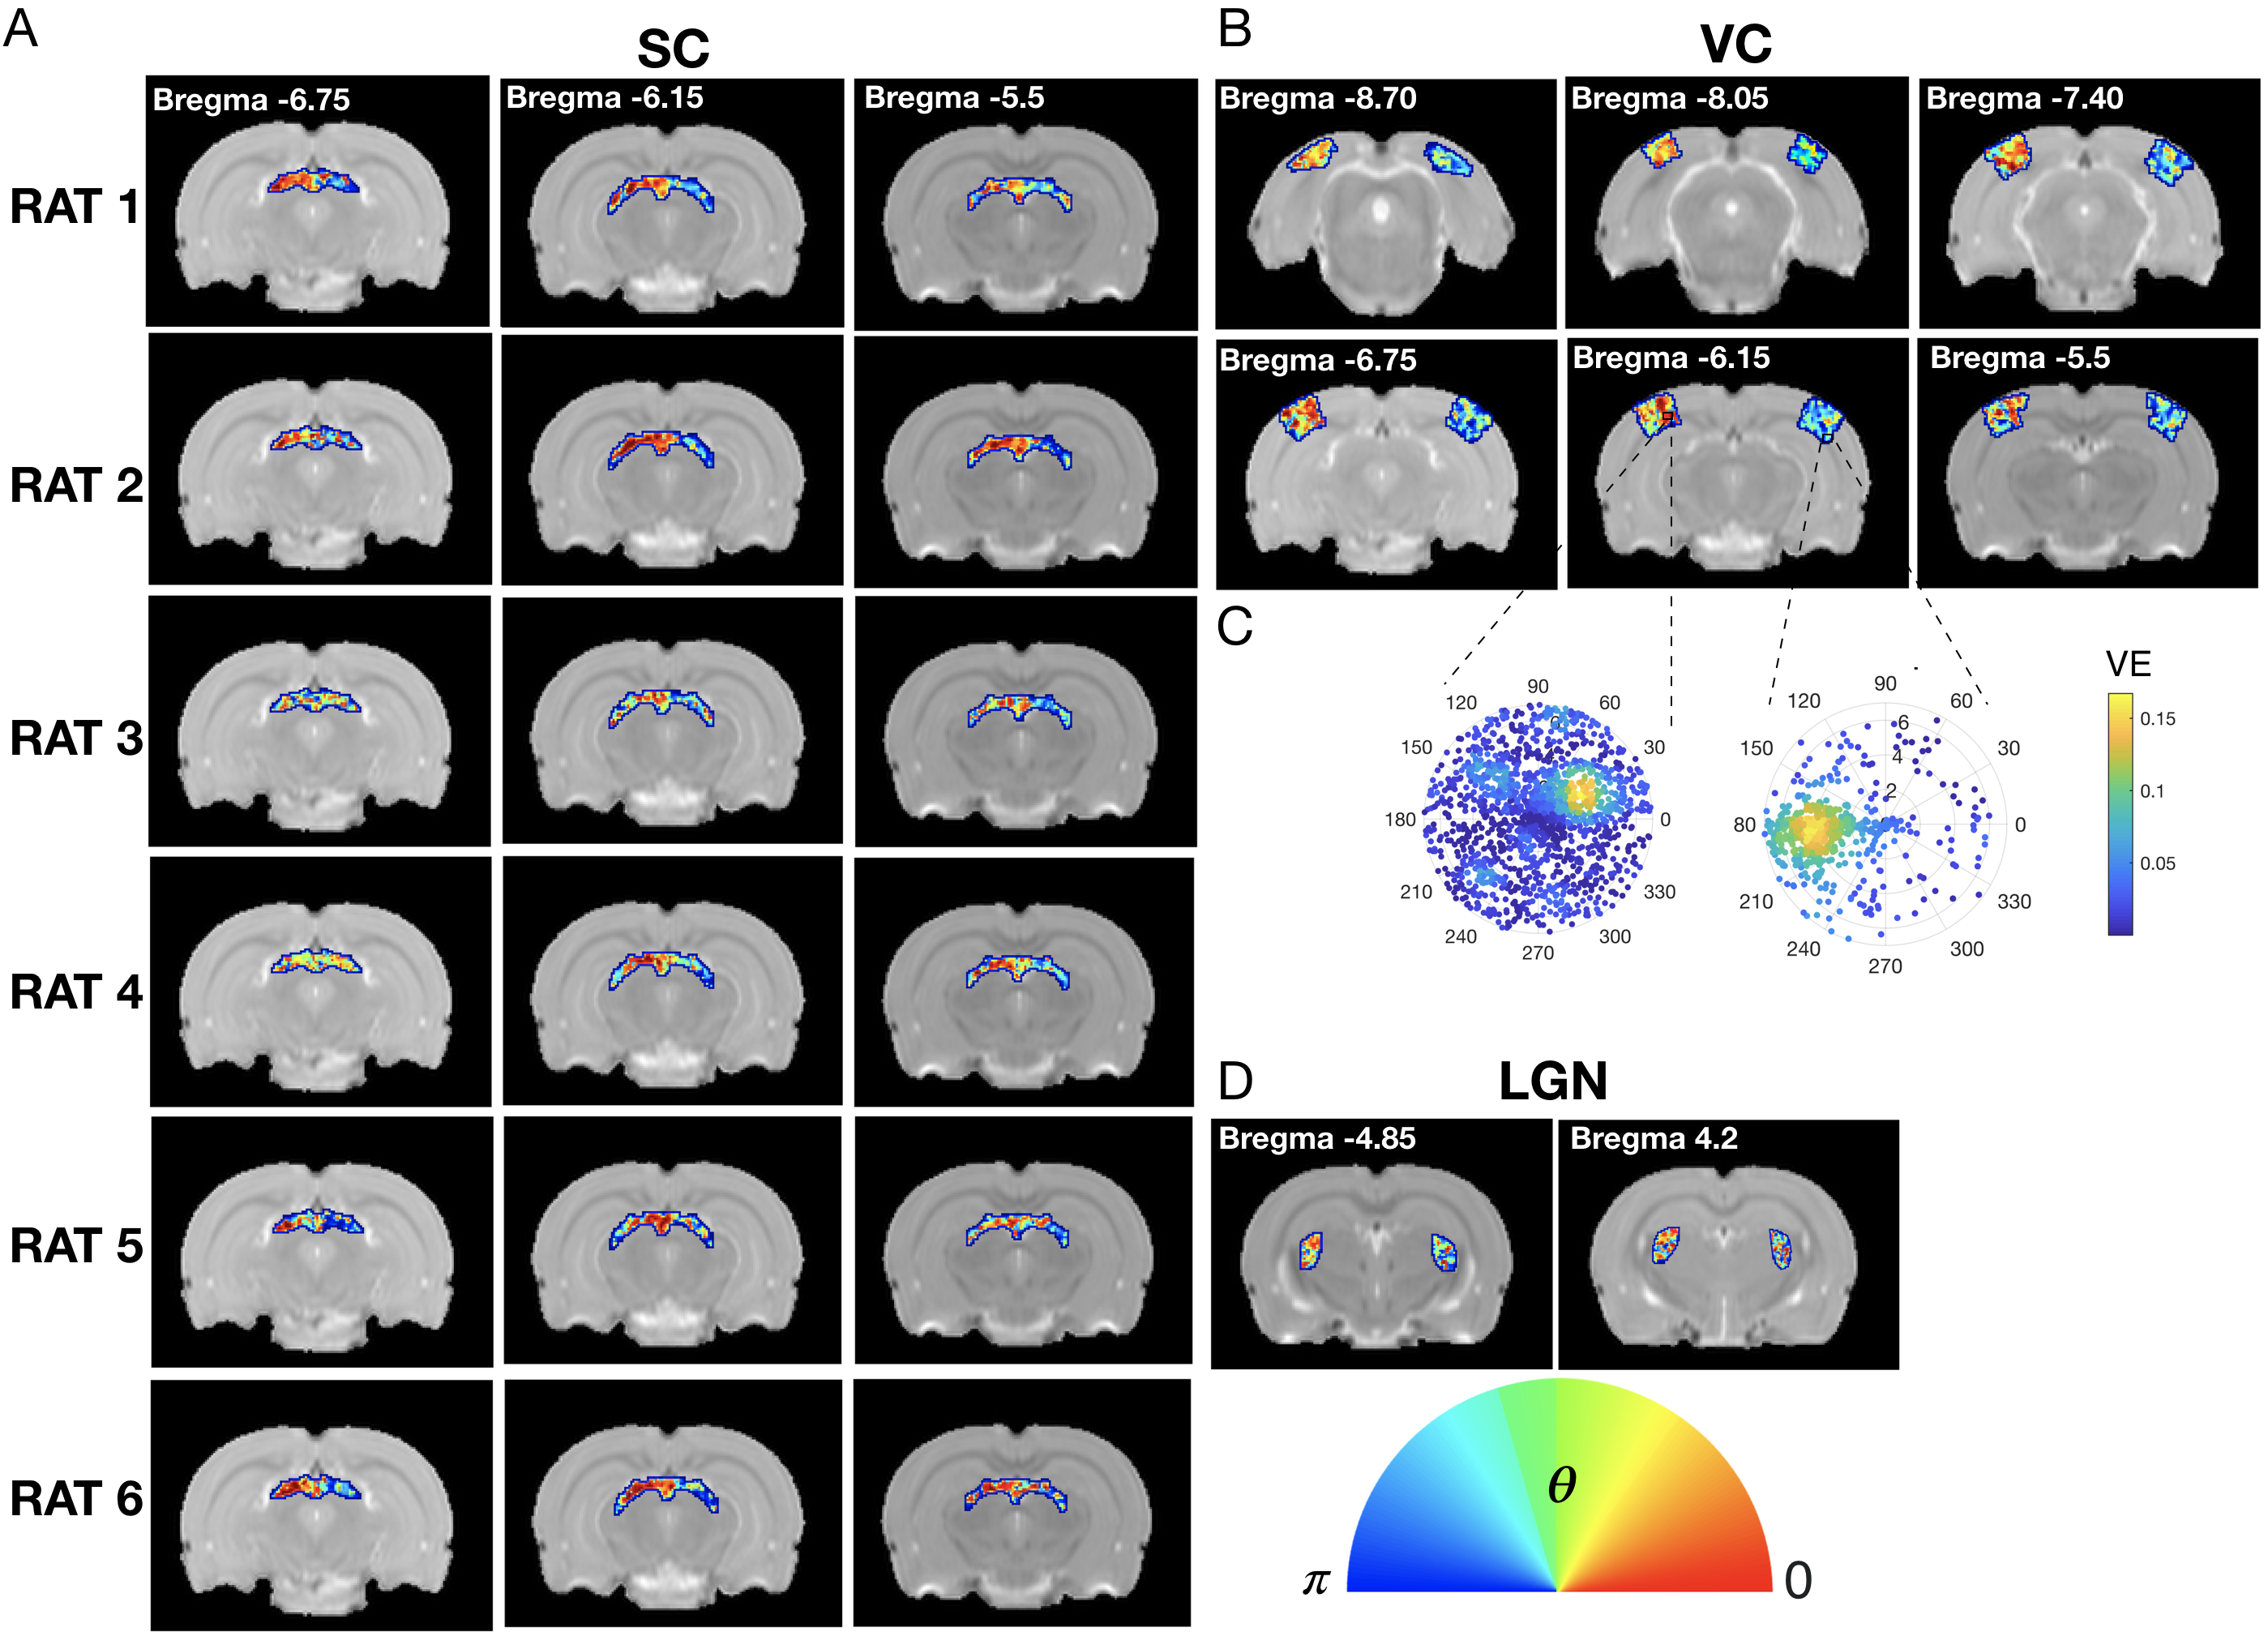
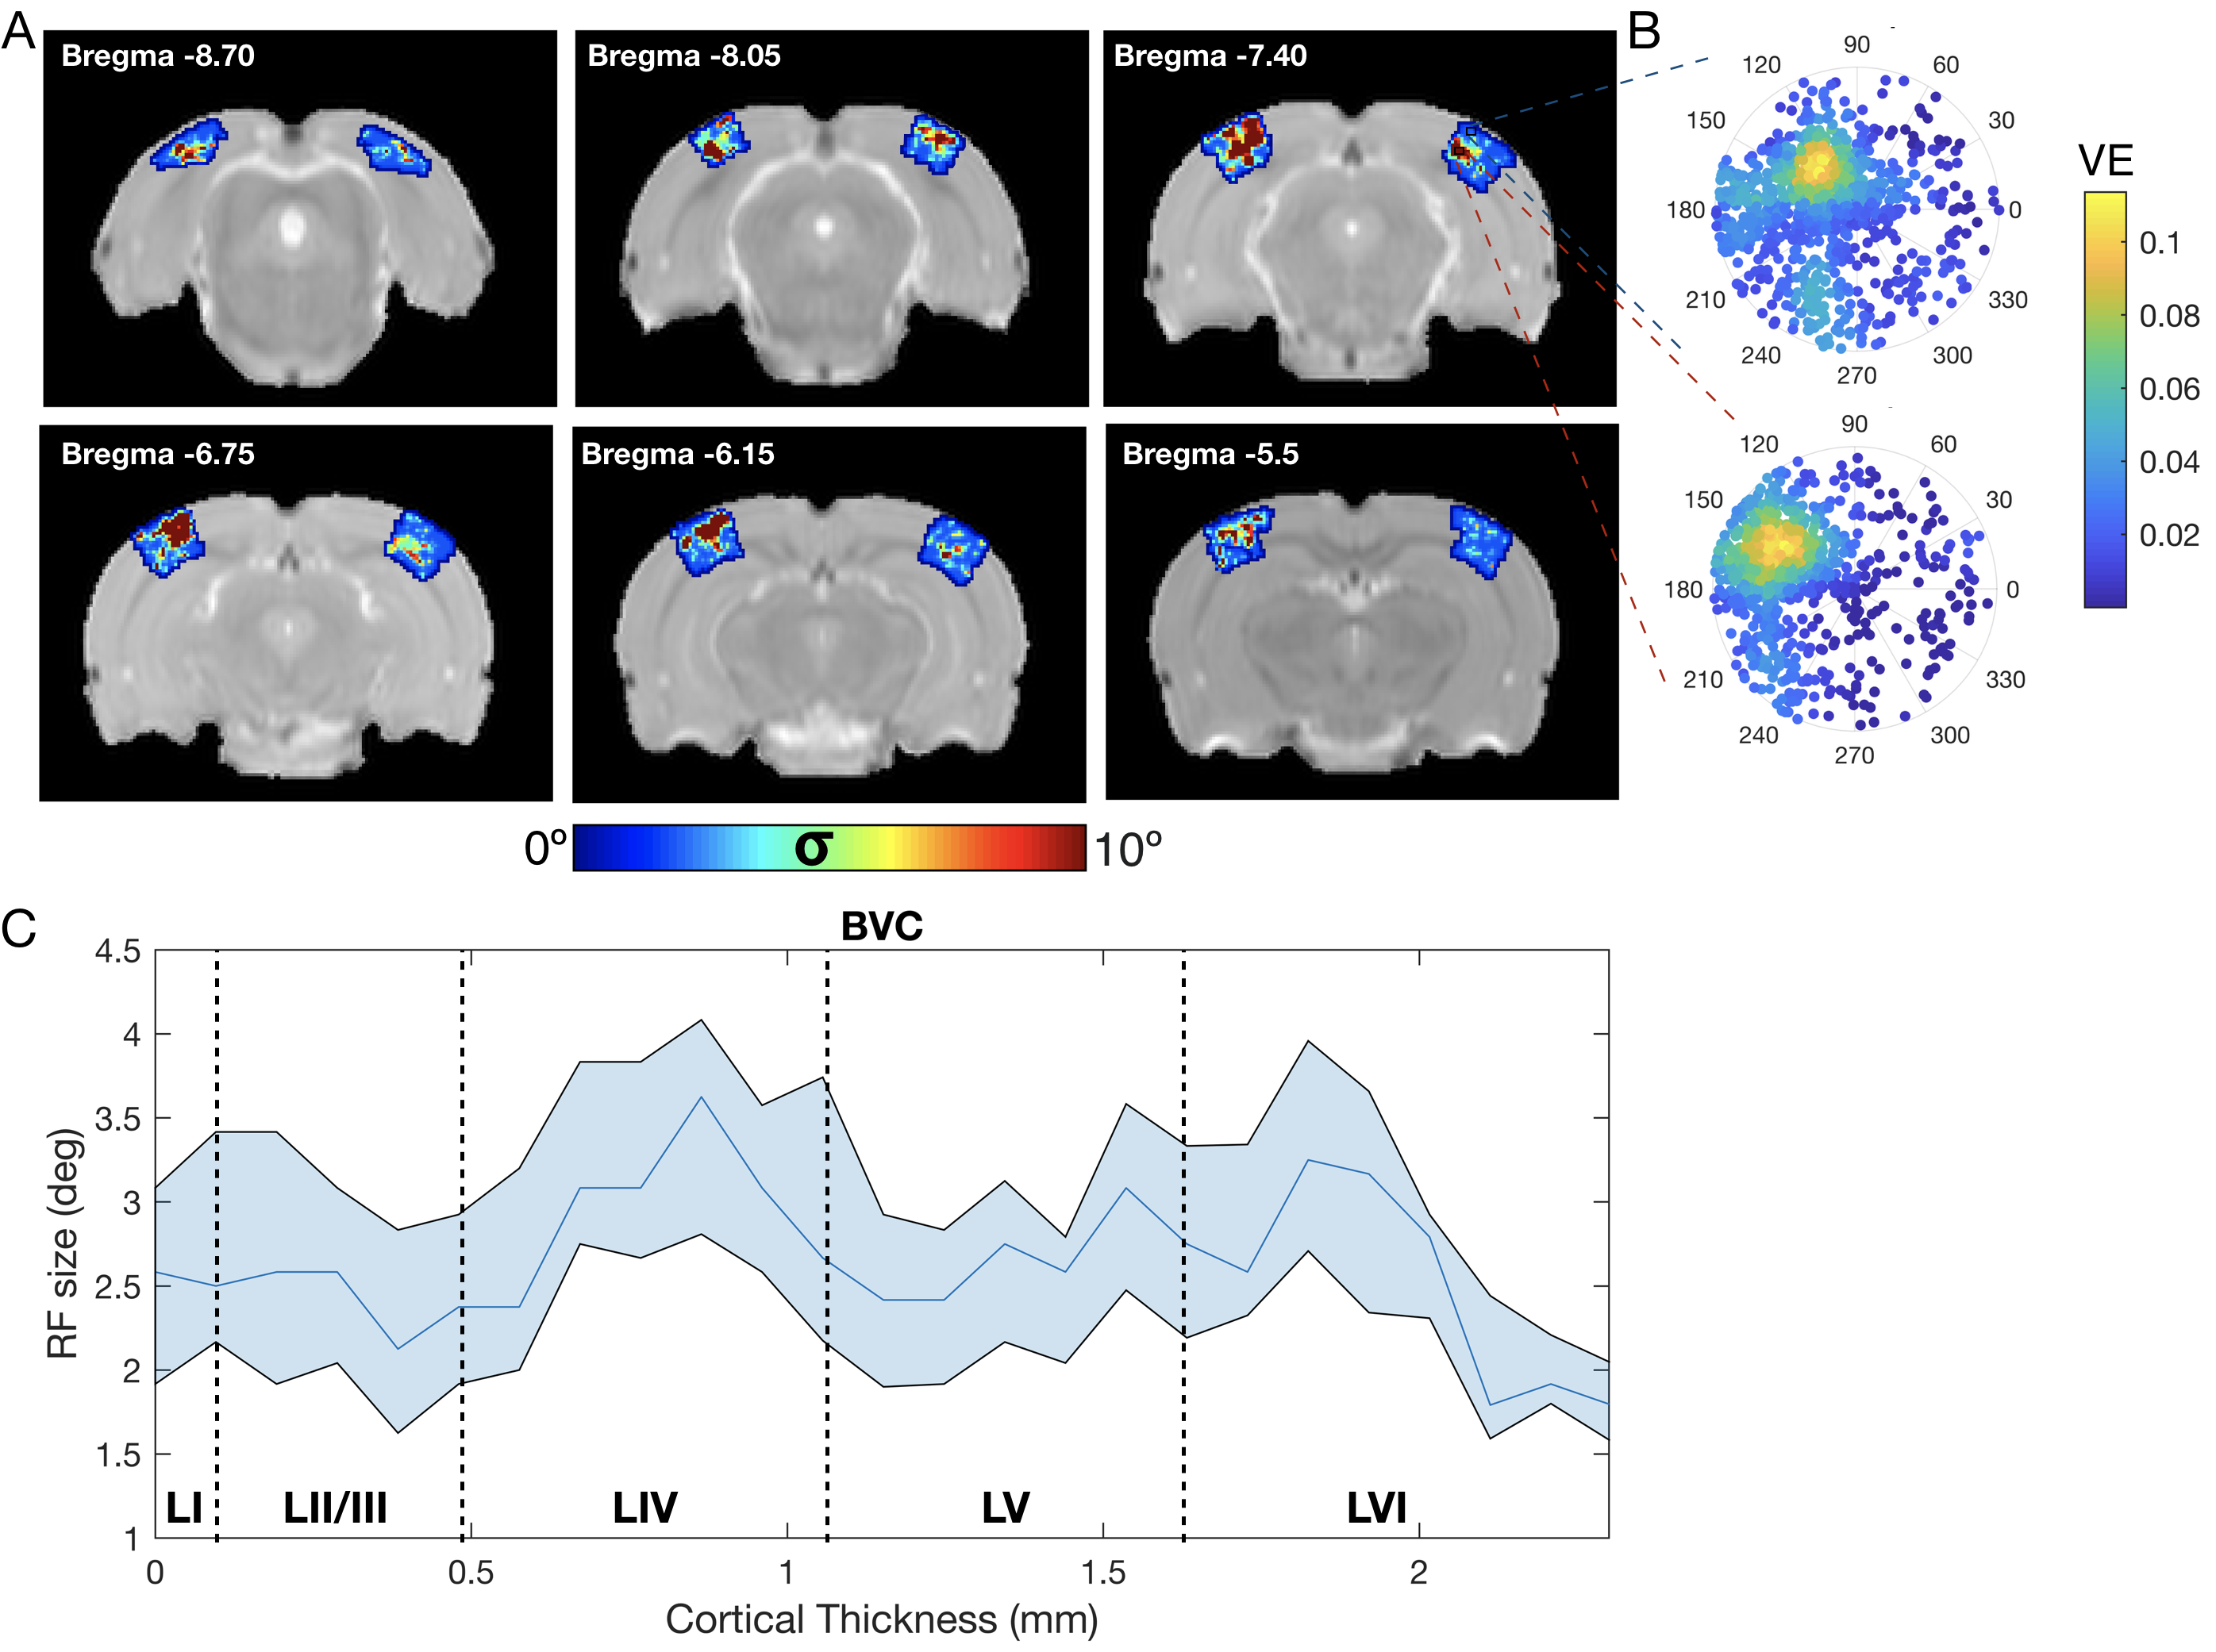
The complex visual stimulus robustly elicited BOLD responses throughout the visual pathway, i.e. LGN, VC and SC (Figure 2). Figure 3A and 3B show the calculated RF maps depicting the RF profile of the neuronal population measured within single voxels. By aggregating the RFs across the voxels in an entire ROI, we obtain the visual field representation for that ROI (Figure 3C-D). Since the stimulus was displayed across the entire scanner bore and given that the animal bed covered the lower visual field (therefore masking the stimulus), only the superior visual field can be captured. Figure 4 shows the retinotopic (phase) maps across multiple ROIs (LGN, VC and SC) and animals. For all the ROIs studied, neighboring voxels responded to adjacent positions in the visual field, therefore evidencing retinotopic organization. Note that the visual information is crossed at the optic chiasm. In VC and SC the phase variation occurs along all cortical layers and it does not vary significantly across cortical depth. LGN presented somewhat noisier retinotopic maps (Figure 4C). Regarding the population RF size, in the VC, in contrast with the phase, the RF size changes across cortical layers and it is constant within layers (Figure 5A-B). In particular, layers IV and VI show the largest RF sizes across the cortical depth (Figure 5C).Discussion
Our main findings reveal that the rat visual system is retinotopically organized and that the VC RF size varies with cortical depth. To the best of our knowledge, this is the first-time that: (1) fMRI-based retinotopic mapping of the rat visual pathway has been performed and (2) such high-resolution (150x150μm) population RFs have been mapped. The population RF sizes are largest at layers IV and VI, however, electrophysiological studies in cats and human fMRI report the smallest RF sizes in layer IV and the largest at layer VI10,11. These dissimilarities may be attributed to the fundamental differences in the visual systems of cats/humans and rodents12; nevertheless the variation of the RF across cortical layers is linked to the flow of signals across the cortical architecture10. The interplay between RF size and feedback/feedforward signals will be further studied in the future.Conclusion
This first-of-its-kind detailed characterization of the population RF structure and visual maps in rodents is essential to: 1) decode signal dynamics in the cortical architecture, 2) decipher driving forces behind plasticity and 3) bridge the gap between neurophysiology and MRI-neuroimaging.Acknowledgements
This study was supported by funding from the European Research Council (ERC) under the European Union’s Horizon 2020 research and innovation programme (Starting Grant, agreement No. 679058).References
1. Dumoulin, S. O. & Wandell, B. A. Population receptive field estimates in human visual cortex. NeuroImage vol. 39 647–660 (2008).
2. Engel, S. A., Glover, G. H. & Wandell, B. A. Retinotopic organization in human visual cortex and the spatial precision of functional MRI. Cereb. Cortex 7, 181–192 (1997).
3. Wandell, B. A. & Winawer, J. Imaging retinotopic maps in the human brain. Vision Research vol. 51 718–737 (2011).
4. Zhuang, J. et al. An extended retinotopic map of mouse cortex. Elife 6, (2017).
5. Gias, C. et al. Retinotopy within rat primary visual cortex using optical imaging. Neuroimage 24, 200–206 (2005).
6. Girman, S. V., Sauvé, Y. & Lund, R. D. Receptive field properties of single neurons in rat primary visual cortex. J. Neurophysiol. 82, 301–311 (1999).
7. Suresh, V. et al. Synaptic Contributions to Receptive Field Structure and Response Properties in the Rodent Lateral Geniculate Nucleus of the Thalamus. J. Neurosci. 36, 10949–10963 (2016).
8. Barrière, D. A. et al. The SIGMA rat brain templates and atlases for multimodal MRI data analysis and visualization. Nat. Commun. 10, 5699 (2019).
9. Carvalho, J. et al. Micro-probing enables fine-grained mapping of neuronal populations using fMRI. Neuroimage 209, 116423 (2020).
10. Fracasso, A., Petridou, N. & Dumoulin, S. O. Systematic variation of population receptive field properties across cortical depth in human visual cortex. Neuroimage 139, 427–438 (2016).
11. Gilbert, C. D. Laminar differences in receptive field properties of cells in cat primary visual cortex. J. Physiol. 268, 391–421 (1977).
12. Laramée, M.-E. & Boire, D. Visual cortical areas of the mouse: comparison of parcellation and network structure with primates. Front. Neural Circuits 8, 149 (2014).
Figures