2926
Light sedation with short habituation time for large-scale fMRI studies in rat1A.I.V. Institute for Molecular Sciences, University of Eastern Finland, Kuopio, Finland
Synopsis
As anesthesia is a serious confounding factor in pre-clinical fMRI, there is increasing interest in awake fMRI. However, awake protocols tend to be time-consuming and laborious, making large studies unfeasible. Therefore, we investigated whether a light sedation protocol with a short habituation period can provide comparable data to fully awake protocol. We measured 102 rats under light sedation and compared the FC to both on-site measured awake data and open awake rat fMRI database. Our results show, that apart from slightly modified thalamic connectivity, light sedation provides results that are comparable to the data obtained in the awake state.
Introduction
Functional magnetic imaging (fMRI) is an effective non-invasive tool for studying functional connectivity (FC) of the brain1. There is an increased interest in preclinical FC studies due to, e.g., readily available disease models. Typically, preclinical FC studies are done in anesthetized animals. However, it has been shown that anesthesia greatly affects the FC2, making awake imaging highly desirable. In contrast, awake protocols tend to be very laborious and time-consuming, which may become impractical especially regarding large-scale studies needed in the search for biomarkers or in preclinical testing of drugs. To tackle this issue, the goal of this study was to show that a light sedation protocol with a short habituation period can provide comparable data to fully awake rats but requiring a lower amount of resources. To demonstrate this, 102 rats were scanned in lightly sedated condition, and data were compared to both on-site awake rat data and to open awake rat fMRI database3.Methods
Animal procedures were approved by the Finnish Animal Experiment Board. 112 Sprague Dawley rats (292±39 g) were habituated and measured either under a light anesthesia (N = 102) or in awake state (N = 10). The habituation was done as described earlier4. Both groups were habituated in a mock scanner for three (light sedated, 0.5% isoflurane) or four (awake, 0% isoflurane) consecutive days with gradually increasing habituation time. fMRI data were acquired with gradient-echo echo-planar imaging sequence (TR = 1 s, 17 slices, slice thickness = 1 mm, matrix = 64 × 64, field of view = 3 × 3 cm2) for 25 minutes (1500 repetitions).The raw fMRI data were converted to NIfTI (http://aedes.uef.fi) and slice-timing corrected (SPM8). Volumes with excessive motion were discarded using a motion scrubbing approach3 with r = 12.5 mm and frame-wise displacement threshold of 0.25 mm. Subsequently, data were motion-corrected (ANTs, http://stnava.github.io/ANTs/), spatially smoothed, and co-registered to a reference brain (SPM8). Independent component analysis (ICA) was performed in each subject, and automatically selected non-neuronal components were regressed out. The first 300 volumes (5 min) were discarded to ensure the same anesthesia state in all animals. For regions of interest (ROIs) analyses, ROIs were drawn on the reference brain according to an anatomical atlas5. Two different sets of ROIs were drawn. First, the 12 ROIs were used to replicate our previous analysis, and 21 ROIs were used to compare our data with the awake rat open database. The mean ROI signals were filtered (0.01-0.1 Hz), and a sliding window (150 volumes) was used to select the motion-free parts of the signal based on the frame-wise displacement. In each measurement, 3-6 windows were selected and the signal from those windows was concatenated. The Pearson correlation of each ROI pair was calculated while the frame-wise displacement was used as a regressor to minimize the influence of non-neural signal in the correlation value. Moreover, the same data analysis pipeline was applied to the open dataset of resting-state fMRI in awake rats3 with the addition of regressing the signal outside of the brain from the data before the bandpass filtering in both the awake rat database and light sedated datasets. Animals in both groups that had an average correlation between the head muscle and the brain regions higher than 0.35 were excluded from the ROI analysis.
Results
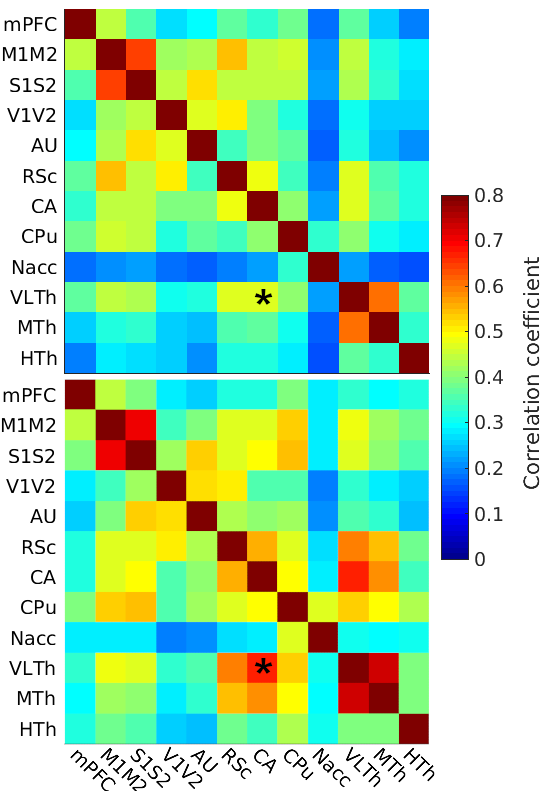
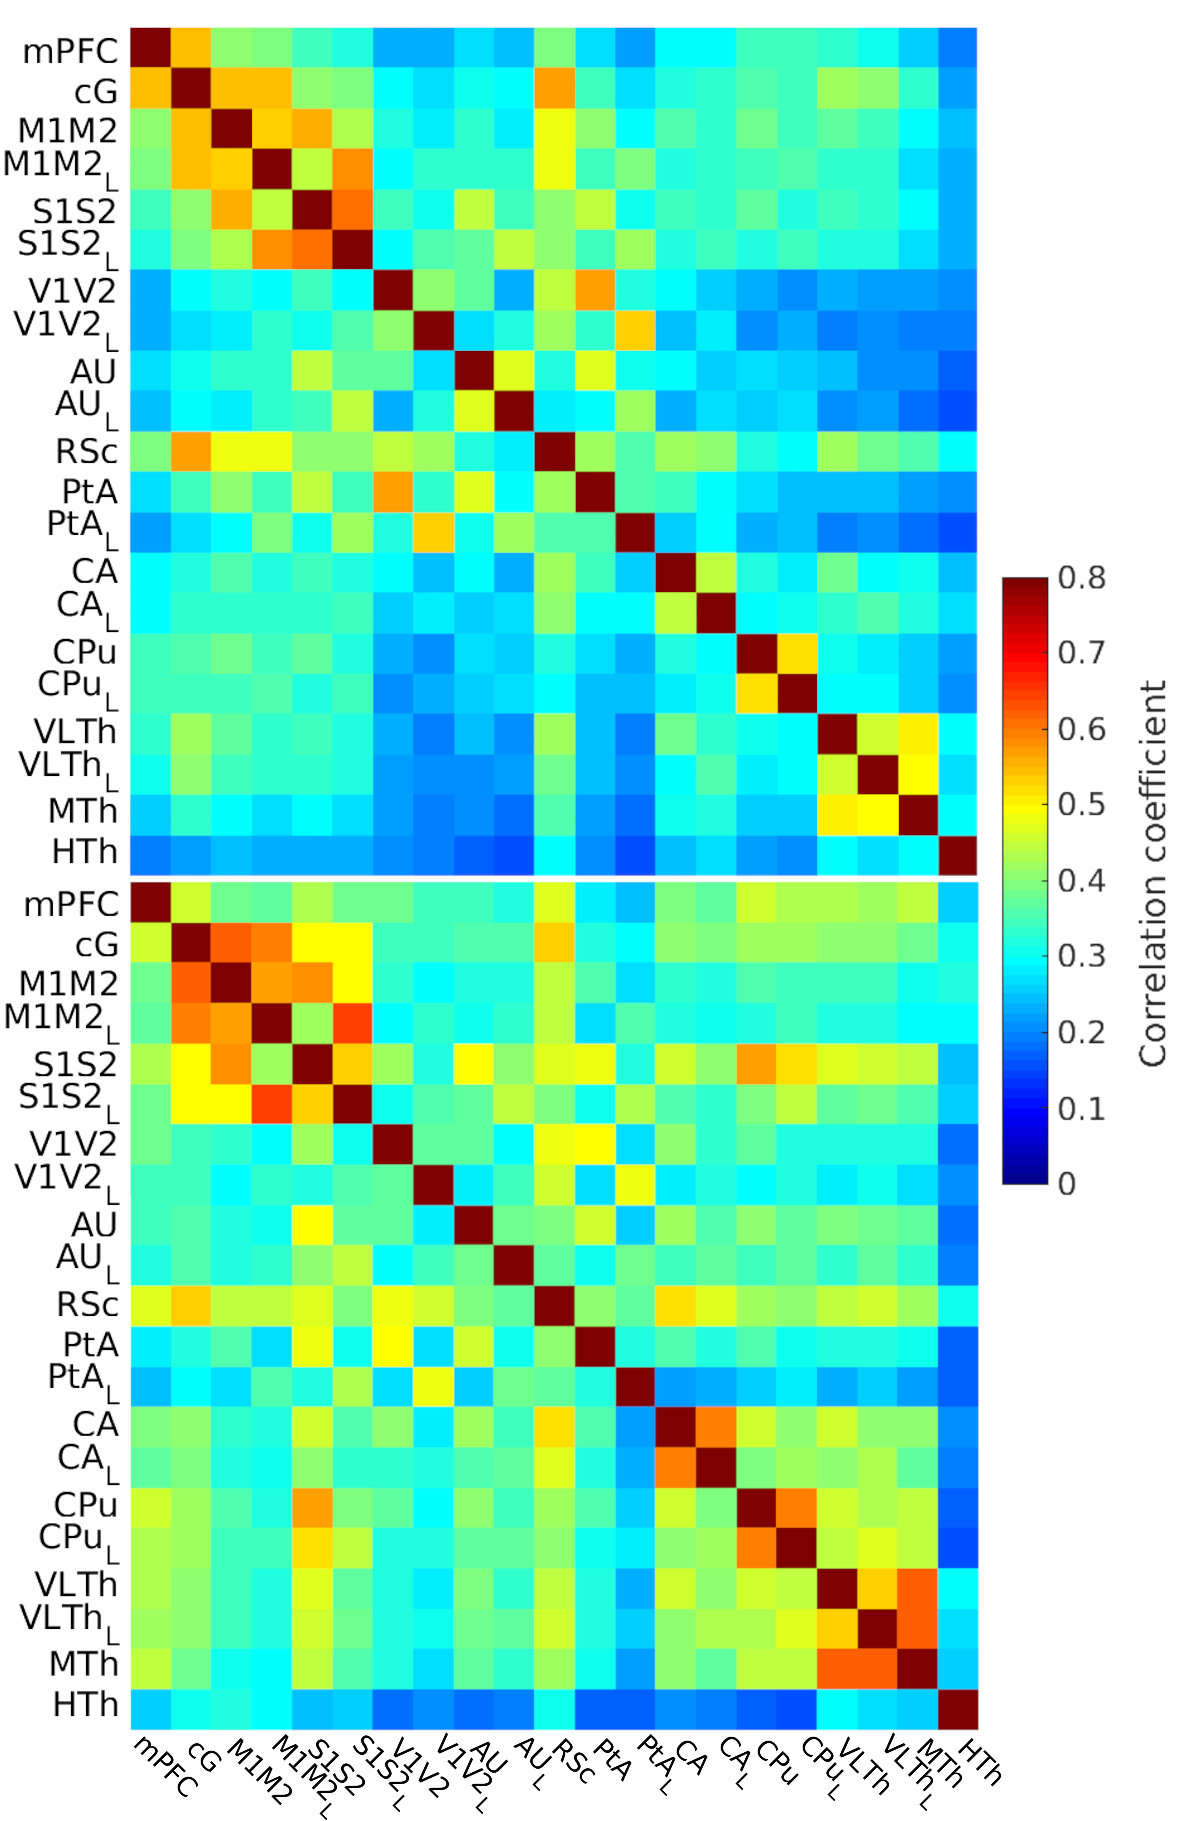
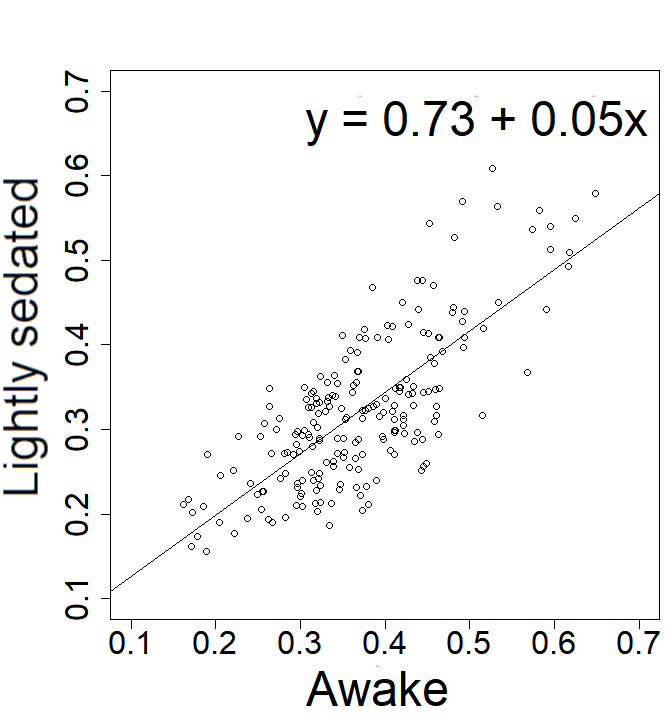
In the on-site measured awake group, the FC pattern was remarkably similar to the lightly sedated animals (Fig 1). Only one ROI pair in the lightly sedated animals had a statistically different correlation value from the awake group.The FC pattern in the lightly sedated group was in most part similar to the one obtained from the awake rat fMRI database (Fig 2). The correlation values in the cortico-cortical pairs were similar, and in both datasets, we observed low correlation values in the hypothalamus. However, thalamo-hippocampal, thalamo-cortical, and cortico-hippocampal correlation values were slightly higher in the awake dataset. Nevertheless, the correlation between the corresponding correlation values in the two datasets was high (R=0.75, p < 0.0001) (Fig 3).
Discussion
Our study provides one of the few large-scale preclinical fMRI datasets and it will be made publicly available after completion of the study. The slightly decreased thalamic connectivity in the lightly sedated group when compared to the awake group is in agreement with our previous findings4. Similarity of the functional connectivity obtained in awake and slightly sedated conditions indicates that light sedation with a short habituation protocol can provide a good alternative approach for large scale fMRI studies.Conclusion
This study shows that the protocol with light sedation provides robust results, which are comparable with the awake state imaging, apart from slightly modified thalamic connectivity. Thus, less time-consuming habituation can save hundreds of training days in large-scale preclinical studies, yet still providing a robust readout for FC.Acknowledgements
We would like to thank Dr. Jussi Tohka for the advice on the statistical analysis.
This project is co-funded by the Horizon 2020 Framework Programme of the European Union (Marie Skłodowska Curie grant agreement No 740264) and the Academy of Finland.
References
- Biswal, B., Zerrin Yetkin, F., Haughton, V. M., and Hyde, J. S. Functional connectivity in the motor cortex of resting human brain using echo-planar MRI. Magnetic Resonance in Medicine. 1995, 34(4), 537–541. https://doi.org/10.1002/mrm.1910340409.
- Paasonen, J., Stenroos, P., Salo, R. A., Kiviniemi, V., and Gröhn, O. Functional connectivity under six anesthesia protocols and the awake condition in rat brain. NeuroImage. 2018, 172, 9–20. https://doi.org/10.1016/j.neuroimage.2018.01.014.
- Liu, Y., Perez, P. D., Ma, Z., Ma, Z., Dopfel, D., Cramer, S., Tu, W., and Zhang, N. An open database of resting-state fMRI in awake rats. NeuroImage. 2020, 220, 117094. https://doi.org/10.1016/j.neuroimage.2020.117094
- Stenroos, P., Paasonen, J., Salo, R. A., Jokivarsi, K., Shatillo, A., Tanila, H., and Gröhn, O. Awake Rat Brain Functional Magnetic Resonance Imaging Using Standard Radio Frequency Coils and a 3D Printed Restraint Kit. Frontiers in Neuroscience. 2018, 12, 548. https://doi.org/10.3389/fnins.2018.00548.
- Paxinos, G., and Watson, C., The Rat Brain in Stereotaxic Coordinates (4th ed.), San Diego: CA: Academic Press, 1998.
Figures