2923
Dynamic Functional Connectivity of Focused Ultrasound-induced Neuromodulation in Normal Rat Model1Biomedical Engineering and Environmental Sciences, National Tsing Hua University, Hsinchu, Taiwan, 2Electrical Engineering, National Taiwan University, Taipei, Taiwan
Synopsis
Non-invasive focused ultrasound (FUS) offered attractive advantages to modulate neuronal activity. The functional connectivity (FC) between different brain regions is a dynamic process during a period of examinations. We aim to explore FUS-induced neuromodulation by dynamic FC. We observed the evolution of dynamic FC at Pre-FUS, FUS-35min, and FUS-3hr for normal rats with FUS sonication at ventral posteromedial and ventral posterolateral thalamic nuclei (VPM/VPL) region in left thalamus. With K-means clustering, we quantitatively evaluated the evolution of altered probability% of dynamic FC in seven states at Pre-FUS, FUS-35min, and FUS-3hr, suggesting the potential of FUS-neuromodulation.
Introduction
Several invasive and non-invasive methods of neuromodulation have been used in clinical or under preclinical trials1-3. Focused ultrasound (FUS)-induced neuromodulation offered attractive advantages of noninvasiveness, depth penetration, high spatial precision, and ability to modulate neuronal activity4,5. Low-intensity FUS-stimulation was proposed to present mechanical displacements on targeting region, where the membrane stretching and consequently opening of specific ion channels jointly resulted in the changes of nerve activity6,7.The functional connectivity (FC) in focused areas as well as distant off-targeting regions was reported to be affected by FUS-neuromodulation in human models by using functional MRI8. Beside, FUS-neuromodulation has been observed by static FC with phase synchrony and correlation coefficient9. A previous study showed evident fluctuations in FC, implying that the functional connectivity between different brain regions is a dynamic process during a period of examinations10. Compared to healthy volunteers, abnormal dynamic FC was reported in psychotic disorder patients11-13.
To date, studies of dynamic FC for FUS-neuromodulation were still deficient. The purpose of this study was to explore FUS-induced neuromodulation by dynamic FC.
Methods
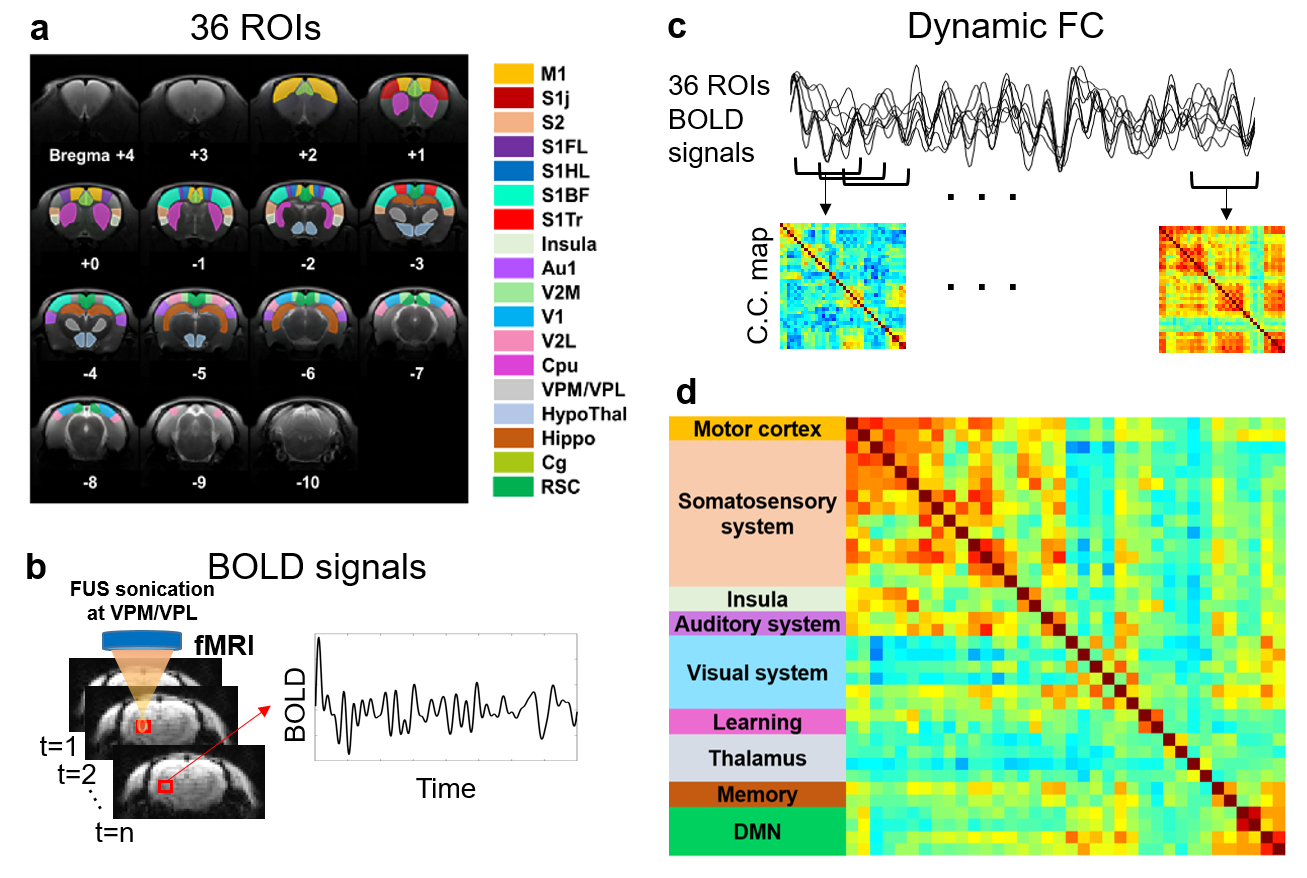
In this study, 21 adult male Sprague-Dawley rats (300-420 g) were recruited and divided to three groups: rats without FUS stimulation (Pre-FUS group), rats with acquisition of MRI after 35-min and 3-hr of FUS stimulation (FUS-35min and FUS-3hr group), respectively. A single-element transducer (RK300, FUS instrument) delivered FUS pulses in a burst mode with pulse repetition frequency=100 Hz, spatial peak negative pressure amplitude=0.25 MI, duty cycle=30% to ventral posteromedial and ventral posterolateral thalamic nuclei (VPM/VPL) region in left thalamus. The stimulation paradigm was 30–sec on and 90-sec off for 5 cycles, totally 600 seconds.All MRI images were acquired in a 7-Tesla MR scanner (ClinScan, Bruker). An EPI sequence for functional signals was performed in a coronal view with TE/TR=20/1000 ms, FOV=30×30 mm2, matrix size=64×64, and slice thickness=1 mm.
Figure 1 illustrates the flow chart of computing correlation coefficients of FC maps. The 36 ROIs in rat brain were selected according to the previous study14. The BOLD signals underwent preprocessing steps of realignment, coregistration, slice timing correction, smoothing with a Gaussian kernel (FWHM=8 mm), detrend, and bandpass frequency filtering (range=0.01 to 0.08 Hz) by using SPM12 software. To generate dynamic FC maps, Pearson’s correlation coefficients between 36 ROIs was computed with a sliding window scheme (window width=33 s, shift 1 s per step, total 267 dynamic FC maps per rat).
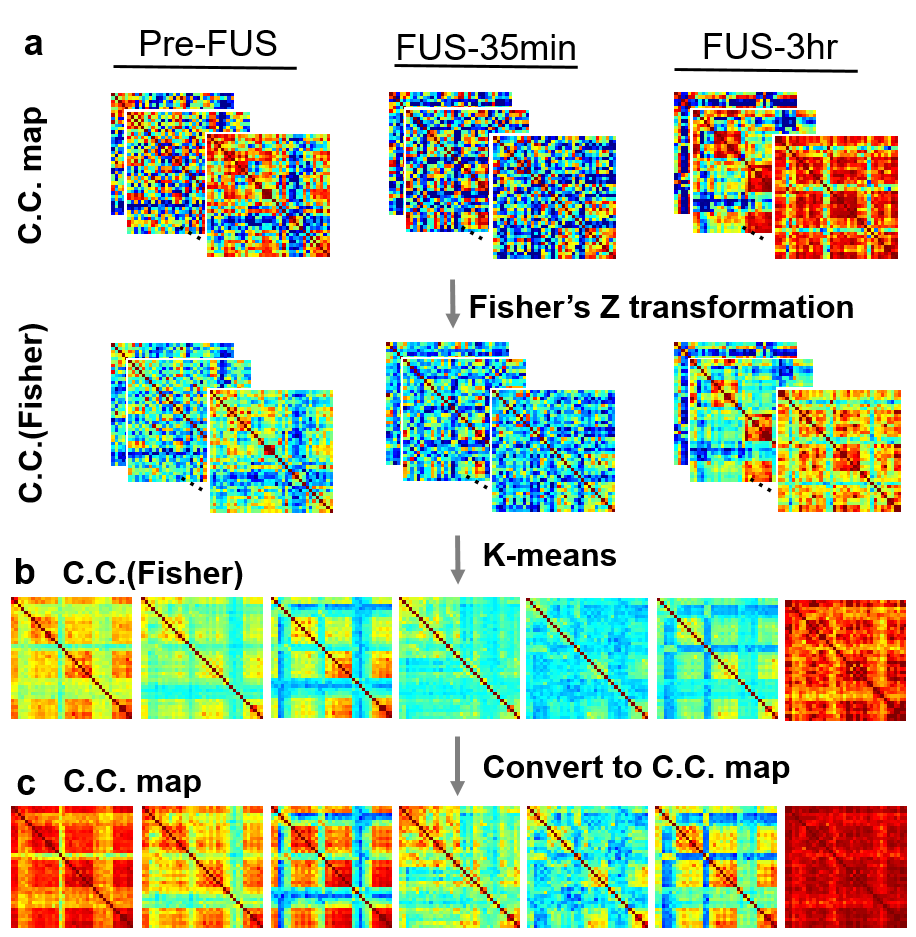
In Figure 2, a K-means method (cluster no.=7, L1 distance, repeated 500 times) was used to classify 5607 dynamic FC maps (267 FC maps x 7 rats x 3 groups) into seven centroids which indicate seven representative states of the dynamic FC during the examination. The probability% of each state was evaluated to illustrate the evolution of each state in Pre-FUS, FUS-35min, and FUS-3hr groups.
Results
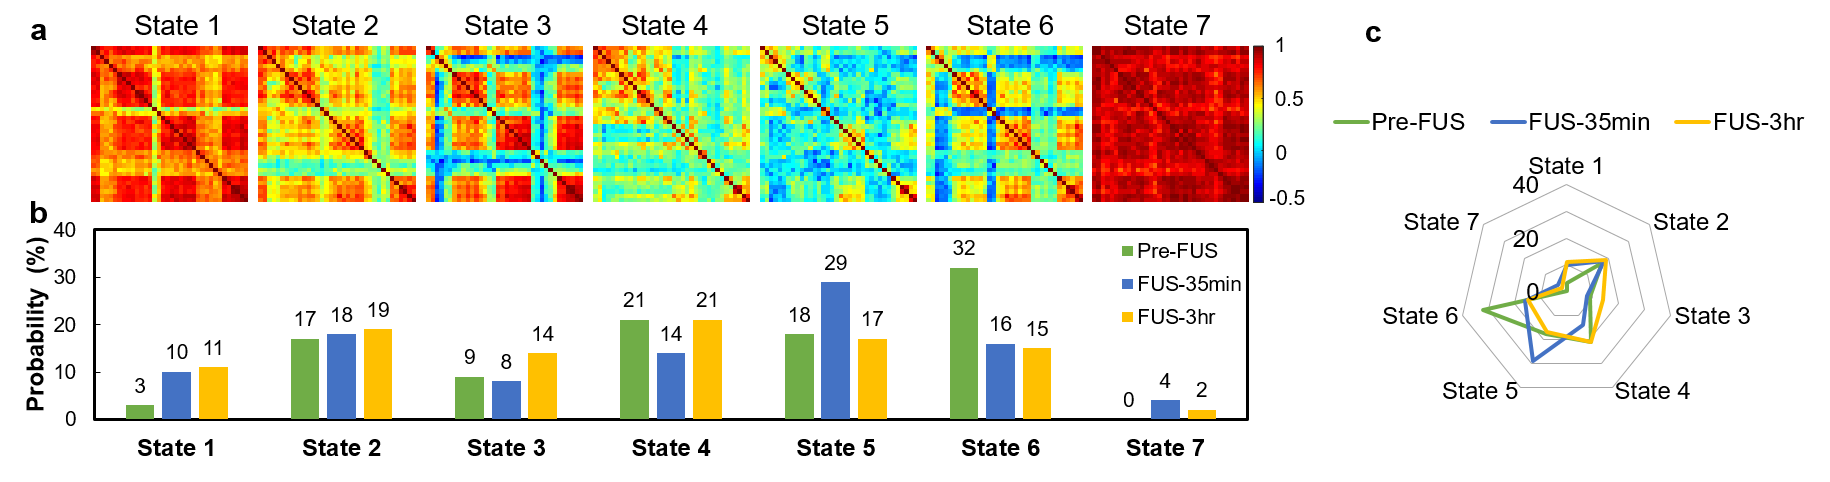
Figure 3a illustrates 7 representative states of dynamic FC maps of Pre-FUS, FUS-35min, and FUS-3hr groups. The probability% of each state in different groups was shown in Figure 3b and 3c. The probability% in State 1 revealed that FUS-35min (10%) and FUS-3hr (11%) presented increased probability% in comparison with Pre-FUS (3%). Similar probability% of State 2 was shown in the three groups. In State 3, probability% increased from FUS-35min (8%) to FUS-3hr (14%). Compare to Pre-FUS group, the probability% of State 4 decreased from 21% to 14% at FUS-35min and recovered to 21% at FUS-3hr. In contrast, the probability% of State 5 first increased from 18% to 29% and decreased again to 19% at FUS-3hr. The State 6 occupied 32% of probability at Pre-FUS and reduced substantially to half (around 16%) in FUS-35min and FUS-3hr groups. State 7 was absent at Pre-FUS and emerged in FUS-35min and FUS-3hr groups (4% and 2%).Discussion and Conclusions
In this study, we observed the evolution of dynamic FC at Pre-FUS, FUS-35min, and FUS-3hr for normal rats with FUS-induced neuromodulation at VPM/VPL regions. The impacts of FUS sonication on dynamic FC were not restricted in VPM/VPL regions but extended to other cortex regions. With K-means clustering, we quantitatively evaluated the altered probability% of dynamic FC in seven states at Pre-FUS, FUS-35min, and FUS-3hr.The increased probability% of State 1 reflected that high connectivity between primary sensorimotor, cingulate cortex, hippocampus, and thalamus were shown after FUS sonication. While those regions were reported to be with hypoconnectivity in patients with autism spectrum disorders15, the increased probability% of State 1 after FUS sonication might imply a potential treatment by noninvasive FUS-neuromodulation.
The substantially decreased probability% of State 6 described the reduced negative correlation between insula and cingulate cortex after FUS sonication. A previous study proposed that patients with complex regional pain syndrome were with lower FC between insula and cingulate cortex16. Therefore, the response of altered dynamic FC after FUS sonication might provide an alternative treatment for those patients.
In conclusion, the evolution of dynamic FC at Pre-FUS, FUS-35min, and FUS-3hr suggested the potential of FUS for neuromodulation. In the future, the applications of FUS to a specific disease model may be helpful to comprehensively understand the effect of FUS for neuromodulation.
Acknowledgements
No acknowledgement found.References
1. Bystritsky, Alexander, Lauren Kerwin, and Jamie Feusner. "A Pilot Study of Cranial Electrotherapy Stimulation." J Clin Psychiatry 69.3 (2008): 412-417.
2. Kirton, Adam. "Advancing non-invasive neuromodulation clinical trials in children: lessons from perinatal stroke." european journal of paediatric neurology 21.1 (2017): 75-103.
3. Reuter, Uwe, et al. "Non-invasive neuromodulation for migraine and cluster headache: a systematic review of clinical trials." Journal of Neurology, Neurosurgery & Psychiatry 90.7 (2019): 796-804.
4. Darrow, David P. "Focused ultrasound for neuromodulation." Neurotherapeutics 16.1 (2019): 88-99.
5. Kubanek, Jan. "Neuromodulation with transcranial focused ultrasound." Neurosurgical focus 44.2 (2018): E14.
6. Kubanek, Jan, et al. "Ultrasound elicits behavioral responses through mechanical effects on neurons and ion channels in a simple nervous system." Journal of Neuroscience 38.12 (2018): 3081-3091.
7. Kubanek, Jan, et al. "Ultrasound modulates ion channel currents." Scientific reports 6.1 (2016): 1-14.
8. Sanguinetti, Joseph L., et al. "Transcranial Focused Ultrasound to the Right Prefrontal Cortex Improves Mood and Alters Functional Connectivity in Humans." Frontiers in Human Neuroscience 14 (2020): 52.
9. Yi-Cheng Wang, et al. " Comparison of Phase Synchrony Analysis and Pearson’s Correlation Coefficient in Resting State fMRI of Rat Brain"
10. Allen, Elena A., et al. "Tracking whole-brain connectivity dynamics in the resting state." Cerebral cortex 24.3 (2014): 663-676.
11. Damaraju, Eswar, et al. "Dynamic functional connectivity analysis reveals transient states of dysconnectivity in schizophrenia." NeuroImage: Clinical 5 (2014): 298-308.
12. Rashid, Barnaly, et al. "Dynamic connectivity states estimated from resting fMRI Identify differences among Schizophrenia, bipolar disorder, and healthy control subjects." Frontiers in human neuroscience 8 (2014): 897.
13. Demirtaş, Murat, et al. "Dynamic functional connectivity reveals altered variability in functional connectivity among patients with major depressive disorder." Human brain mapping 37.8 (2016): 2918-2930.
14. Todd, Nick, et al. "Focused ultrasound induced opening of the blood-brain barrier disrupts inter-hemispheric resting state functional connectivity in the rat brain." Neuroimage 178 (2018): 414-422.
15. Di Martino, Adriana, et al. "The autism brain imaging data exchange: towards a large-scale evaluation of the intrinsic brain architecture in autism." Molecular psychiatry 19.6 (2014): 659-667.
16. Kim, Jae-Hun, et al. "Impaired insula functional connectivity associated with persistent pain perception in patients with complex regional pain syndrome." PloS one 12.7 (2017): e0180479.
Figures