2920
Functional cerebral blood volume imaging of the mouse visual cortex using vascular space occupancy
Naman Jain1, Atena Akbari1, Markus Barth1,2, and Kai-Hsiang Chuang1,3
1Centre for Advanced Imaging, The University of Queensland, Brisbane, Australia, 2School of Information Technology and Electrical Engineering, The University of Queensland, Brisbane, Australia, 3Queensland Brain Institute, The University of Queensland, Brisbane, Australia
1Centre for Advanced Imaging, The University of Queensland, Brisbane, Australia, 2School of Information Technology and Electrical Engineering, The University of Queensland, Brisbane, Australia, 3Queensland Brain Institute, The University of Queensland, Brisbane, Australia
Synopsis
Cerebral Blood Volume (CBV) – weighted vascular-space-occupancy (VASO) functional MRI (fMRI) has shown superior spatial specificity compared to the conventional gradient-echo blood-oxygen-level-dependent (BOLD) contrast in humans [1]. Although VASO fMRI has been used for CBV imaging in rats and monkeys, the applicability of this method in the mouse brain has not been investigated due to the technical challenges. In this study we examine the feasibility of VASO fMRI of the visual cortex in the anesthetized mouse.
Introduction
Blood-oxygen-level-dependent (BOLD) contrast is sensitive to the oxygenation change in blood vessels [2]. However, the spatial specificity of this contrast is poor as the largest BOLD signal changes are found in large intracortical and pial veins remote from the site of neural events [3], making the interpretation of the BOLD signal challenging. Cerebral blood volume (CBV) imaging using vascular-space-occupancy (VASO) has shown higher spatial specificity compared to conventional gradient-echo BOLD signal [1] and has been used in both human [4] and animal studies (i.e. cat [5], rat [6], monkey [7]). Using the transgenic mouse models have proved to be of great significance to understand neurophysiology and pathological mechanisms of diseases such as Alzheimer’s Disease [8], [9]. However, VASO fMRI has not been performed in the mouse brain due to the technical and experimental challenges such as small brain volume, low SNR and fast arterial transit times in the mouse brain. In this work, we investigated the feasibility of CBV imaging in the primary visual cortex (V1) of the mouse brain using VASO.Methods
- Experimental Setup
and Animal Preparation:
This study was approved by the institutional animal ethics committee. Imaging of six C57BL6 mice was performed on a 9.4T preclinical MRI (Bruker Biospec, Ettlingen, Germany) with 86mm volume coil for transmit and custom-made 10mm surface coil for receive. Mice were sedated under 0.2% isoflurane and medetomidine (0.1mg/kg/h, ip) with temperature, SpO2 and respiration monitored and controlled. Each animal was scanned for at least 2 sessions to evaluate reproducibility. - BOLD:
Two runs of BOLD fMRI were acquired using a multi-band EPI sequence with TR/TE= 300/15 ms and 0.3×0.3×0.5 mm3 resolution [10]. A flashing blue light with the frequency of 5 Hz was used as the visual stimulation in 16 blocks, with a 12 s OFF and 3 s ON duration. The AEDES toolbox (by The University of Eastern Finland, Kuopio, Finland) was used to obtain BOLD activation maps to localize the activated area of the brain to plan the VASO acquisition during the experiment and for comparison with the VASO activation maps later in the analysis. All voxels corresponding to an uncorrected significance level of p<0.05 were assumed as the activated regions. - VASO:
A VASO sequence based on modified FAIR pulse sequence was used for selective inversion (slab width = 16 mm) with TR/TE/TI = 3000/5.02/950 ms, 0.3×0.3×1 mm3 resolution and 6 slices. Blood nulling time (TI) was calculated based on the reported blood T1 value of the mouse brain (T1 = 2449ms) at 9.4T [11]. We performed a series of pilot scans to optimize inversion pulse and inversion time that resulted in the use of a slightly shorter TI (of 950ms). Four runs of functional images with visual stimulus of different duration (12 blocks of 30 second on and off) were acquired. Structural images were obtained using T2_TurboRARE sequence as the anatomical reference. Data were analyzed using SPM12 (UCL, UK) with motion correction but no spatial smoothing. All voxels with t-values above 3.0 corresponding to an uncorrected significance level of p<0.001 were assumed as the activated regions.
Result
VASO activation maps of two mice are shown in Figure 1. The averaged VASO signal time course over 12 blocks and 4 runs per session (Figure 2) demonstrates an expected negative signal change. 3 mice got a successful VASO response with a signal change of -0.139% (Mouse 1), -0.132% (Mouse 2) and -0.123% (Mouse 3).Discussion
In these initial results we show that VASO activation areas are more confined to grey matter compared to BOLD in agreement with previous studies [12], [13]. Our results show the feasibility of functional VASO imaging in anesthetized mouse brain at 9.4T. The biggest challenge with VASO is the low sensitivity, which requires long scan time for data averaging. Potentially, the sensitivity could be improved by optimizing the inversion slab accounting for the fast arterial transit times in mouse and using a more sensitive RF coil (cryoprobe).Acknowledgements
The authors acknowledge funding by NHMRC-NIH BRAIN Initiative Collaborative Research Grant APP1117020, NIH grant R01MH111419.References
[1] H. Lu, X. Golay, J. J. Pekar, and P. C. M. Van Zijl, “Functional magnetic resonance imaging based on changes in vascular space occupancy,” Magn. Reson. Med., vol. 50, no. 2, pp. 263–274, 2003, doi: 10.1002/mrm.10519.[2] S. Ogawa, T. ‐M Lee, A. S. Nayak, and P. Glynn, “Oxygenation‐sensitive contrast in magnetic resonance image of rodent brain at high magnetic fields,” Magn. Reson. Med., vol. 14, no. 1, pp. 68–78, 1990, doi: 10.1002/mrm.1910140108.
[3] K. Uludaǧ, B. Müller-Bierl, and K. Uǧurbil, “An integrative model for neuronal activity-induced signal changes for gradient and spin echo functional imaging,” Neuroimage, vol. 48, no. 1, pp. 150–165, 2009, doi: 10.1016/j.neuroimage.2009.05.051.
[4] L. Huber, “Mapping human brain activity by functional magnetic resonance imaging of blood volume,” vol. D, no. November 1985, pp. 1–277, 2015, [Online]. Available: http://nbn-resolving.de/urn:nbn:de:bsz:15-qucosa-165252.
[5] T. Jin and S. G. Kim, “Improved cortical-layer specificity of vascular space occupancy fMRI with slab inversion relative to spin-echo BOLD at 9.4 T,” Neuroimage, vol. 40, no. 1, pp. 59–67, 2008, doi: 10.1016/j.neuroimage.2007.11.045.
[6] L. R. Huber et al., “Validating layer-specific VASO across species,” pp. 1–17, 2020, doi: 10.1101/2020.07.24.219378.
[7] L. Huber et al., “Investigation of the neurovascular coupling in positive and negative BOLD responses in human brain at 7T,” Neuroimage, vol. 97, pp. 349–362, 2014, doi: 10.1016/j.neuroimage.2014.04.022.
[8] A. Niranjan, I. N. Christie, S. G. Solomon, J. A. Wells, and M. F. Lythgoe, “fMRI mapping of the visual system in the mouse brain with interleaved snapshot GE-EPI,” Neuroimage, vol. 139, pp. 337–345, 2016, doi: 10.1016/j.neuroimage.2016.06.015.
[9] J. Grandjean et al., “Common functional networks in the mouse brain revealed by multi-centre resting-state fMRI analysis,” Neuroimage, vol. 205, no. October 2019, 2020, doi: 10.1016/j.neuroimage.2019.116278.
[10] H. L. Lee, Z. Li, E. J. Coulson, and K. H. Chuang, “Ultrafast fMRI of the rodent brain using simultaneous multi-slice EPI,” Neuroimage, vol. 195, no. March, pp. 48–58, 2019, doi: 10.1016/j.neuroimage.2019.03.045.
[11] M. C. Dobre, K. Uǧurbil, and M. Marjanska, “Determination of blood longitudinal relaxation time (T1) at high magnetic field strengths,” Magn. Reson. Imaging, vol. 25, no. 5, pp. 733–735, 2007, doi: 10.1016/j.mri.2006.10.020.
[12] T. Jin and S. G. Kim, “Spatial dependence of CBV-fMRI: A comparison between VASO and contrast agent based methods,” Annu. Int. Conf. IEEE Eng. Med. Biol. - Proc., no. 10, pp. 25–28, 2006, doi: 10.1109/IEMBS.2006.259553.
[13] L. Huber et al., “Slab-selective, BOLD-corrected VASO at 7 tesla provides measures of cerebral blood volume reactivity with high signal-to-noise ratio,” Magn. Reson. Med., vol. 72, no. 1, pp. 137–148, 2014, doi: 10.1002/mrm.24916.
Figures
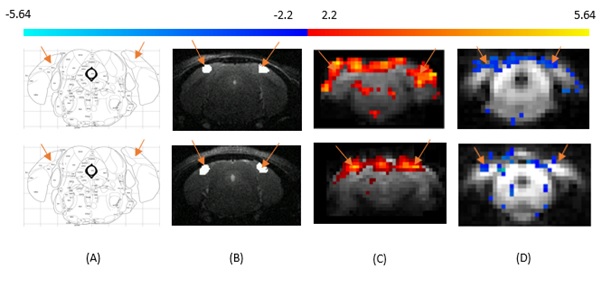
Figure
1: Primary visual cortex is specified with reference to
Paxinos and Franklin Mouse Brain Atlas (Figure 1A), V1 is marked with orange
arrows in T2-weighted structural scan (Figure 1B). Primary visual cortex
indicated by the arrows. (C) BOLD and (D) VASO functional maps of mouse primary
visual cortex. Row 1 (Top) and Row 2 (Bottom) are the results acquiried from
two different mice.
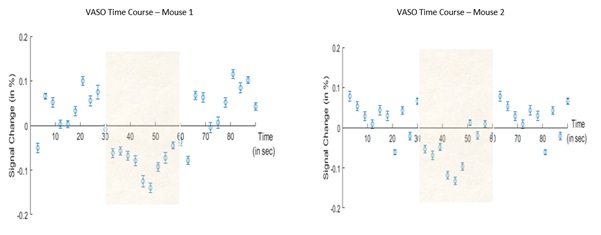
Figure 2: VASO signal time course of averaged across all
stimulation blocks (shaded area) of 4 runs for 2 different mice, errorbars
represents the standard error of mean.