2918
Global Signal vs. Global Noise in Rat rs-fMRI1Biomedical Engineering, Emory University, Atlanta, GA, United States, 2Biomedical Engineering, Georgia Institute of Technology, Atlanta, GA, United States
Synopsis
Regression of the BOLD “global signal” in human rs-fMRI studies to reduce widespread noise is a controversial practice since the signal may also contain neural activity. Rodent rs-fMRI studies offer an opportunity to better disentangle the neural and nonneural contributors to the global signal. However, global signal in rodents has been relatively little studied. We performed a voxel-wise analysis to examine the global signal’s spatial distribution. We found that, as in humans, global signal contributions vary spatially within the rat brain and that certain attributes of this signal are unique to the brain when compared to nonneural sources of noise.
Purpose
The blood oxygen level dependent (BOLD) “global signal” in resting state-fMRI (rs-fMRI) is often calculated as a global average of all activity throughout the brain. During preprocessing, this signal is often regressed out of rs-fMRI data under the premise that these widespread fluctuations in signal are predominantly reflective of physiological noise and motion1. However, the removal of this global signal may also remove important neural activity, such as the contributions of large-scale dynamics and connectivity2–4. In the rat, we have the ability to carefully control physiology and obtain simultaneous measures of neural activity with rs-fMRI, which may help to better understand the sources of the global signal. However, the global signal has been little studied in rodents to date. Here, we take the first steps toward characterizing the global signal in rats by examining the power spectrum and spatial distribution of the global signal. We then compare the findings to signal measured from the muscle adjacent to the brain, which should be susceptible to most of the same noise as the brain itself. This allows us to assess how much of the global signal is associated with brain activity and how much can be attributed to widespread image noise.Methods
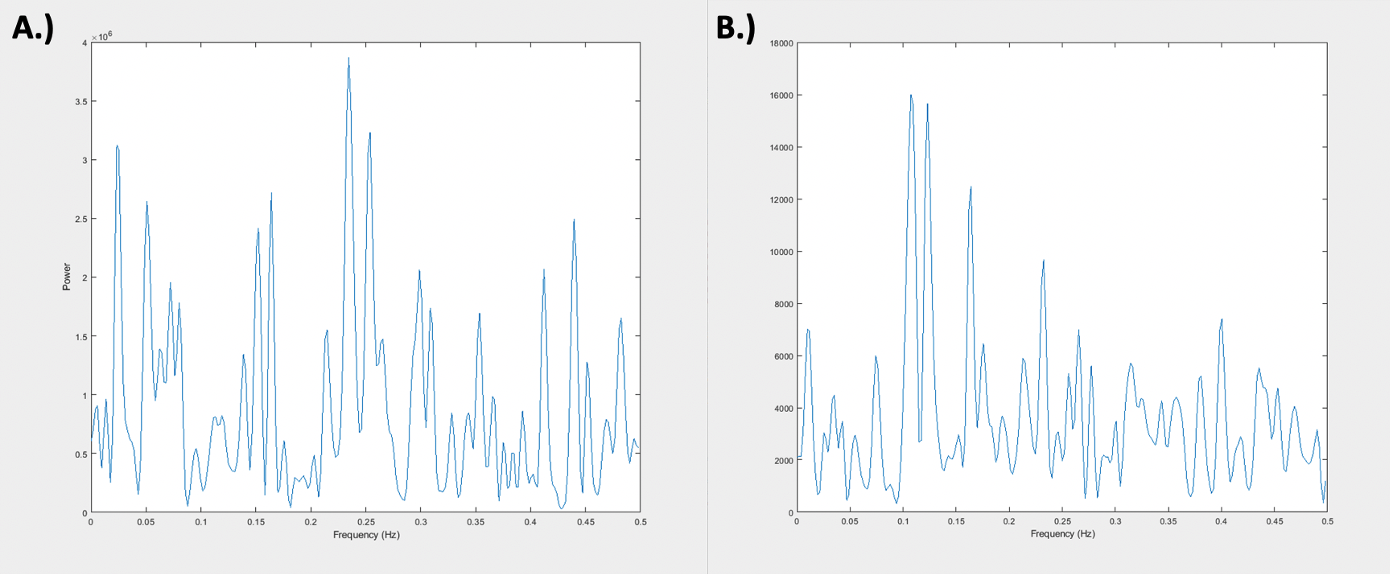
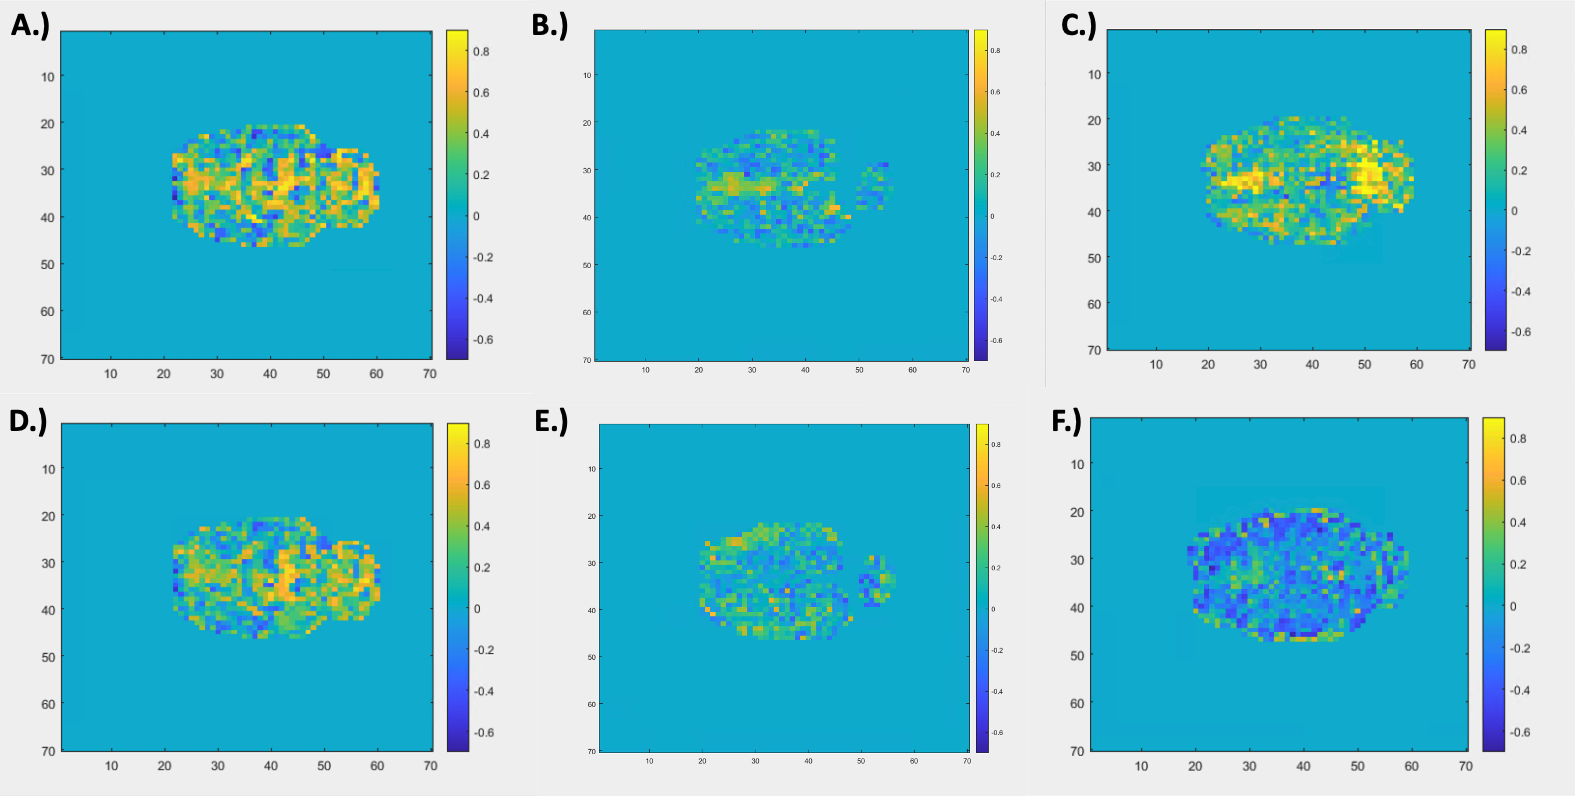
Resting state-fMRI scans were acquired from 8 intubated male Sprague-Dawley rats under dexmedetomidine (injected subcutaneously via a bolus of 0.025 mg/kg, then switched to a constant 0.05 mg/kg/hr subcutaneous infusion which was later increased to 0.15 mg/kg/hr after 1.5 hrs) and obtained using a 9.4T Bruker MRI scanner. All scans were gradient echo EPI with partial Fourier encoding with a factor of 1.4 and acquired with the following parameters: voxel size = 500 um, matrix size = 70 x 70, slice number = 24, TE = 15 ms, TR = 2000 ms. All scans were preprocessed with topup distortion correction, volume registration, motion correction, and bandpass filtering (0.01 – 0.2 Hz). Brain global signal was calculated by performing a global average across the segmented brain volume and muscle “global signal” was calculated by performing a global average on the segmented muscle volume of the same scans. Global signals were then analyzed after calculating the power spectral density estimate via Welch’s method. The averaged global signals (see Figure 1) were calculated by averaging each global signal for 49 10-minute scans across 8 rats. The voxel-wise correlation analysis (see Figure 2) was done by taking the time course of each voxel in the brain and correlating it to the brain and muscle global signals via a Pearson’s linear correlation.Results and Discussion
Figure 1 shows the relative frequency contributions to brain (Figure 1A) and muscle (Figure 1B) averaged global signals. The figure shows that the two power spectra are distinctly different from each other, with that of the muscle showing clear peaks between 0.1 and 0.15 Hz whereas that of the brain shows more initial peaks before and around 0.05 Hz. Under the assumption that the global signal is majority noise, one could expect the global signal characteristics of both types of tissue to look very similar in nature since noise tends to be more global and regionally non-specific. However, this distinction could mean that there are elements of the brain global signal that are unique to the brain which leads one to question whether regressing out the global signal removes key information when assessing brain activity. Figure 2 shows a spatial distribution of contributions to both the brain and muscle global signals. The top row (Figure 2A – C) shows that, as one might expect, correlation to the global signal is not uniform across the brain. Localizations of high correlation are seen in various regions of the brain across rats which could prove to have functional significance. The tendency of the global signal to localize along mid-line areas has also been observed in humans2 and could be related to the large venous structures or to particular networks located along the midline of the brain. The bottom row (Figure 2D – F) shows a spatial distribution of correlation to the muscle global signal which shows varying levels of correlation or anti-correlation when compared to that of the brain global signal above. These differences in correlation are reflected in the R values representative of correlation between the brain and muscle global signals, even so, the spatial distribution of where these correlation patterns lie are different between the two tissue types.Conclusion
These analyses provide insight and prompt further investigation into what comprises the rat rs-fMRI brain global signal. We have shown that contributions to the rat brain global signal are not spatially uniform and that the presence of characteristics unique to the brain as opposed to other tissues could imply that this global signal contains more than just widespread noise. These results are similar to findings in human rs-fMRI, and further investigation into these findings will provide better insight on what exactly is being removed during global signal regression and whether or not this practice is unfavorable for assessing brain activity in rs-fMRI studies.Acknowledgements
No acknowledgement found.References
1. Liu, T. T., Nalci, A. & Falahpour, M. The Global Signal in fMRI: Nuisance or Information? NeuroImage 150, 213–229 (2017).
2. Billings, J. & Keilholz, S. The Not-So-Global Blood Oxygen Level-Dependent Signal. Brain Connect. 8, 121–128 (2018).
3. Li, J. et al. Topography and behavioral relevance of the global signal in the human brain. Sci. Rep. 9, (2019).
4. Gotts, S. J. et al. The perils of global signal regression for group comparisons: a case study of Autism Spectrum Disorders. Front. Hum. Neurosci. 7, (2013).
Figures