2917
Automatic detection of BOLD oscillations in the anesthetized brain1Translational Research Imaging Center, Clinic for Radiology, University Hospital Muenster, Muenster, Germany
Synopsis
Periodic BOLD oscillations caused by vasomotion can superimpose temporal signal fluctuations in fMRI measurements and may affect brain network analysis. In order to establish a reliable detection of BOLD oscillations, we developed an automatic oscillation detection tool with an accuracy of 96 %. With this program, we examined high temporal resolution MR data consisting in total of 1.259.400 images. We found that BOLD oscillations occur brain wide starting between two and four hours after initiation of medetomidine sedation.
Introduction
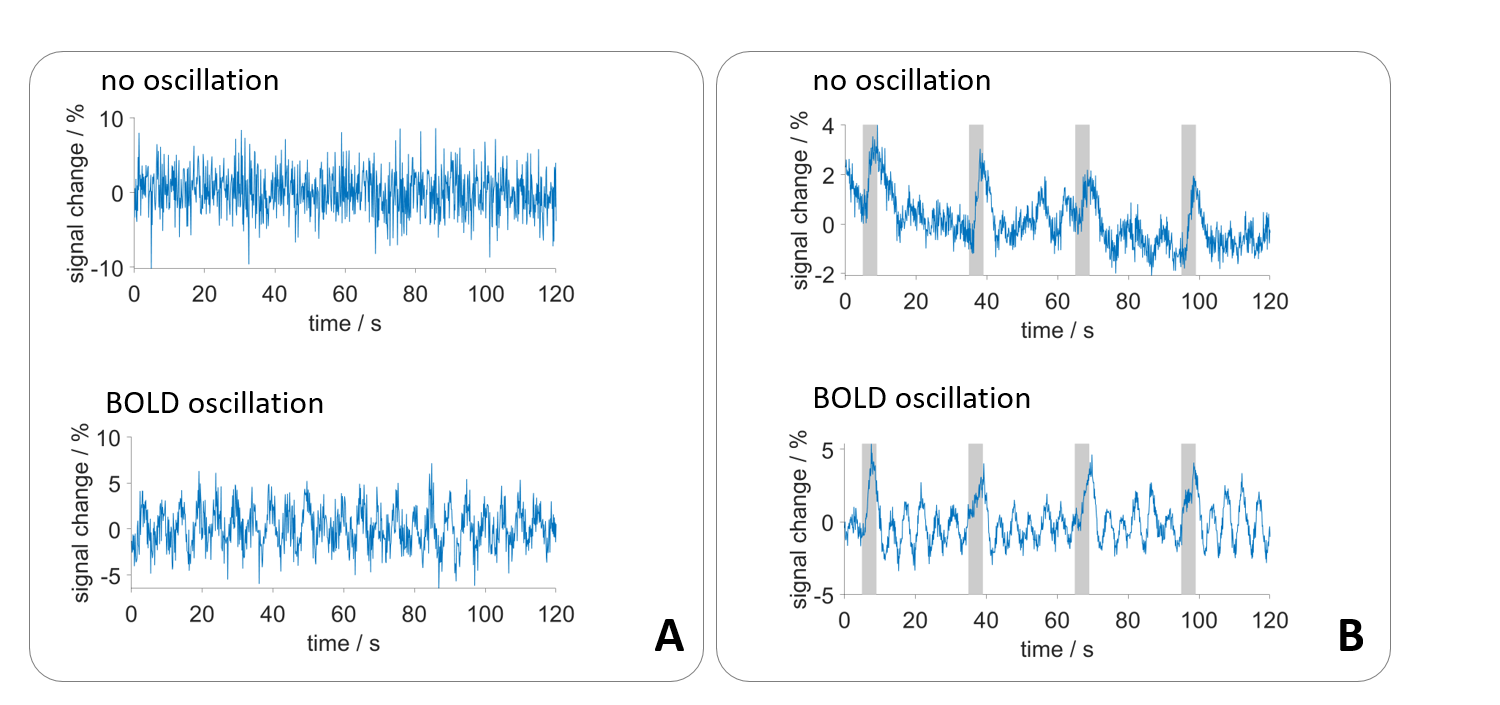
Vasomotion, the oscillation of blood vessels, causes periodic fluctuations in blood blow.1,2 Among other physiological oscillations and periodic signal fluctuations caused by aliasing3, these oscillations of blood flow represent a physiological noise source for T2* weighted fMRI measurements (fig. 1). Periodic BOLD oscillations do not affect activation maps obtained by measurements with stimulation.4 However, rs-fMRI and brain network analysis may be affected, since temporal signal fluctuations are the basis of rs-fMRI analysis. Therefore, a reliable automatic detection of BOLD oscillations is desirable. We have developed a MATLAB tool that detects BOLD oscillations with an accuracy of 96 %. Using this program, we examined rat fMRI data at high temporal resolution, to investigate the occurrence of BOLD oscillations under different experimental conditions.Methods
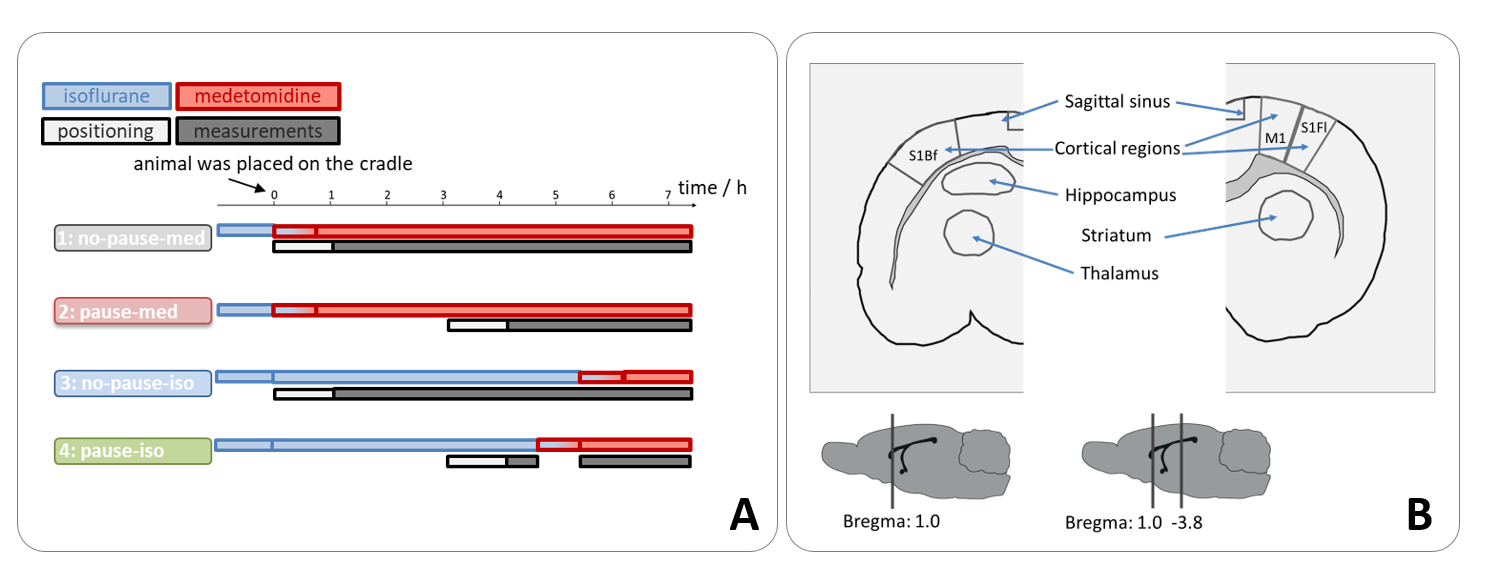
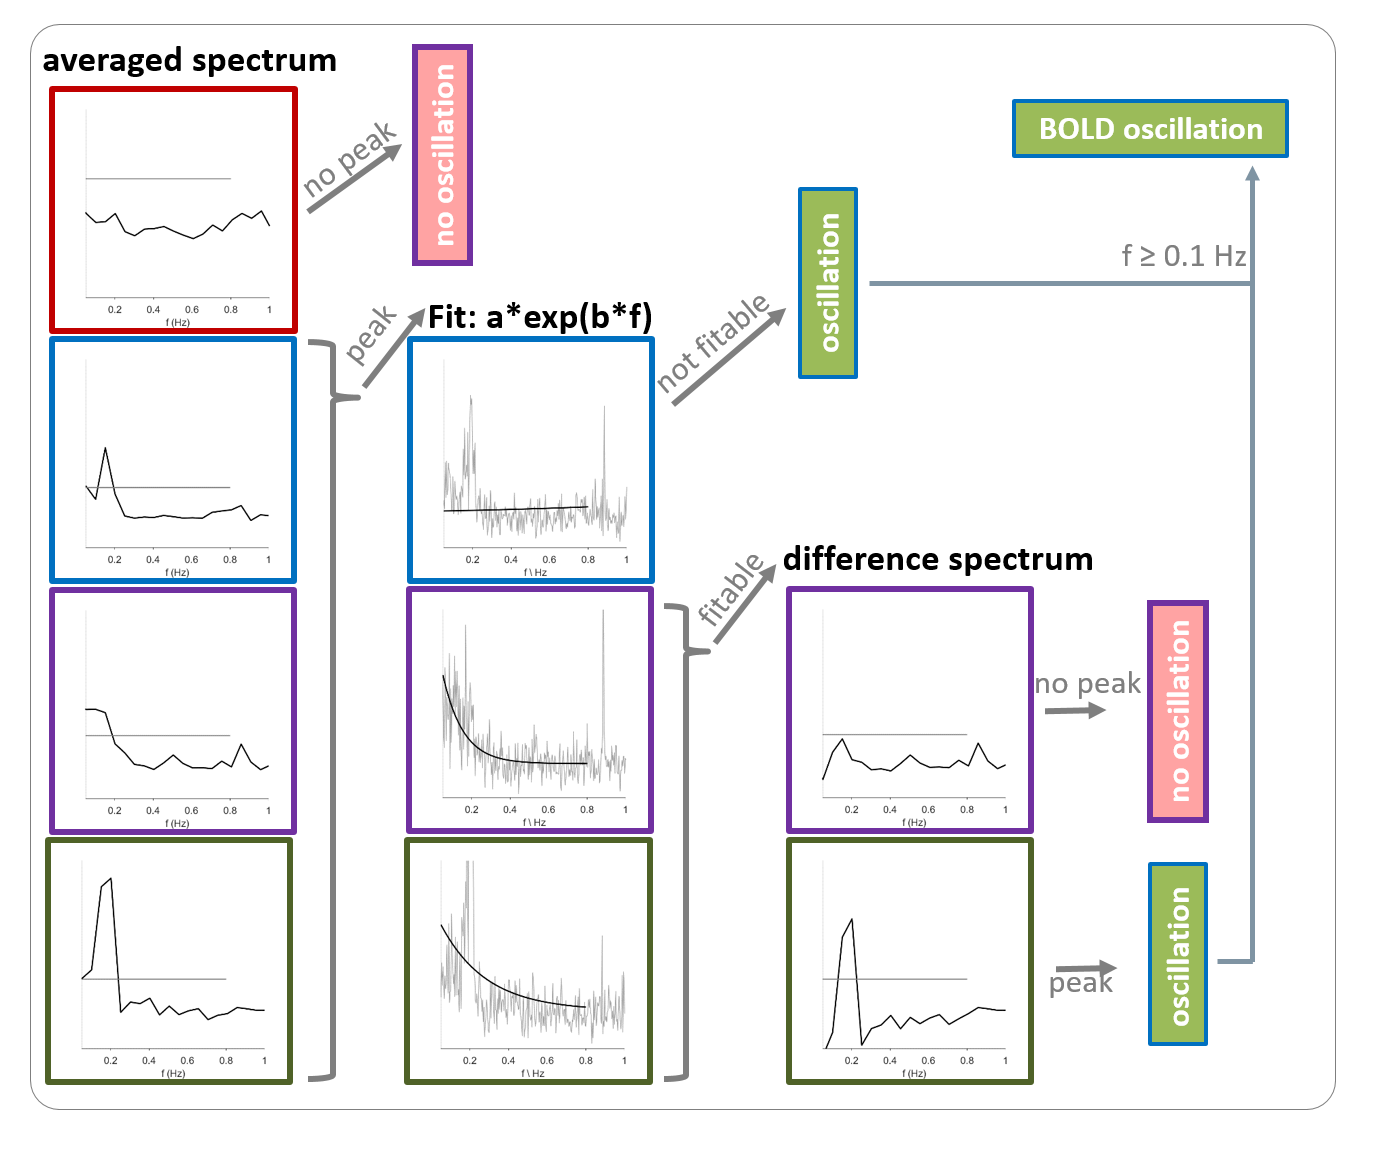
Single-shot EPI measurements were performed on 21 ventilated Fischer rats using a 9.4 T small animal MRI with fast repetition times during resting state or upon electrical paw stimulation (TR: 100 ms or 125 ms, resolution: 325 µm x 350 µm x 1.2 mm, 1 or 2 slices, 5 up to 10 min; 1-1.5 mA, 9 Hz, 1 ms-pulses, left forepaw). Four groups were examined (fig. 2A). For the first group (n=6), a 1-cm surface coil was used (1 slice). For the other groups (n=5, each), a phased array head-coil was used (2 slices). BOLD time courses of up to 14 ROIs were extracted (fig. 2B). For the automatic detection of BOLD oscillations, a MATLAB tool with the following workflow was developed (fig. 3): First, a Fast Fourier Transformation of the time courses was performed and averaged to a resolution of 0.05 Hz. If there was a peak with an amplitude over a defined threshold, an exponential function was fitted to the spectrum. The resulting function was subtracted from the spectrum to remove frequencies of temporal signal fluctuations that could cause false positives. Afterwards, the peak picking was repeated. If a peak was found, the time course was classified as oscillatory. If the function could not be fitted to the spectrum, the result from the first peak picking was used, which resulted in misclassification of some of the time courses as oscillating. The majority of these false positives could be removed by introducing an oscillation frequency threshold of at least 0.1 Hz for classification as BOLD oscillation. 240 time courses were randomly selected and manually classified as oscillatory or non-oscillatory. One half of these time courses was used for optimization of the peak picking threshold. The other half of the time courses was used for testing the performance of the detection tool.Results
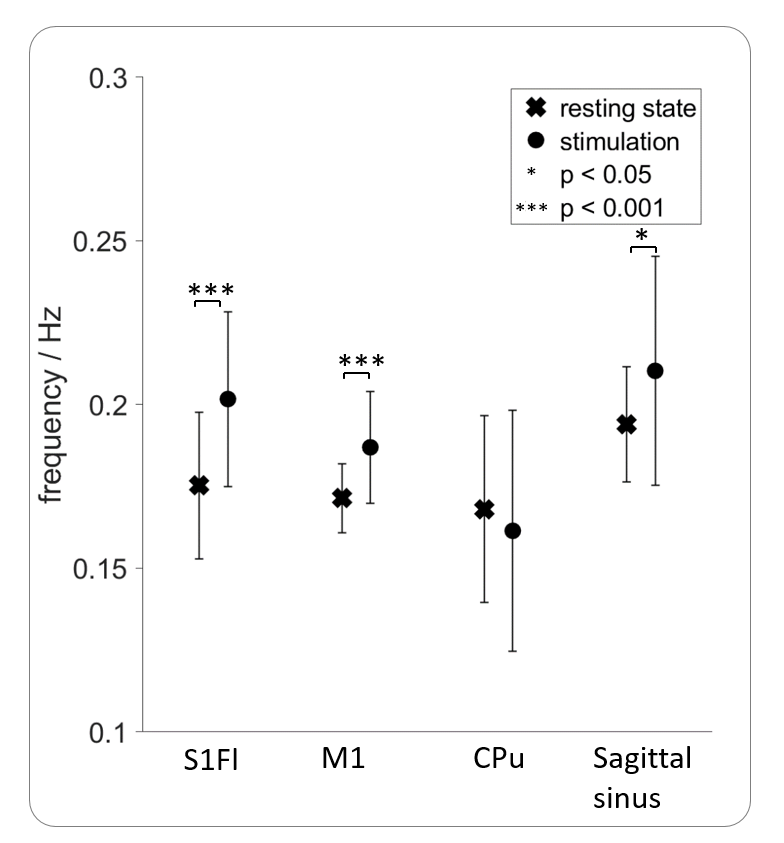
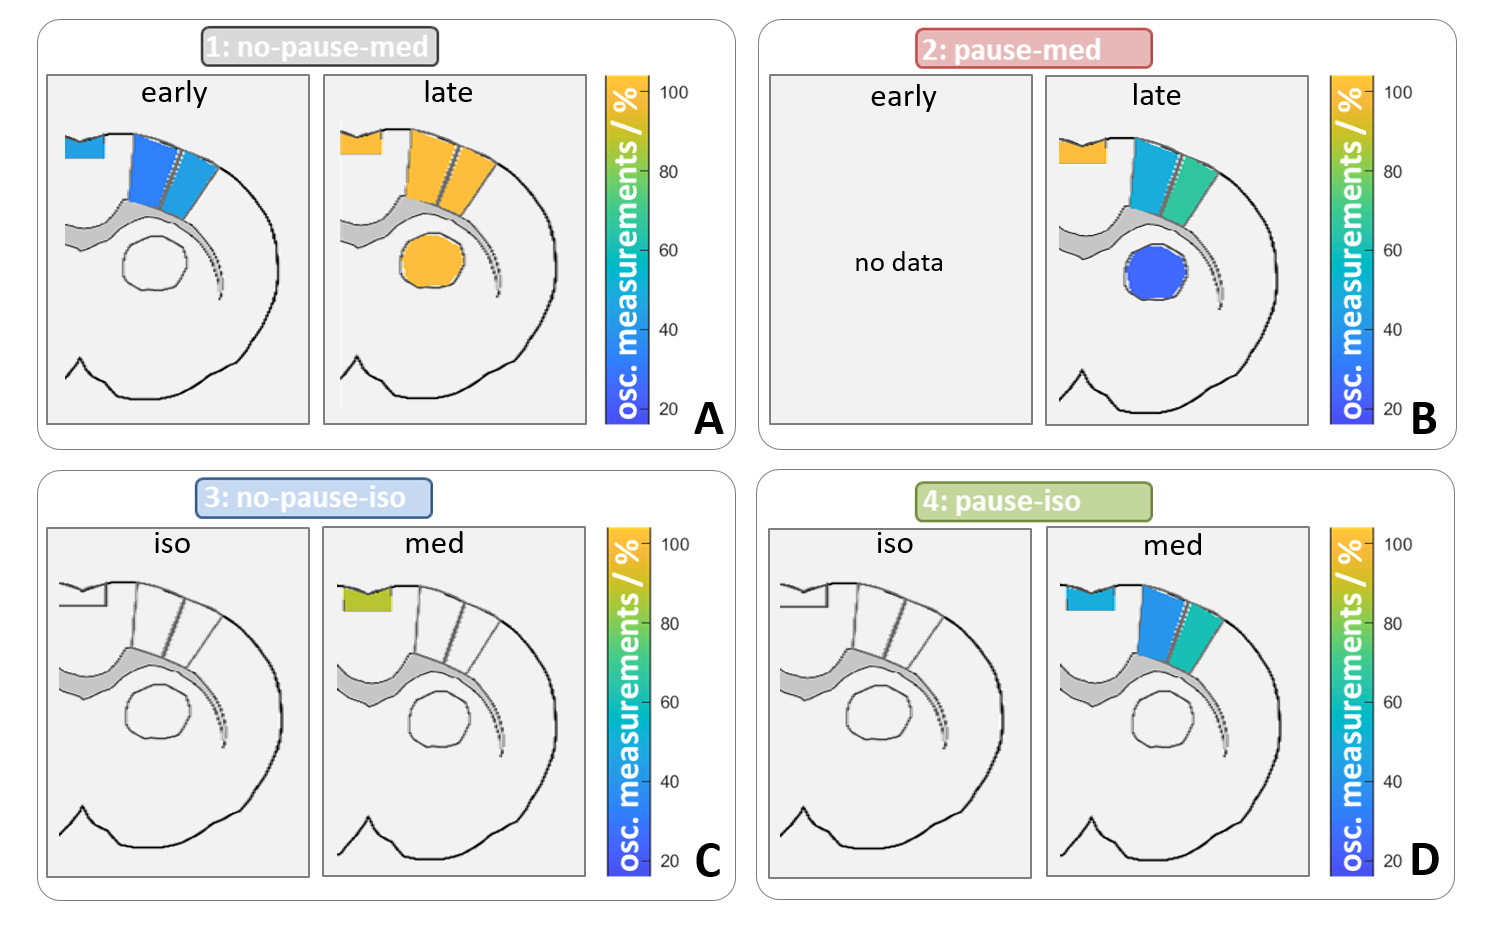
After optimizing the automatic detection tool, the detection matched 96 % of the manually classified test data. Only 1 % of the time courses were incorrectly classified as positive. In total, 1.259.400 MR images resulting from an experiment time of 133 hours were analyzed, using the developed automatic detection tool. 100 of 171 datasets showed BOLD oscillations in at least one brain region. Analysis of group 1 showed that BOLD oscillations started between two and four hours after initiation of medetomidine sedation. Furthermore, significant differences between the oscillation frequency of resting state and stimulation measurements were observed (fig. 4). For example, oscillations in the primary motor cortex (M1) showed a significantly (p<0.001) higher frequency during stimulation (0.19 ± 0.02 Hz) than during rest (0.17 ± 0.01Hz). Oscillations occurred under medetomidine sedation in all examined regions (fig. 5). In subcortical regions, oscillations were detected only after prolonged (at least 3 hours) medetomidine sedation. However, detection of oscillations may be obscured by a lower SNR, since the coil was more distant from these regions.Conclusion
With 96 % specificity our automatic oscillation detection tool showed a reliable performance. Analysis of high temporal resolution rat fMRI data revealed, that BOLD oscillations occur brain wide starting between two and four hours after initiation of medetomidine sedation and may thus influence network analysis of fMRI data. In conclusion, we advise to apply an oscillation detection tool and to correct the data, or to limit BOLD fMRI measurements under medetomidine sedation to a duration of 3 hours.Acknowledgements
No acknowledgement found.References
1. Aalkjær C, Boedtkjer D, Matchkov V. Vasomotion – what is currently thought? Acta Physio l 2011; 202:253-269
2. Kim JH, Ress D. Arterial impulse model for the BOLD response to brief neural activation. NeuroImage. 2016;124:394-408
3. Pais-Roldán P, Biswal B, Scheffler K, et al. Identifying Respiration-Related Aliasing Artifacts in the Rodent Resting-State fMRI. Front. Neurosci. 2018;12:788
4. Lambers H, Wachsmuth L, Albers F, et al. fMRI signal oscillations in rats can be induced by electric paw stimulation but do not deteriorate the observed BOLD peak. ISMRM. 2019;Abstract No. 3764
Figures