2916
High Resolution Functional Mapping of Orientation Domains in the Cat Visual Cortex using Denoising with NORDIC1Center for Magnetic Resonance Research and Department of Radiology, University of Minnesota, Minneapolis, MN, United States, 2Center for Magnetic Resonance Research and Department of Electrical and Computer Engineering, University of Minnesota, Minneapolis, MN, United States
Synopsis
Animal model studies in functional brain imaging (fMRI) require extremely high spatial resolutions, thus being challenged by the low signal-to-noise ratio (SNR). Recent advances in fMRI denoising provide gains by suppressing thermal noise. Here we demonstrate significant improvements of fMRI results by NORDIC (NOise reduction with DIstribution Corrected PCA) de-noising; increased functional CNR and T-statistics, yielded the high signal stability of single fMRI acquisition with reproducible quantification of brain responses.
INTRODUCTION
Animal model studies play a critical role in examining spatiotemporal limits of functional brain imaging (fMRI). Extremely high spatial resolutions required in such studies are limited by the available signal-to-noise ratio (SNR); in this regime, fMRI measurements are dominated by thermal noise. Recent denoising advances have demonstrated substantial gains in suppressing thermal noise in fMRI data using low-rank methods to remove components that cannot be distinguished from zero-mean Gaussian noise (1). Here we evaluate the impact of this denoising algorithm, NORDIC (NOise reduction with DIstribution Corrected PCA), on high resolution CBV weighted (wCBV) fMRI mapping of iso-orientation domains in the cat visual cortex.METHODS
Animal preparation: 2 cats (0.8–1.6 kg, 4-16 postnatal weeks) were used; protocol was approved by the University of Minnesota Institutional Animal Care and Use Committee. Animals were initially anesthetized (ketamine cocktail, 10–20 mg/kg) and mechanically ventilated under 0.8-1.1% isoflurane. A contrast agent (Feraheme® 0.75 cc/kg) was delivered through the femoral vein for wCBV imaging. Vital signs were monitored and maintained in normal range. Visual stimulation: Orientation square-wave gratings were used for block-design fMRI: eight orientations, 0° to 157.5° with 22.5° step; spatial frequency, 0.07-0.15 cycle/°; temporal frequency, 2 cycle/s; bidirectional drifting; stimulation duration, 10 secs; inter-stimulus interval, 30 secs; each orientation repeated over 20 times. Functional imaging: Experiments were performed at 9.4-Tesla (Agilent, CA) using 15-mm diameter radio frequency (RF) coil. Structural imaging used a flow-compensated RF-spoiled GE sequence (matrix=256×256, FOV=32×32 mm, 125 μm isotropic resolution, 10-12 slices, TR=119.86 ms, TE=5.1 ms). wCBV fMRI used 2D segmented (n = 4) GE EPI (matrix = 80×80, FOV = 20×20 mm; 250 μm isotropic resolution; 6-8 slices for axial and 2-3 slice for sagittal plane imaging; TR = 2 secs, TE = 10 ms). NORDIC: We followed NORDIC procedure (1, 2) on complex data and adapted to the vendor optimized reconstruction. A slice-specific Marchenko-Pastur (MP) (3) estimation with patch-sizes [22, 42, 62 , 82 ,162] was used for determination of the thermal noise-level and the average estimated level was used as described previously in a locally-low-rank PCA with hard thresholding. For a slice-specific denoising, the 11:1 ratio (“K-ratio”) from NORDIC was achieved with a patch-size of 35×35. Data analysis: fMRI data underwent post-processing for slice-timing correction and motion correction using AFNI (4). Then General Linear Modeling (GLM) was applied. The orientation tuning curves were estimated with Von Mises function fitting (5). Functional contrast-to-noise ratio (fCNR) was calculated as |A|/σN, where A is the amplitude of stimulus-evoked wCBV signal change and σN is the standard deviation of the noise in voxel-wise time series (Definition 2 in (6)).RESULTS
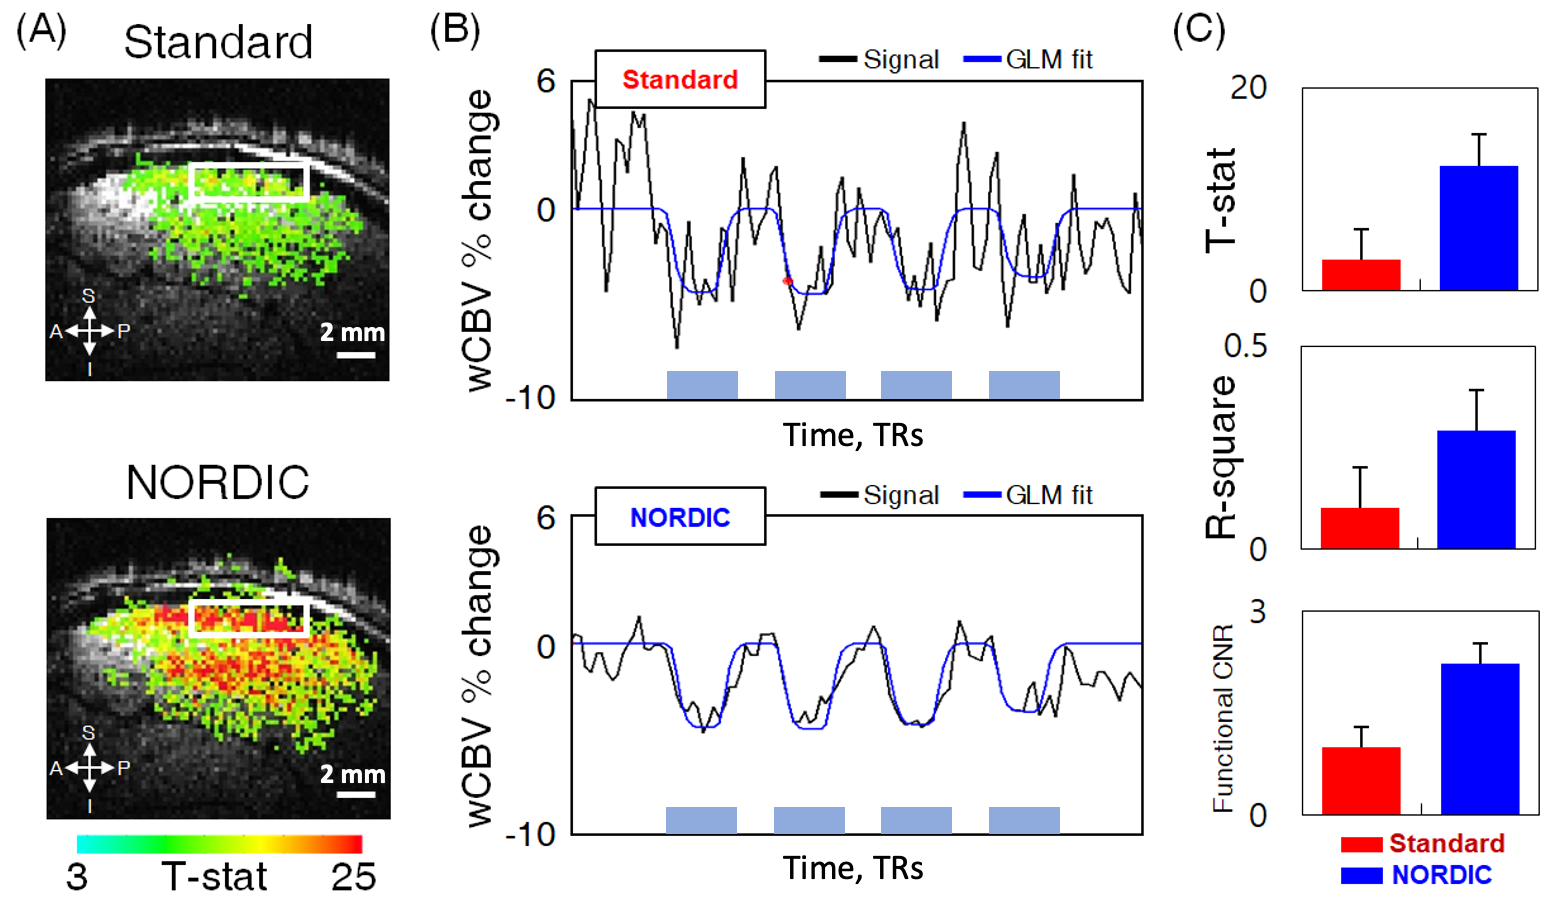
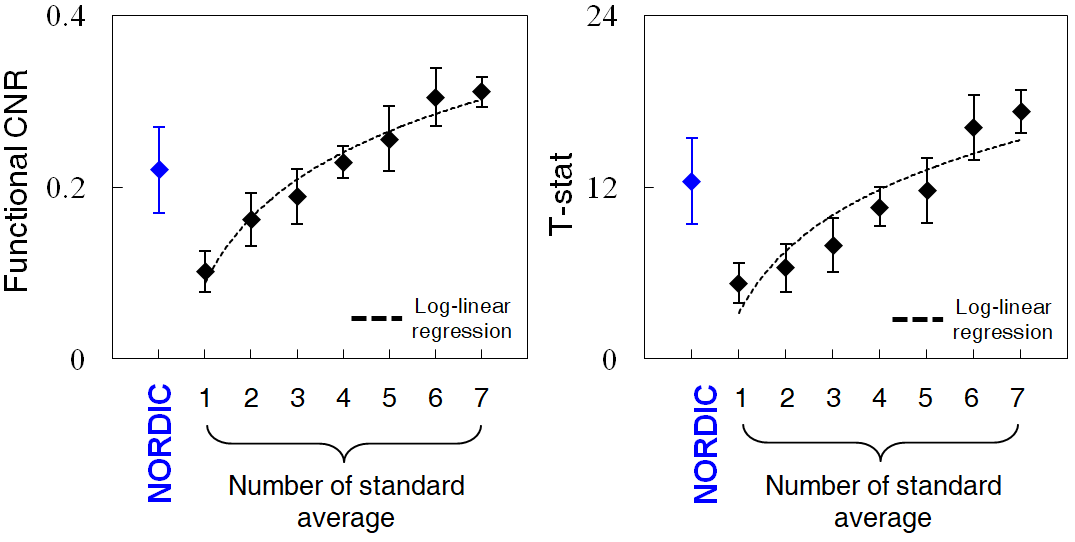
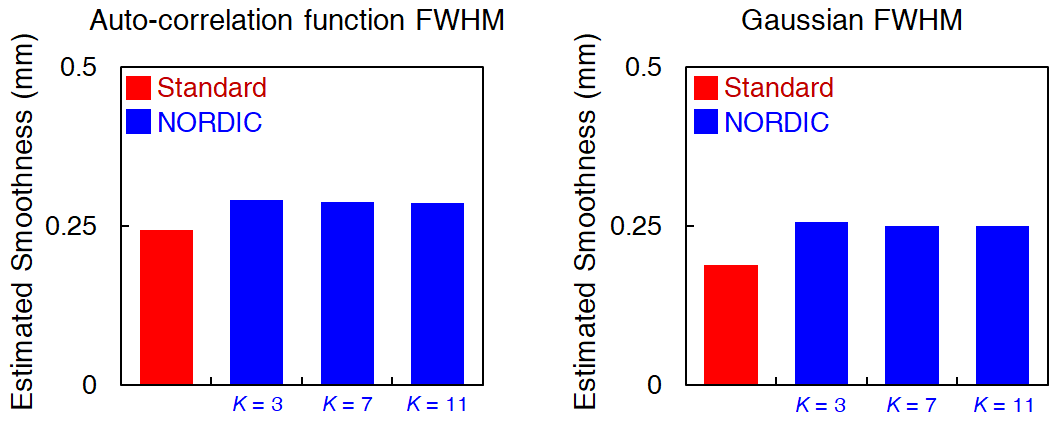
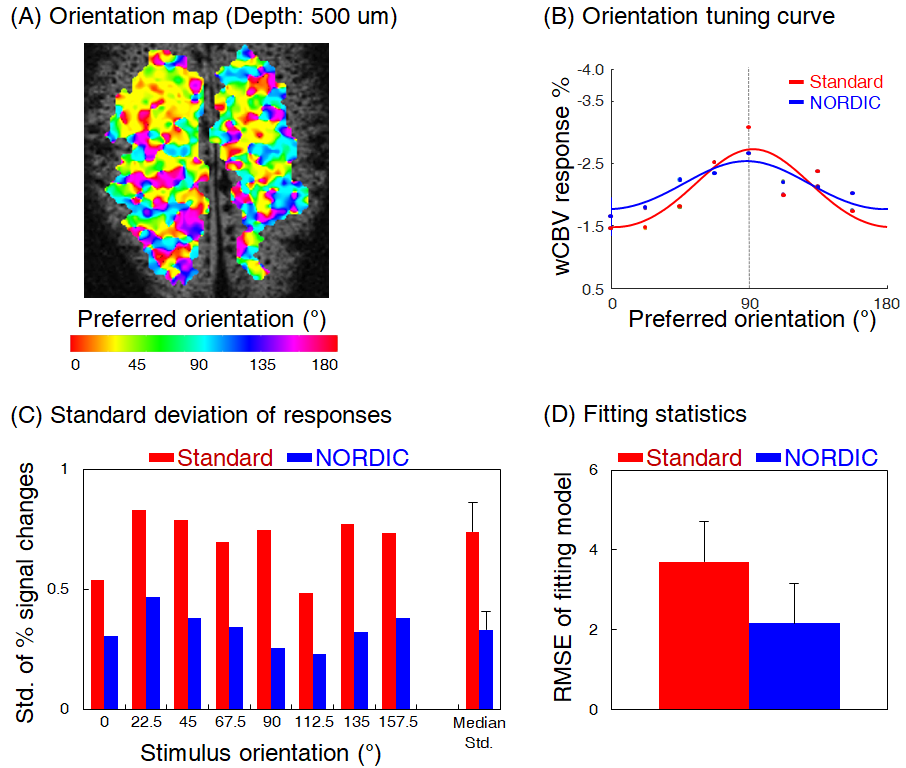
The application of NORDIC to wCBV fMRI substantially improved the quality of functional data. After denoising, number of voxels displaying stimulus-induced signal changes above a T-threshold, and the maximal T-statistics achieved increased relative to the standard reconstruction (Fig. 1A); NORDIC processed data showed lesser degree of noise (Fig. 1B) with greater than 2 fold improved statistics for the estimation of the stimulus-induced CBV signal changes (T-statistics, R-square, and functional CNR) from GLM outputs (Fig 1C). The improvements were quantitatively consistent, with signal averaging approach. Using random combinatorial permutations of repeated acquisitions, the average fCNR and T-statistics with NORDIC was 2 times higher than the average standard individual run in the region-of-interest (ROI), and required 3-4 and >4 averages to match the CNR and the T-statistics, respectively (Fig. 2). The spatial auto-correlation using AFNI was used to estimate the impact of NORDIC on image smoothing (Fig. 3) for different patch sizes (2). For the 35×35 patch sizes (K-ratio = 11.13), the full-width-half-maximum (FWHM) estimated from two different approaches show NORDIC to be minimally (<18%) larger than for standard; an order of magnitude less than spatial smoothing by a 250 um FWHM kernel. The smoothness evoked by different K-ratios was negligible, but moderately lower in K = 11 (Fig. 3, Right), the previously determined optimal ratio (1, 2). NORDIC improved the variance of orientation preference mapping based on voxel-wise orientation-dependent CBV responses. It reduced the standard deviation of percent signal change estimations for each voxel, repetitively measured for the same orientation (Fig. 4B and 4C). Fitting a tuning curve yielded a smaller root-mean-square-error (RMSE) for NORDIC, indicating the goodness-of-fit improved at least 1.5 times relative to the standard (Fig. 4D).DISCUSSION
At the spatial resolutions needed to image neuronal activity of mesoscopic organizations simultaneously across cortical laminae and on the cortical surface, thermal noise dominates the fluctuations in an fMRI time series. Using NORDIC denoising to suppress zero-mean Gaussian distributed noise, which characterizes thermal noise, we demonstrate significant, increases in fCNR, and T-statistics with minimal increment of spatial smoothness for functional mapping of isoorientation domains in the cat visual cortex. NORDIC refines the signal stability of single fMRI acquisition to levels equivalent to 3-4 fold times averaging, enabling shorter acquisition times and mitigating trial-dependent instability.CONCLUSION
The efficacy of NORDIC denoising enables mapping mesoscopic scale cortical organizations in the mammalian neocortex, permitting more precise quantification of functional responses, better reproducibility and faster acquisitions.Acknowledgements
This work was supported by NIH grants: R01 MH111447, P41 EB027061 and P30 NS076408; and WM KECK foundation.References
1. Vizioli L, et al. (2020) A Paradigm Change in Functional Brain Mapping: Suppressing the Thermal Noise in fMRI. bioRxiv.
2. Moeller S, et al. (2020) NOise Reduction with DIstribution Corrected (NORDIC) PCA in dMRI with complex-valued parameter-free locally low-rank processing. NeuroImage:117539.
3. Veraart J, et al. (2016) Denoising of diffusion MRI using random matrix theory. Neuroimage 142:394-406.
4. Cox RW (1996) AFNI: software for analysis and visualization of functional magnetic resonance neuroimages. Computers and Biomedical research 29(3):162-173.
5. Villeneuve M, Vanni M, & Casanova C (2009) Modular organization in area 21a of the cat revealed by optical imaging: comparison with the primary visual cortex. Neuroscience 164(3):1320-1333.
6. Welvaert M & Rosseel Y (2013) On the definition of signal-to-noise ratio and contrast-to-noise ratio for fMRI data. PloS one 8(11):e77089.
Figures