2915
Enhanced conventional and ultrafast responses in preclinical functional MRI using MP-PCA denoising1Champalimaud Research, Champalimaud Centre for the Unknown, Lisbon, Portugal, 2Center of Functionally Integrative Neuroscience (CFIN) and MINDLab, Department of Clinical Medicine, Aarhus University, Aarhus, Denmark, 3Department of Physics and Astronomy, Aarhus University, Aarhus, Denmark
Synopsis
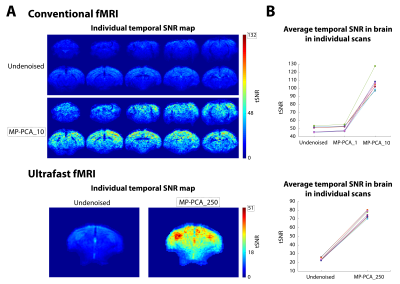
The MP-PCA denoising approach is an objective way to reduce fluctuations caused by thermal noise. In rodents, thermal noise in the coils is an important fMRI confounder that can reduce the accuracy of activation mapping. Here, we develop the MP-PCA denoising scheme for rodent fMRI. Data was obtained from 3 mice using conventional multislice and ultrafast acquisitions (1s and 50ms temporal resolution, respectively), during visual stimulation. MP-PCA denoising generated strong Fourier spectral amplitude increases in BOLD maps of 20% and 85% and tSNR increases of 100% and 275% for multislice and ultrafast data, respectively.
Introduction
Noise is a crucial limiting factor in MRI in general and functional MRI (fMRI) in particular. Whereas physiological noise is the most predominant in human fMRI studies, rodent fMRI suffers mostly from random signal fluctuations caused by thermal noise in the smaller coils. Given that BOLD responses are inherently small (~0.5-3%), data denoising in preclinical fMRI is critical. Several denoising approaches have been suggested to improve activation mapping1, including filtering2, ICA3 and the addition of nuisance regressors to GLM fitting4.Marchenko-Pastur Principal Component Analysis (MP-PCA) denoising, in particular, uses high redundancy in fMRI data to separate signal and (thermal) noise principal components by using random matrix theory5,6, thereby providing a way to remove thermal noise without requiring subjective user input, training data or accurate brain region segmentation7,8. Here, we evaluated MP-PCA denoising in mouse visual fMRI, for both conventional multislice “slow” acquisitions as well as more challenging ultrafast data9,10 (temporal resolution=50 ms).
Methods
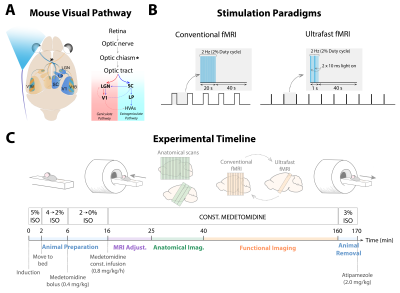
All animal experiments were carried out in accordance to European Directive 2010/63 and preapproved by the institutional and national authorities.Animal preparation: Adult C57BL/6 mice (n=3, male, ~25g, ~8weeks old) were prepared and kept under medetomidine sedation11 while breathing oxygen-enriched (28%) air (Fig.1C). Rectal temperature and respiratory rate were monitored and kept stable throughout the experiment.
MRI protocol: Animals were imaged in a 9.4T BioSpec scanner (Bruker, Karlsruhe, Germany) with an 86mm-ID quadrature resonator for RF transmission and a 10mm-loop surface coil for signal reception. A conventional multislice fMRI acquisition (GE-EPI: TR/TE=1000/15ms, FOV=16x12mm2, in-plane resolution=145x145µm2, slice thickness=0.5mm, 10 slices, NReps=340, tacq=5min40s) and an ultrafast fMRI acquisition with one oblique slice capturing the entire visual pathway9 (GE-EPI: TR/TE=50/17.5ms, FOV=16x12.35mm2, resolution=167x167µm2, slice thickness=1mm, NReps=9000, tacq=7min30s) were performed.
Visual stimulation: Left eye stimulation (frequency=2Hz; pulse width=10ms) was performed using a 470nm blue LED (Fig.1A). The stimulation paradigms consisted of five blocks of 20s stimulation and 40s rest for conventional fMRI, and ten cycles of 1s stimulation and 40s rest for ultrafast fMRI (Fig.1B). Both acquisitions were alternated and repeated 2-4 times/animal, and separated by a resting period of at least 6min to avoid habituation.
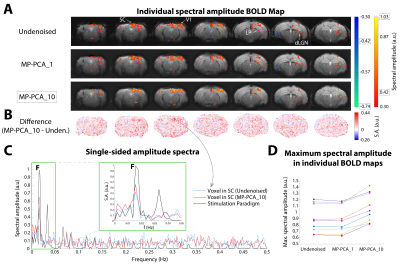
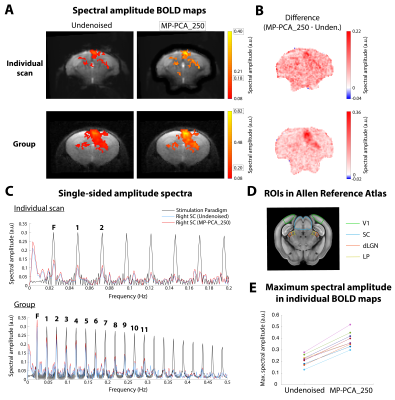
Data analysis: After manual correction of outliers (<0.7% of datapoints), data was MP-PCA denoised at the slice level using a [6,6] sliding window. For conventional fMRI, the redundant dimension included either the entire time-series at once (MP-PCA_1), or the data was “chunked” into 10 time-blocks (34 frames each) and each was denoised separately (MP-PCA_10). For ultrafast fMRI, 250 time-blocks of data (36 frames each) were denoised one at a time (MP-PCA_250). Further pre-processing included slice-timing correction (only for multislice data), motion correction, animal registration to the Allen Reference Atlas12 and smoothed with a 1-voxel isotropic Gaussian kernel. To avoid HRF- and GLM-related a-priori assumptions, a data-driven Fourier approach was performed13, where the power at the paradigm’s fundamental frequency (and two first harmonics in case of ultrafast data) was mapped voxelwise to detect activated areas. A minimum cluster size of 10 (conventional fMRI) or 8 (ultrafast fMRI) voxels was imposed. Temporal SNR in the brain was calculated from a resting period in the middle of both acquisitions.
Results
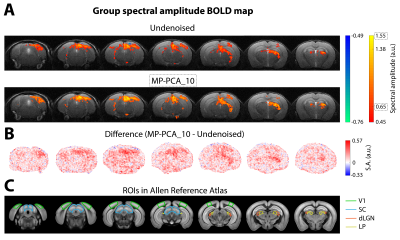
Fourier maps obtained for the conventional “slow” (Figs.2A,3A) and ultrafast (Fig.4A) data show robust BOLD responses along the entire mouse visual pathway upon monocular flashing stimulation, mostly on the contralateral side. The MP-PCA_1 denoising scheme did not show any improvement compared to the undenoised case (Fig.2A,D). In contrast, the MP-PCA_10 denoising scheme led to ~20% higher amplitude at the fundamental frequency in the individual (Fig.2A,C,D) and group (Fig.3A) maps. The increase is brain-wide, but occurs at a larger scale in the entire visual pathway (Figs.2B,3B). Similar results were obtained for the single-slice ultrafast individual and group data when using MP-PCA_250 denoising (Fig.4A), with maximum spectral amplitude increases of ~85% in individual maps (Fig.4E), and stronger increases detected mostly in subcortical pathway areas (Fig.4B). Moreover, group averaging led to the appearance of 9 more harmonics in the amplitude spectrum of the right SC, which all increased in magnitude upon denoising (Fig.4C). Fig.5B shows that average brain tSNR increased ~100% in conventional fMRI data and ~275% in ultrafast data upon MP-PCA denoising, with larger increases detected in the cortex (Fig.5A).Discussion
Here, we show that preclinical rodent fMRI mapping significantly benefits from MP-PCA denoising both when conventional multislice and ultrafast fMRI acquisitions are considered. Chunking the data into time-blocks with a size that was closer to the sliding window dimension (36 voxels) was imperative to satisfy the MP-PCA assumptions. Given MP-PCA denoising’s efficacy in ultrafast fMRI data (which has an inherently lower SNR due to rapid acquisition and T1 relaxation), our study suggests that higher temporal and spatial resolutions may be now more readily achievable. It should be noted that spatial correlations introduced by EPI data regridding are a confounder in this study, since they reduce the independence of the data. Therefore, the application of denoising before regridding or the use of imaging sequences avoiding spatial interpolation should be considered in the future.Conclusion
MP-PCA denoising objectively removes thermal noise and improves sensitivity to BOLD activation. This bodes well for dramatically enhancing spatial and/or temporal resolution for future fMRI work.Acknowledgements
This study was funded by the European Research Council (ERC) (agreement No. 679058) and by Champalimaud Foundation. The authors acknowledge the vivarium of the Champalimaud Centre for the Unknow, a facility of CONGENTO which is a research infrastructure co-financed by Lisboa Regional Operational Programme (Lisboa2020), under the PORTUGAL 2020 Partnership Agreement, through the European Regional Development Fund (ERDF) and Fundação para a Ciência e Tecnologia (Portugal) under the project LISBOA-01-0145-FEDER-022170.References
1. Caballero-Gaudes C, Reynolds RC. Methods for cleaning the BOLD fMRI signal. NeuroImage. 2017;154:128-149. doi:10.1016/j.neuroimage.2016.12.0182.
2. Smith SM, Brady JM. SUSAN - A new approach to low level image processing. International Journal of Computer Vision. 1997;23(1):45-78. doi:10.1023/A:10079638247103.
3. Beckmann CF, Smith SM. Probabilistic Independent Component Analysis for Functional Magnetic Resonance Imaging. IEEE Transactions on Medical Imaging. 2004;23(2):137-152. doi:10.1109/TMI.2003.8228214.
4. Kay KN, Rokem A, Winawer J, Dougherty RF, Wandell BA. GLMdenoise: a fast, automated technique for denoising task-based fMRI data. Frontiers in Neuroscience. 2013;7:247. doi:10.3389/fnins.2013.002475.
5. Veraart J, Novikov DS, Christiaens D, Ades-aron B, Sijbers J, Fieremans E. Denoising of diffusion MRI using random matrix theory. NeuroImage. 2016;142:394-406. doi:10.1016/j.neuroimage.2016.08.0166.
6. Veraart J, Fieremans E, Novikov DS. Diffusion MRI noise mapping using random matrix theory. Magnetic Resonance in Medicine. 2016;76(5):1582-1593. doi:10.1002/mrm.260597.
7. Adhikari BM, Jahanshad N, Shukla D, et al. A resting state fMRI analysis pipeline for pooling inference across diverse cohorts: an ENIGMA rs-fMRI protocol. Brain Imaging and Behavior. 2019;13(5):1453-1467. doi:10.1007/s11682-018-9941-x8.
8. Ades-Aron B, Lemberskiy G, Veraart J, et al. Improved Task-based Functional MRI Language Mapping in Patients with Brain Tumors through Marchenko-Pastur Principal Component Analysis Denoising. Radiology. 2020:200822. doi:10.1148/radiol.20202008229.
9. Gil R, Fernandes FF, Shemesh N. Neuroplasticity-driven timing modulations revealed by ultrafast functional magnetic resonance imaging. NeuroImage. 2021;225. doi:10.1016/j.neuroimage.2020.11744610.
10. Lee HL, Li Z, Coulson EJ, Chuang KH. Ultrafast fMRI of the rodent brain using simultaneous multi-slice EPI. NeuroImage. 2019;195:48-58. doi:10.1016/j.neuroimage.2019.03.04511.
11. Adamczak JM, Farr TD, Seehafer JU, Kalthoff D, Hoehn M. High field BOLD response to forepaw stimulation in the mouse. NeuroImage. 2010;51(2):704-712. doi:10.1016/j.neuroimage.2010.02.08312.
12. Lein ES, Hawrylycz MJ, Ao N, et al. Genome-wide atlas of gene expression in the adult mouse brain. Nature. 2007;445(7124):168-176. doi:10.1038/nature0545313.
13. Nunes D, Ianus A, Shemesh N. Layer-specific connectivity revealed by diffusion-weighted functional MRI in the rat thalamocortical pathway. NeuroImage. 2019;184:646-657. doi:10.1016/j.neuroimage.2018.09.050.
Figures
