2914
Denoise functional magnetic resonance imaging with variance-stabilizing transformation and optimal singular value shrinkage (VST-SVS)1University of Minnesota, Minneapolis, MN, United States
Synopsis
High-resolution fMRI is largely hindered by random thermal noise. In this study, we propose a denoising method to reduce such noise in magnitude fMRI data. The proposed method synergistically combines: 1) variance-stabilizing transformation to convert Rician data to Gaussian-like data, 2) principle-component-analysis-based denoising algorithm with optimal singular value shrinkage to remove noise, and 3) patch-based implementation with tunable Gaussian weighting to tradeoff between functional sensitivity and specificity. Our results using synthetic and in-vivo cat task fMRI data show that the denoising method can effectively remove Rician noise, promoting functional fidelity and sensitivity in comparison to existing denoising methods.
Introduction
Random thermal noise dominates high-resolution blood-oxygenation-level-dependent (BOLD) based functional magnetic resonance imaging (fMRI)1. One approach for suppressing Gaussian distributed noise is the recently introduced NORDIC approach applied to complex data2,3. However, the majority of fMRI data are in magnitude, following a Rician distribution4. To deal with this challenge, we have previously proposed a denoising framework that adopts variance stabilizing transformation (VST)5 to convert Rician data into Gaussian-like data and demonstrated its utility for denoising magnitude diffusion images6. In this work, we investigate how this denoising framework can be further tailored to improve image quality for high-resolution magnitude fMRI data. In particular, the denoising module involved was improved by: 1) combining newly established multiple criteria7 (intended for robust rank and noise estimation) with the optimal singular value shrinkage (SVS)8 to form a well-grounded PCA-based denoising algorithm, and 2) incorporating Gaussian weighting into patch averaging to tradeoff between functional sensitivity and specificity. The effectiveness of our method, dubbed VST-SVS, is demonstrated using synthetic and in-vivo cat task fMRI data and by comparing to existing methods applied on magnitude data.Materials and Methods
Simulation experiments: BOLD fMRI data were simulated to mimic in-vivo cat experimental acquisitions at 9.4T with two major modules: 1) BOLD simulation, and 2) receive B1 sensitivity simulation. The BOLD simulation was performed in POSSUM9 to create BOLD signals in response to prescribed activation in the cat visual cortex while the receive B1 simulation conducted by solving the Biot-Savart law equation10 to approximate the spatially varying B1 map for the surface loop RF coil as used in the in-vivo experiment. The noisy fMRI timeseries were synthesized by contaminating the noise-free fMRI data with Rician noise.In-vivo experiments: A female cat (1.8 kg) was scanned with a protocol approved by the University of Minnesota IACUC. The cat was anesthetized and mechanically ventilated with well controlled physiology throughout the study. A 1.5-cm diameter surface coil and a binocular full-field visual stimulation with block design (20s-15s-25s-15s-25s) were used. BOLD fMRI timeseries were acquired using a 2D GE-EPI sequence with TR/TE = 2000/20 ms, FOV = 2.0×2.0 cm2, flip angle = 40o, in-plane resolution = 0.156 mm, slice thickness = 0.5 mm. A total of 20 runs, each comprising 51 image volumes, were obtained.
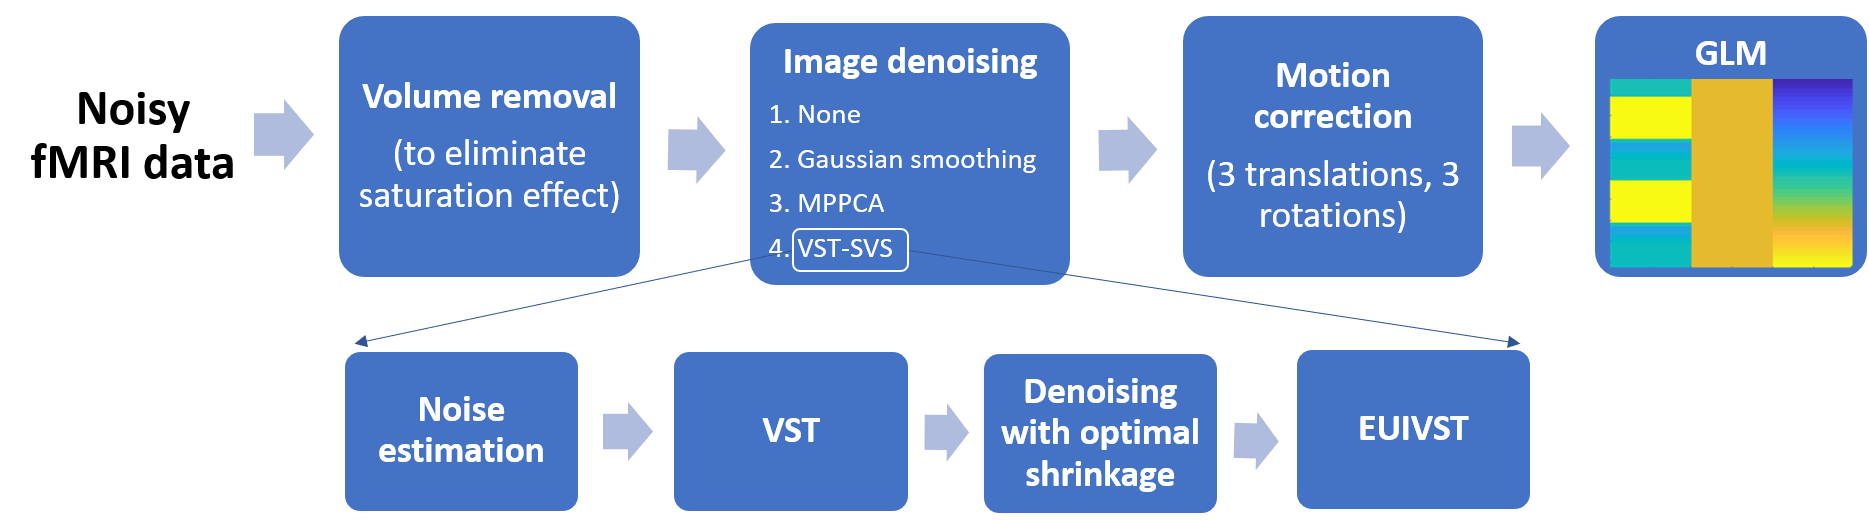
fMRI data processing pipeline: The fMRI data processing pipeline (Fig. 1) involved four successive processing modules: 1) volume removal, 2) image denoising, 3) motion correction, and 4) GLM fitting. For the “image denoising” module, four scenarios were tested: 1) no denoising (None) when this module was skipped, 2) conventional Gaussian smoothing11, 3) Marchenko-Pastur PCA (MPPCA) based denoising12, and 4) VST-SVS. VST-SVS consisted of four steps: i) noise estimation, ii) VST, iii) denoising with the optimal SVS algorithm, and iv) exact unbiased inverse VST (EUIVST), all implemented using a patch processing. The Gaussian weighting incorporated into the patch averaging of step 3 was tuned by adjusting a single hyperparameter α to tradeoff between SNR gain and image “sharpness”. Particularly, three levels of Gaussian weighting were considered: 1) patch averaging without Gaussian weighting (α = 0), 2) patch averaging with window-size matched Gaussian weighting (α = 4), and 3) no patch averaging (α = 400).
Results
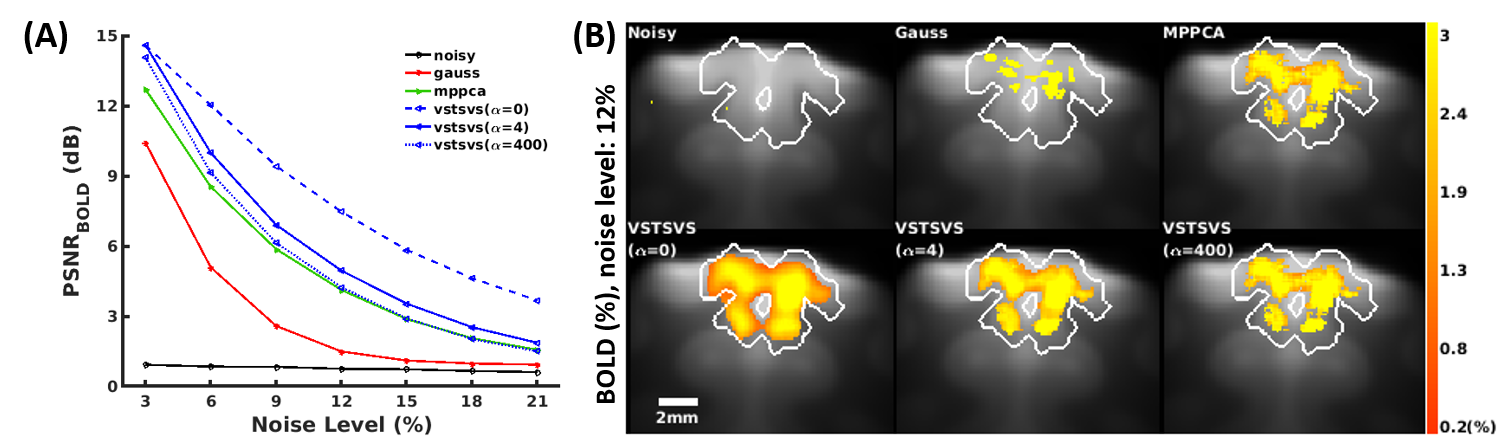
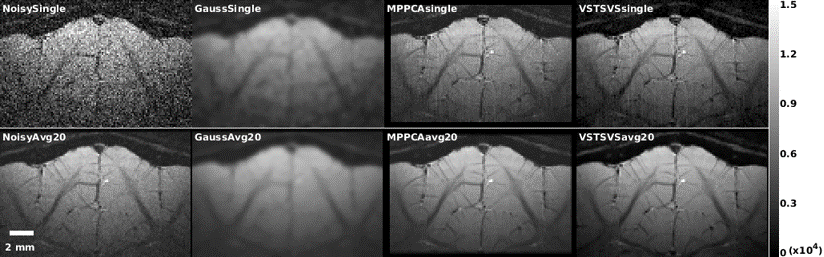
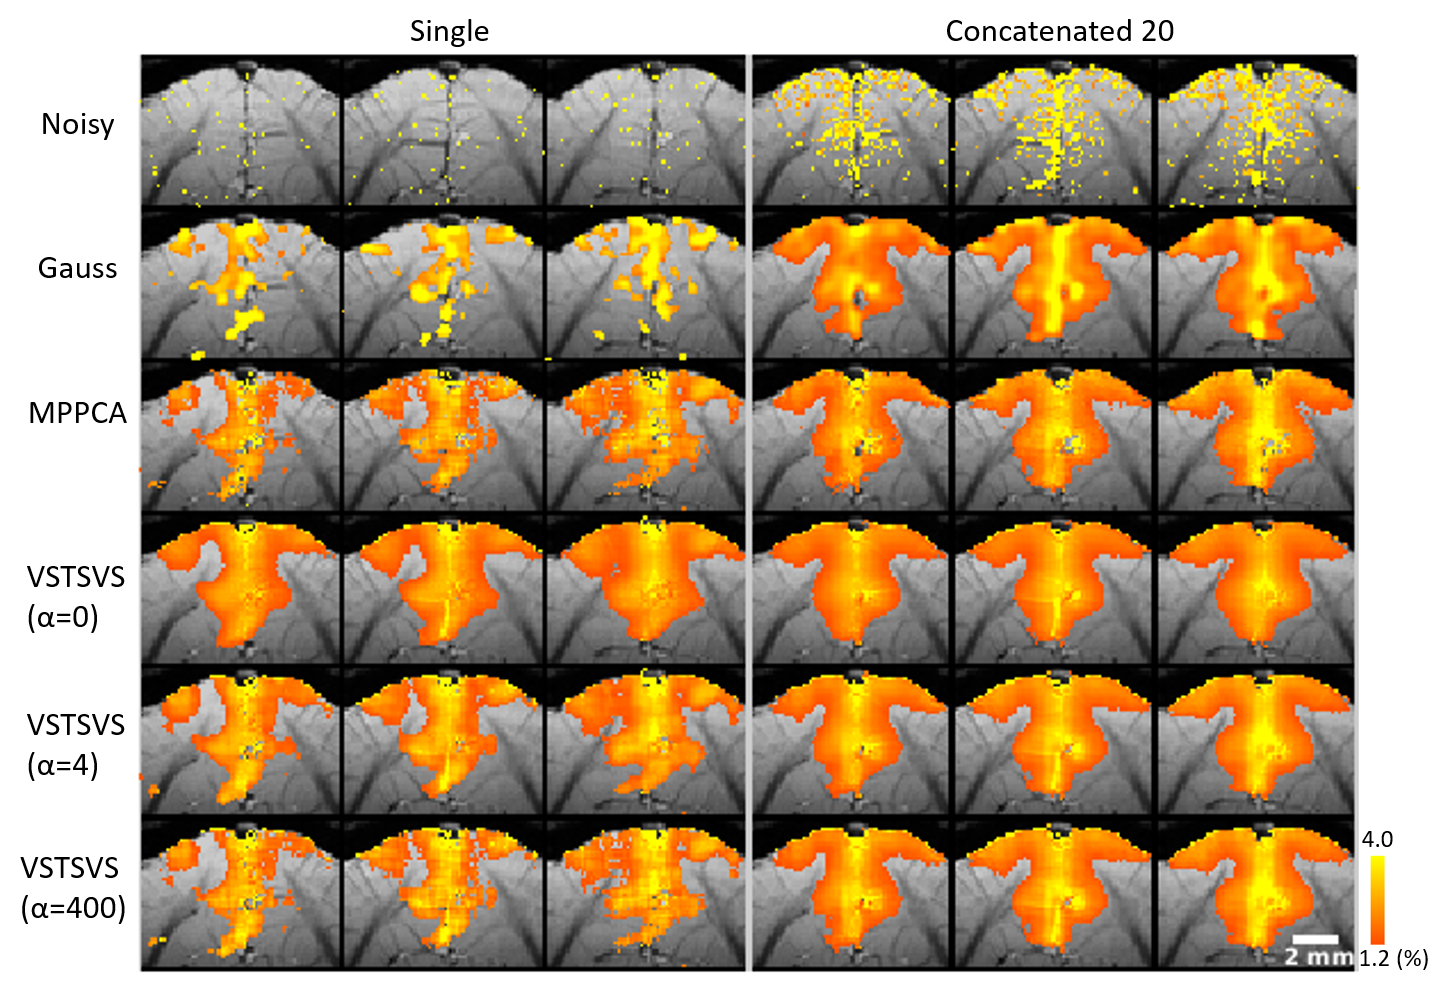
The use of VST-SVS to denoise synthesized cat fMRI data enhanced image recovery and functional fidelity (Fig. 2), leading to increased peak SNR of BOLD signal (PSNRBOLD) across the entire range of noise levels under consideration and the most expansive BOLD activation map inside the prescribed activation regions in the cat visual cortex compared to those derived from Gaussian smoothing and MPPCA.Likewise, VST-SVS (with α=4 for a good balance between functional sensitivity and specificity) substantially suppressed random noise in in-vivo fMRI data, improving the image quality of a single run to a level visually comparable to that of 20 runs without denoising (Fig. 3). Correspondingly, statistical estimates after GLM were improved, leading to enhanced BOLD percent changes (Fig. 4). With patch averaging only, the BOLD activation areas were detected to a level visually comparable in size to what was achievable with Gaussian smoothing but using all 20 runs.
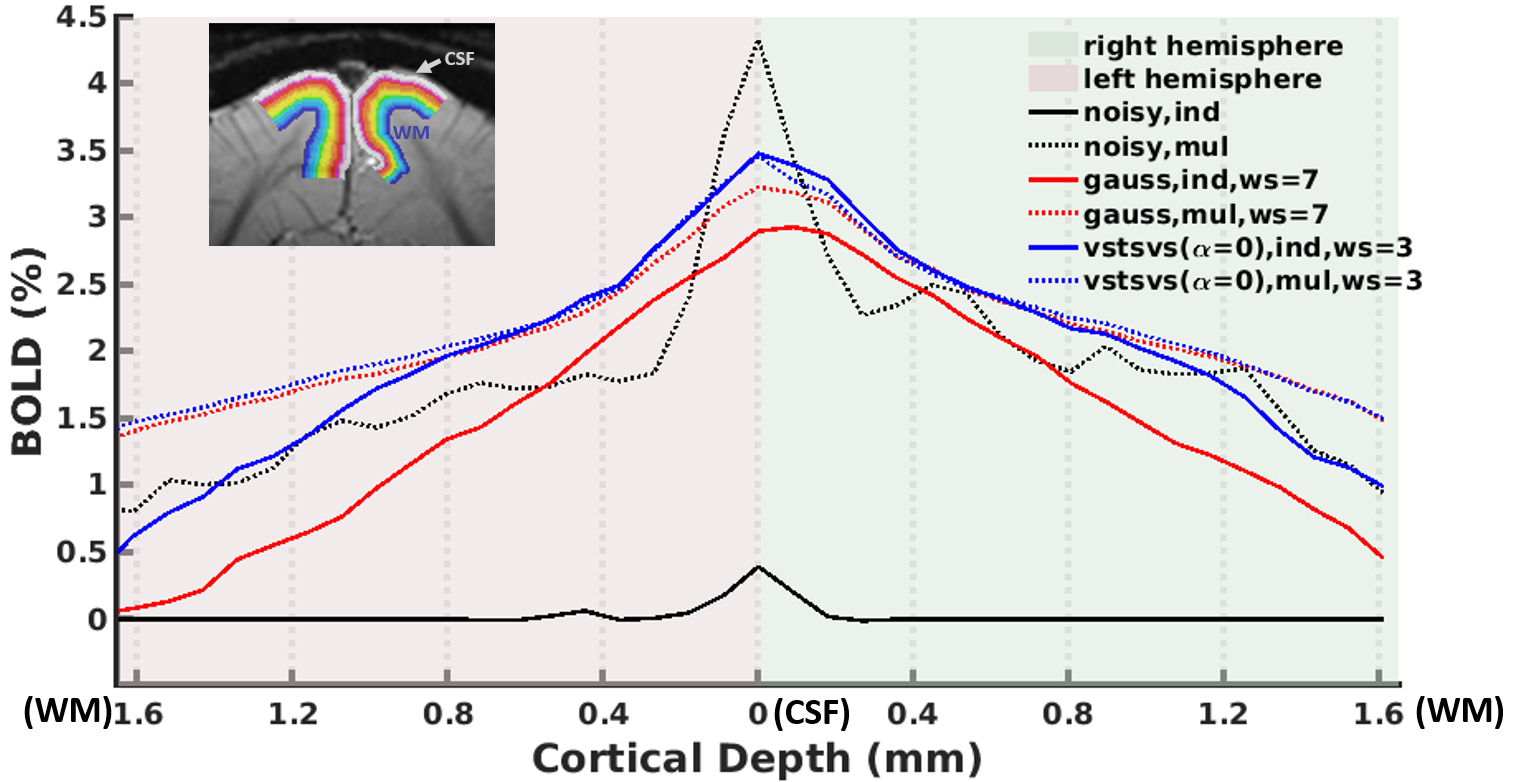
The utility of VST-SVS was further demonstrated by laminar BOLD analysis (Fig. 5) showing that the use of VST-SVS to denoise a single-run data strengthened BOLD percent changes at each cortical depth and in both hemispheres, yielding an overall laminar BOLD profile that appeared comparable to what was achievable with averaging 20 runs using Gaussian smoothing, especially in the superficial layers close to CSF.
Discussion and conclusion
We have demonstrated a comprehensive denoising method to improve the image quality for task functional MRI by reducing thermal noise. Our method can effectively remove the negative impact of Rician noise, thereby promoting image recovery and enhancing functional fidelity and sensitivity of the fMRI data in comparison to existing denoising methods. Most notably, the use of our method to denoise single average data can increase the performances for estimation of BOLD activations to a level comparable to what is achievable with 20 averages but using conventional Gaussian smoothing. We expect that our method will play an important role in leveraging high-quality, high-resolution task fMRI, which is desirable in many neuroscience and clinical applications.Acknowledgements
This work was supported in part by NIH grants of R01 MH111413, R01 NS118330, U01 EB026978, U01 EB025144, P41 EB027061 and P30 NS076408.References
1 Liu, T. T. Noise contributions to the fMRI signal: An overview. Neuroimage 143, 141-151, doi:10.1016/j.neuroimage.2016.09.008 (2016).
2 Vizioli, L. et al. A Paradigm Change in Functional Brain Mapping: Suppressing the Thermal Noise in fMRI. bioRxiv, doi:10.1101/2020.11.04.368357 (2020).
3 Moeller, S. et al. NOise Reduction with DIstribution Corrected (NORDIC) PCA in dMRI with complex-valued parameter-free locally low-rank processing. Neuroimage, 117539, doi:10.1016/j.neuroimage.2020.117539 (2020).
4 Gudbjartsson, H. & Patz, S. The Rician distribution of noisy MRI data. Magn Reson Med 34, 910-914 (1995).
5 Foi, A. Noise Estimation and Removal in Mr Imaging: The Variance-Stabilization Approach. 2011 8th Ieee International Symposium on Biomedical Imaging: From Nano to Macro, 1809-1814 (2011).
6 Ma, X., Ugurbil, K. & Wu, X. Denoise magnitude diffusion magnetic resonance images via variance-stabilizing transformation and optimal singular-value manipulation. Neuroimage 215, 116852, doi:10.1016/j.neuroimage.2020.116852 (2020).
7 Capitaine, M. & Casalis, M. Asymptotic freeness by generalized moments for Gaussian and Wishart matrices. Application to beta random matrices. Indiana U Math J 53, 397-431, doi:DOI 10.1512/iumj.2004.53.2325 (2004).
8 Gavish, M. & Donoho, D. L. Optimal Shrinkage of Singular Values. Ieee T Inform Theory 63, 2137-2152, doi:10.1109/Tit.2017.2653801 (2017).
9 Drobnjak, I., Gavaghan, D., Suli, E., Pitt-Francis, J. & Jenkinson, M. Development of a functional magnetic resonance imaging simulator for modeling realistic rigid-body motion artifacts. Magnet Reson Med 56, 364-380, doi:10.1002/mrm.20939 (2006).
10 Giovannetti, G. et al. Simulation, design, and test of an elliptical surface coil for magnetic resonance imaging and spectroscopy. Concept Magn Reson B 47b, doi:ARTN e21361 10.1002/cmr.b.21361 (2017).
11 Huettel, S. A., Song, A. W. & McCarthy, G. Functional magnetic resonance imaging. Vol. 1 (Sinauer Associates Sunderland, MA, 2004). 12 Veraart, J. et al. Denoising of diffusion MRI using random matrix theory. Neuroimage 142, 384-396, doi:10.1016/j.neuroimage.2016.08.016 (2016).
Figures