2913
Comparison of 2D-EPI, 3D-EPI and ERASE in terms of physiological noise, SNR and tSNR1Biomedical Institute for Convergence at SKKU, Sungkyunkwan University, Suwon, Korea, Republic of, 2Center for Neuroscience Imaging Research, Institute for Basic Science, Suwon, Korea, Republic of, 3Department of Biomedical Engineering, Sungkyunkwan University, Suwon, Korea, Republic of, 4Department of Intelligent Precision Healthcare Convergence, Sungkyunkwan University, Suwon, Korea, Republic of
Synopsis
Recently we proposed an ultrafast 3D gradient-echo imaging sequence using spatiotemporal-encoding (SPEN), called ERASE (Equal-TE Rapid Acquisition with Sequential Excitation), which has high tolerance to B0 inhomogeneities. Here, we investigated the noise characteristics, SNR, and tSNR of ERASE with rat brain imaging at 9.4T at high spatial resolution, in comparison with 2D and 3D gradient-echo EPI. While ERASE provided better tSNR than both of them, it provided intermediate SNR between them. The ratio of physiological and thermal noise (σP/σ0) and lambda (λ) were smaller in ERASE than 2D and 3D-EPI mainly due to its robustness against B0 inhomogeneity.
Introduction
We recently proposed an ultrafast 3D gradient-echo imaging sequence using spatiotemporal encoding (SPEN) with constant TE, called ERASE (Equal-TE Rapid Acquisition and Sequential Excitation)1, which has high immunity to B0 inhomogeneities. We previously reported that ERASE provides higher SNR, tSNR and t-score maps than multislice 2D gradient-echo EPI (GE-EPI) when thermal noise is more dominant than physiological noise,1 e.g., in high spatial resolution. In this work, we examined the noise characteristics such as the ratio of physiological and thermal noise (σP/σ0), lambda (λ), SNR and tSNR of ERASE in in vivo rat brain imaging at 9.4T, in comparison with 2D-EPI and 3D-EPI.Method
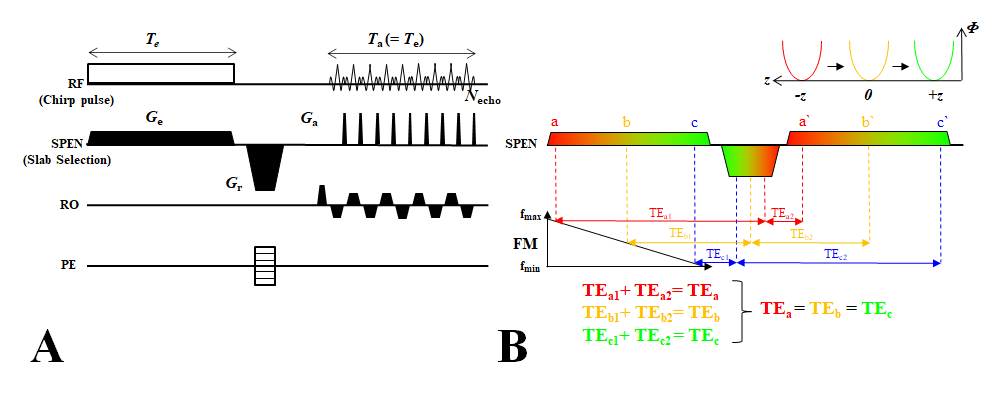
Sequence: Figure1 illustrates the ERASE sequence diagram (A) and schematic representation of its sequential and local excitation and rephasing mechanism in the SPEN direction (B). ERASE provides a constant TE across slices via the insertion of a rephasing gradient between spin excitation and acquisition processes along the SPEN direction.1 Experiment: In vivo rat brain imaging was performed at 9.4T (BioSpec, Bruker). Four male Sprague Dawley (SD) rats (280–310 g, 8–9 weeks of age) were used with the approval of the Institutional Animal Care and Use Committee (IACUC) at Sungkyunkwan University. Three imaging sequences of ERASE, 2D-EPI and 3D-EPI were simultaneously applied to each rat and 30 volumes were acquired with each sequence. Scan parameters are summarized in Table 1. ERASE was reconstructed offline with MATLAB (ver.8.2.0; R2013b) using the superresolution(SR) algorithm by Chen et. al.3 in the SPEN direction.Data analysis: To reduce the effect of head motion, image registration in each time series was performed with a reference to the first image using SPM8 motion-correction software. Noise characteristics were analyzed based on evaluation of SNR and tSNR. The ratio of physiological thermal noise (sP/s0) was evaluated to assess the relative contribution of physiological and thermal processes to each imaging technique by the following equation:
$$\frac{\sigma_{p}}{\sigma_{o}}=\sqrt{(\frac{SNR_{o}}{tSNR})^{2} - 1} .[1]$$
Here, SNR0 was calculated pixelwise by dividing each pixel value by the standard deviation of background noise (s0). tSNR was also calculated pixelwise by dividing the mean pixel value across the 30 time-series images by the temporal fluctuations (sF), where σF2 = σP2 + σ02. On the other hand, σP is commonly expressed as λ×S (λ, constant; S, the temporal mean signal)4, where λ represents a measure of SNR degradation by signal-dependent fluctuations and can be determined by the relationship between tSNR and SNR0:4,5
$$tSNR=\frac{SNR_{0}}{\sqrt{1+\lambda^{2}SNR_{0}^{2}}} .[2]$$
Results
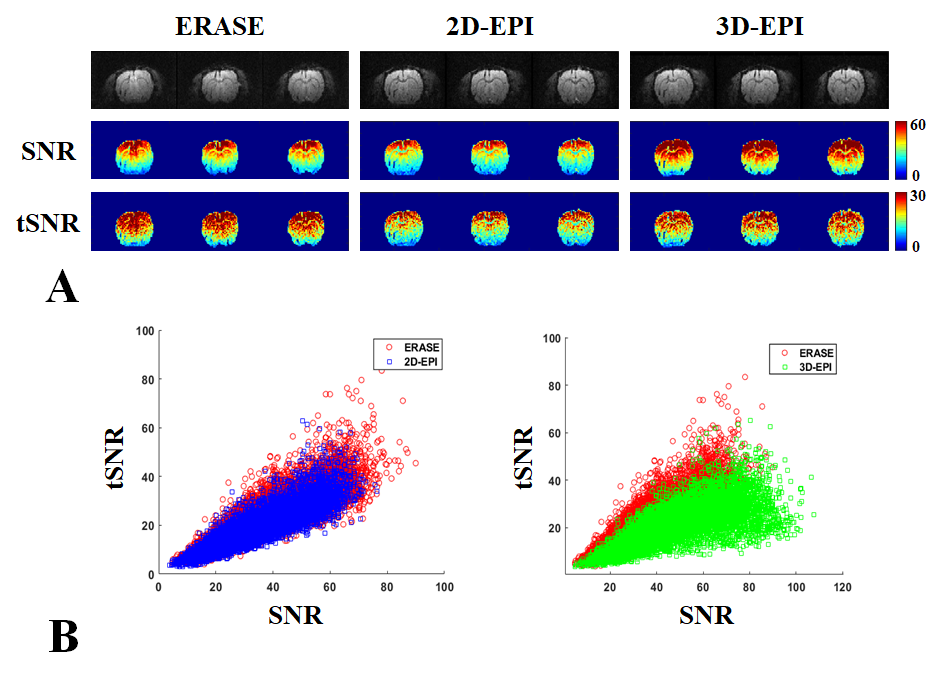
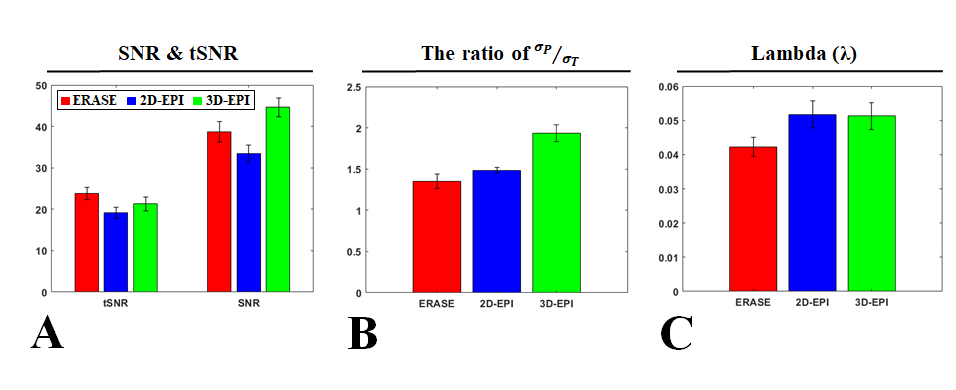
Fgiure 2A shows presents the tSNR and SNR maps of three center slices selected from rat brain images obtained using 2D GE-EPI, 3D GE-EPI and ERASE. Image intensities were scaled within a range of 0–60 in the SNR map, and 0–30 in the tSNR map. For better representation, the scatter plots of all tSNR and SNR values in the whole brain were also presented (Fig.2B). Overall, ERASE provided better tSNR than 2D and 3D GE-EPI, whereas it provided intermediate SNR between them. In Fig.3A, the mean SNR and tSNR values were plotted in a bar graph by averaging all the results over the whole brain, as obtained from four rats. σP/σ0 and l were also presented in a bar graph (Figs. 3B, C). The σP/σ0 and l values of ERASE were lower than 2D and 3D GE-EPI.Discussion & Conclusion
Here, we compared ERASE with 2D and 3D GE-EPI in terms of noise characteristics, SNR and tSNR ERASE provided better tSNR than both of them and intermediate SNR between them, and showed lower σP/σ0 and l values, which closely relate to physiological noise, than both 2D and 3D GE-EPI. It is interesting to note that the physiological noise contribution to ERASE is less than 2D GE-EPI because 3D GE-EPI is generally known to have more physiological noise than 2D GE-EPI.5 In addition, from the fact that l showed a similar value in 2D and 3D GE-EPI, it is inferred that thermal noise was dominant over physiological noise due to high spatial resolution in this study. The reason why ERASE had less physiological noise contribution might be understood in the following respects: 1) Less sensitivity to the breathing-induced B0 modulation over the whole brain owing to its robustness against B0 inhomogeneity. 2) Less sensitivity to EPI artifacts such as Nyquist ghosting and image distortion, which are the main sources of signal fluctuations. A further study is needed to investigate the dependence on a field strength and spatial resolution.Acknowledgements
This work was supported by NRF-2019M3C7A1031993 and IBS-R015-D1.References
[1] Ryu J-K et al. An equal-TE ultrafast 3D gradient-echo imaging method with high tolerance to magnetic susceptibility artifacts: Application to BOLD functional MRI. Magnetic resonance in medicine. 2020; DOI: 10.1002/mrm.28564.
[2] Ryu J-K et al. A new ultrafast 3D gradient echo-based imaging method using quadratic-phase encoding. Magnetic resonance in medicine. 2019;82(1):237-250.
[3] Chen Y et al. Partial fourier transform reconstruction for single-shot MRI linear frequency-swept excitation. Magnetic resonance in medicine. 2013;69:1326-1336.
[4] Kruger G and Glover GH, Physiological noise in oxygenation-sensitive magnetic resonance imaging. Magnetic resonance in medicine. 2001;46:631-637.
[5] van der Zwaag W et al. Temporal SNR Characteristics in Segmented 3D-EPI at 7T. Magnetic resonance in medicine. 2012;67:344-352.
[6] Wald LL et al. Impacting the effect of fMRI noise through hardware and acquisition choices – Implications for controlling false positive rates. Neuroimage 2017;154:15-22.
Figures