2912
High Resolution EPI-based rs-fMRI Performed at 21.1 T1National High Magnetic Field Laboratory, Florida State University, Tallahassee, FL, United States, 2Chemical & Biomedical Engineering, FAMU-FSU College of Engineering, Tallahassee, FL, United States
Synopsis
This study utilizes resting-state (rs)-fMRI and graph theory as methods for detecting functional recovery following ischemia. rs-fMRI was performed at 21.1 T on an ischemic rat model and naïve controls. Current data shows correlations in multiple areas of the brain indicating differences between hemispheres for the parameters observed.
Purpose
Stroke is the fifth cause of death and a leading cause of disability in the United States1. It is characterized by a sudden onset of numbness or weakness, especially on one side of the body, confusion or trouble speaking and understanding speech, dizziness, or sudden headache2. This study utilizes a middle cerebral arterial occlusion (MCAO) to induce an ischemic stroke, which has been instituted in rats as a reliable model of large artery occlusion in humans3. To assess recovery, this project focuses on functional Magnetic Resonance Imaging (fMRI) at 21.1 T assessed in the resting state. Specifically, resting state fMRI (rs-fMRI) scans were acquired at 60-70 breaths/min without stimulation to establish the default mode network (DMN). Accurately identifying changes to the DMN over time may reflect compensatory mechanisms at play in ischemic stroke as well as the effectiveness of interventions intended to restore or salvage tissue, mirroring the utility of rs-fMRI to characterize other neurological states4.Methods
Animal Model: Male Sprague Dawley rats (220-250g) were induced with 5% and maintained at 2% isoflurane. A rubber-coated filament (Doccol Corp.) was guided 1.9 cm through the external carotid artery until the middle cerebral artery (MCA) was blocked and blood flow interrupted to the brain. This transient Middle Cerebral Artery Occlusion (MCAO) was instituted for 1 h to achieve an ischemic lesion followed by reperfusion after removal of the filament. These MCAO animals are compared to naïve and sham cohorts.MR Techniques: Using the 21.1-T ultra-wide bore magnet at the US National High Magnetic Field Laboratory and linear 1H/23Na birdcage coil, high resolution images were acquired up to 21 days post-MCAO. rs-fMRI data was acquired with a multi-slice 2D EPI scan. Four segments were used to reduce EPI distortions to an acceptable level. Each rat was imaged with an in-plane resolution of 250x250 µm, matrix size of 128x96, slice thickness of 1 mm, repetition time of 2.5 s, echo time of 12 ms and 300 repetitions resulted in an acquisition time of 50 minutes (10 s/repetition).
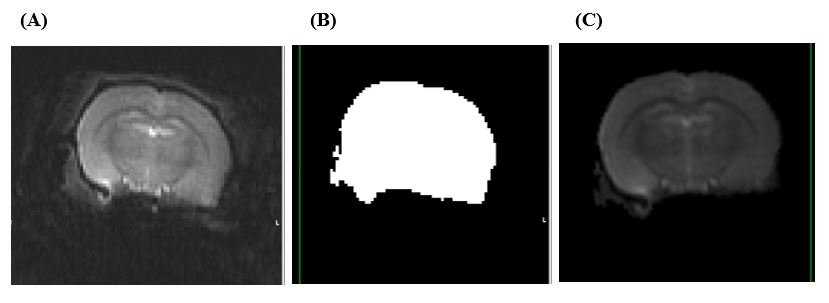
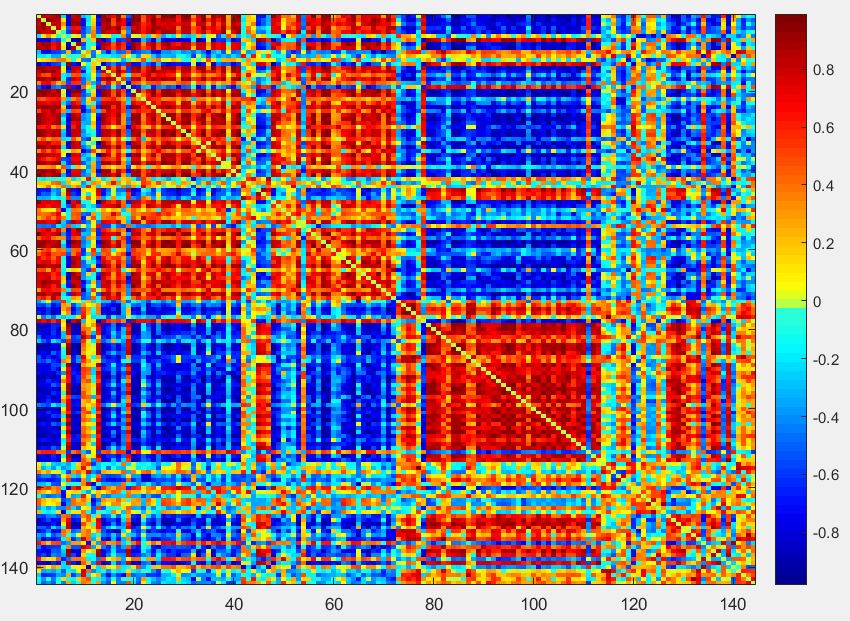
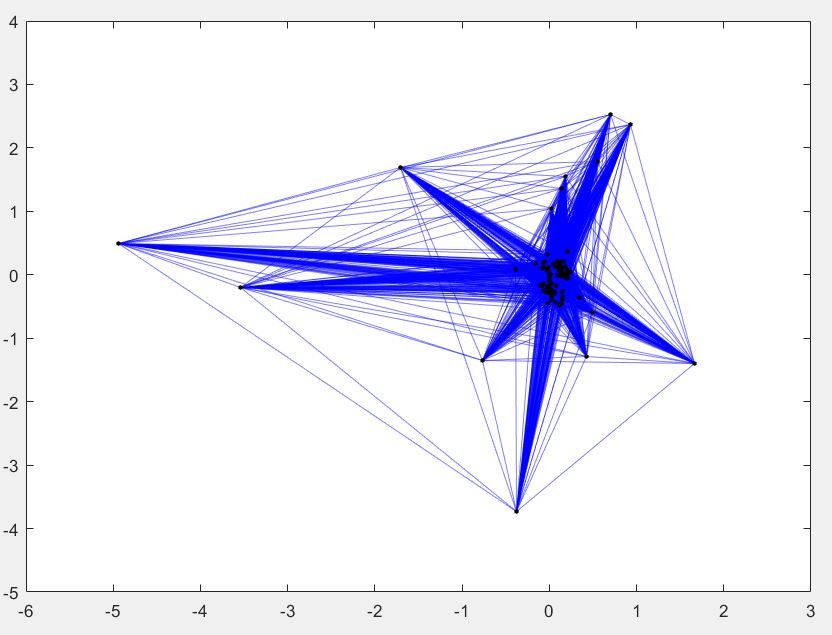
Data Analysis: fMRI was processed using Advanced Normalization Tools (ANTs), fMRI Software Library (FSL), and Analysis of Functional Neuroimages (AFNI). A N4 bias field correction and down sampling (via FSL FLIRT) on a single repetition to the Waxholm-Ferris (WF) rat brain atlas was applied to the raw data to output a reference image correctly aligned and oriented to the known animal model. The dataset then underwent slice timing correction, motion correction, masking and linear regression before using the reference image from a single repetition during data preparation. The final image processing step includes applying a bandpass filter to the entire dataset before anatomically referenced ROI placement and creating a Pearson Correlation adjacency matrix. The adjacency matrix then was analyzed to extract graph properties including: Degree, Clustering Coefficient, Centrality (betweenness, closeness, eigenvector & harmonic), Eccentricity, Global and Local Efficiency, and Characteristic Path Length. A one-way ANOVA with a least significant difference post-hoc test was applied to determine statistical significance among samples (p<0.05).
Results & Discussion
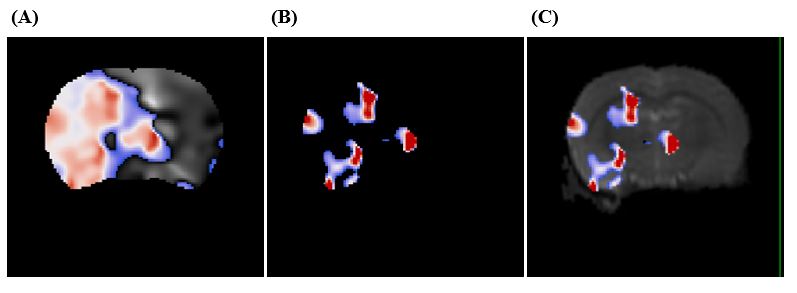
Currently acquired data looks at acute functional time points (Days 1, 3, 5, 7, 9, 14, and 21 post-stroke) of naïve rats. Current acquisition of hMSC treated rats is underway. Functional activation can be seen in the MELODIC report. The selection of time points is due to sample size limitations, and will be expanded for broader study of ischemic stroke recovery out to day 21. Figure 1 shows a sample of the EPI processing for anatomical referencing and image alignment/correction while Figure 2 shows that resting-state activation can be localized to specific regions. Region specific correlations can be seen in Figure 3 as well as typical hemispheric dependence.Upcoming goals include additional data collection to improve sample size (increasing margin of significance), and processing data via the established pipeline. All processed data then will be analyzed and compared across cohorts to establish any group-level patterns. This work will provide conclusions on the efficacy of stem cell treatment in functional recovery of MCAO rats with attention to any hemispheric differences, which have been observed in processed data to date.
Conclusion
By coupling rs-FMRI and network theory, this method should prove reliable in detect improved activation correlations throughout the brain in ischemic rats. Future work will extend this study by incorporating hMSC treatment results. Additionally, this work will help to expand the application of fMRI and network theory to identification and treatment efficacy of other neurodegenerative diseases.Acknowledgements
This work was supported by the US National High Magnetic Field Laboratory, which is supported by the National Science Foundation (DMR-1644779) and the State of Florida. Support also was provided by the US NIH (R01-NS102395).References
1. American stroke association: About stroke. American Stroke Association Web site. https://www.stroke.org/en/about-stroke. Accessed 1/22/, 2020.
2. Stroke information page. National Institute of Health Web site.
3. Yang S, Shetty R, Liu R, Sumien N, Heinrich KR, Rutledge M, Thangthaeng N, Brun-Zinkernagel A & Forster MJ. Endovascular middle cerebral artery occlusion in rats as a model for studying vascular dementia. AGE. 2006;28(3):297-307. https://www.ncbi.nlm.nih.gov/pubmed/22253496. doi: 10.1007/s11357-006-9026-4.
4. Esménio S, Soares JM, Oliveira-Silva P, Zeidman P, Razi A, Gonçalves Ó F, Friston K, & Coutinho, J. Using resting-state DMN effective connectivity to characterize the neurofunctional architecture of empathy. Sci Rep 9, 2603 (2019). https://doi.org/10.1038/s41598-019-38801-6
Figures