2911
Functional MRI of mice olfactory bulbs using novel fMRI methodologies at 15.2T1Department of Chemical and Biological Physics, Weizmann institute of Science, Rehovot, Israel, 2Department of Neurobiology, Weizmann institute of Science, Rehovot, Israel
Synopsis
Spatiotemporal Encoding (SPEN) MRI was used in fully- and non-fully-refocused modes, to capture the activation of olfactory bulbs (OBs) in mice, in response to odors. At the 15.2T field employed, responses on the order of 10% could easily be observed in male OBs; clear but weaker responses were observed in females. In all cases image quality largely exceeded that arising in GE or even SE EPI, with compromises between image quality and fMRI activation “tunable” by SPEN’s refocusing conditions. The high spatial and temporal resolutions achievable in these scans can shed light into this important behavioral cue of social animals.
Introduction
Social behavior and communication in rodents, but also in other mammals, rely on olfactory cues. Mice fMRI could illuminate the brain regions involved in these. However, inherent constraints in the EPI sequences underlying fMRI –foremost among these susceptibility-derived distortions– limit the ability to tackle some important regions in this process, among them the olfactory bulb (OB). Furthermore, although the advent of high fields could magnify the BOLD signals, ultrahigh fields tend to compound such distortions. This study demonstrates that Spatiotemporal Encoding (SPEN) sequences [1,2] executed at 15.2T can overcome these complications, and yield much larger signal responses to olfactory cues than hitherto observed at lower fields.Methods
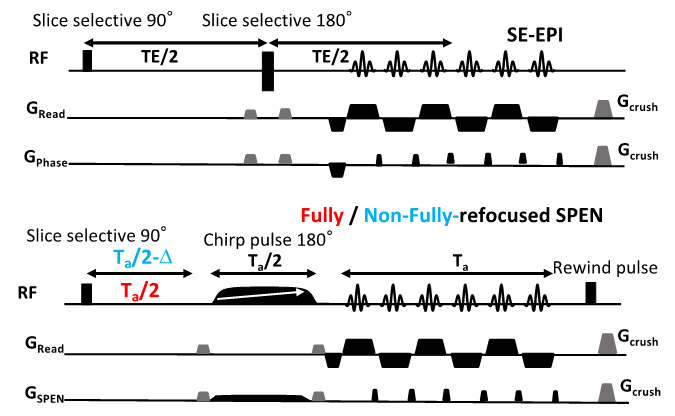
Animals and scan conditions: 10 male and 2 female C57BL/6 adult mice were scanned with a protocol approved by a Weizmann Institute IACUC. Medical air (a mixture of 80% N2 and 20% O2) was used as the respiratory gas and was delivered to animal via a nosecone throughout the experiment. All mice were initially anesthetized with isoflurane (ISO) (3% for induction and 2% during set-up) and a first bolus of 0.2 mg/kg medetomidine was injected subcutaneously [3]. The animal was then secured in a prone position in a mouse cradle, ISO was stopped, and medetomidine was continuously provided at rate of 0.6 mg/kg/h via an IV catheter. The fMRI paradigm involved isoamyl acetate odor stimulation delivered/evacuated into the nosecone through different channels, using a home-built olfactometer according to the schedule (120s air - 25s odor)x10. The physiology of the animals was monitored and controlled (140±50 breaths per minute; 36±0.5 ˚C rectal temperature) throughout the study. Control experiments were performed with the same set up and block design, but without odor delivery. Additional protocols and coils were tested for optimization and quality comparison.MRI experiments and data analysis: A 15.2T Bruker AVIII scanner equipped with a 20mm 1H quadrature transceive CryoProbe® coil was used for the acquisitions. Figure 1 presents the tested sequences. These included gradient- and spin-echo (GE, SE) EPI taken from the scanner’s library, and custom-written 2D fully-refocused and non-fully-refocused SPEN sequences acquiring and processing data within Paravision 6 [4]. SPEN single-shot 2D sequences differ from EPI in their encoding of the spins’ positions via a variable-bandwidth swept pulse, which are subsequently decoded by a blipped gradient. This provides an effective bandwidth “knob” that allows one to overcome field inhomogeneities at the expense of SNR. Suitable timing of the sequence allows a “full refocusing” operation [5] whereby T2* effectively cancels out throughout the acquisition, as opposed to in a single instant as in SE EPI. This can further improve the image quality, but potentially attenuate the BOLD effect. For this reason, SPEN experiments were also run in T2*-weighted modes, where full-refocusing was broken by a 4 ms (negative) Δ delay. Other parameters of the 2D fMRI sequences included TR = 1000 ms, in-plane resolution: 125x125 μm, 0.8 mm slice thickness, single shot acquisitions, 2 averages. fMRI images were reconstructed initially in the scanner; BOLD signal changes over time were subsequently analyzed using MATLAB, and fMRI activation maps generated using SPM12.
Results
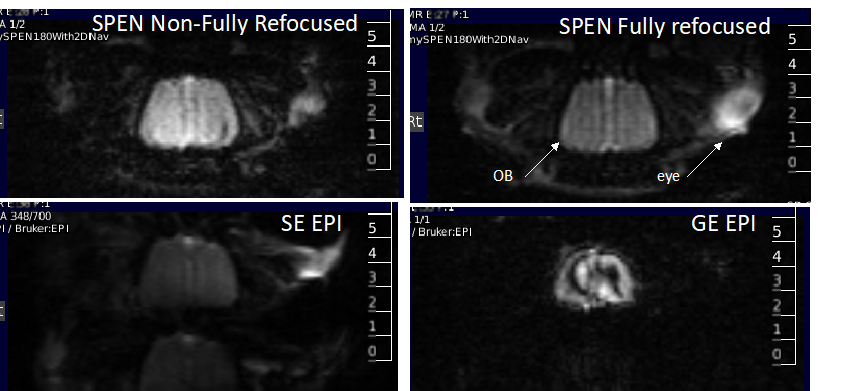
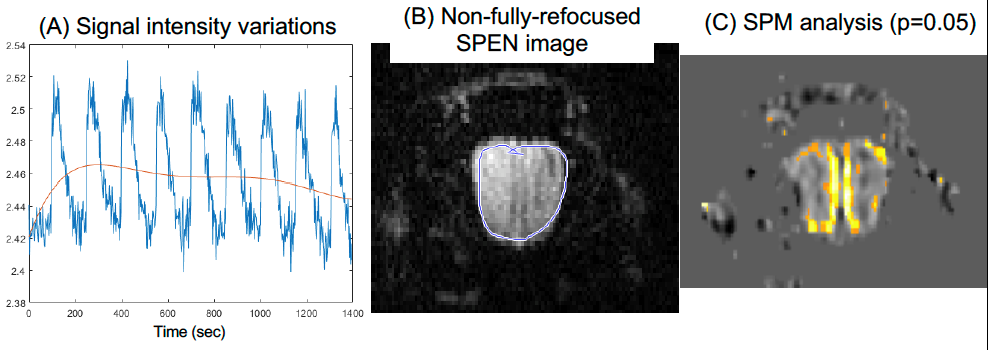
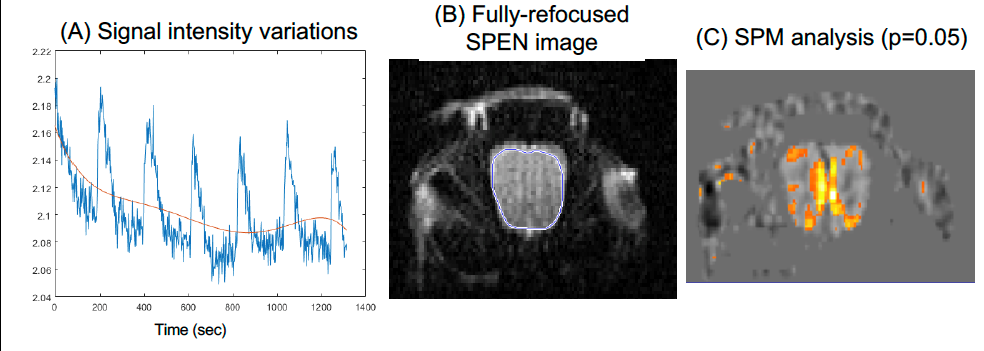
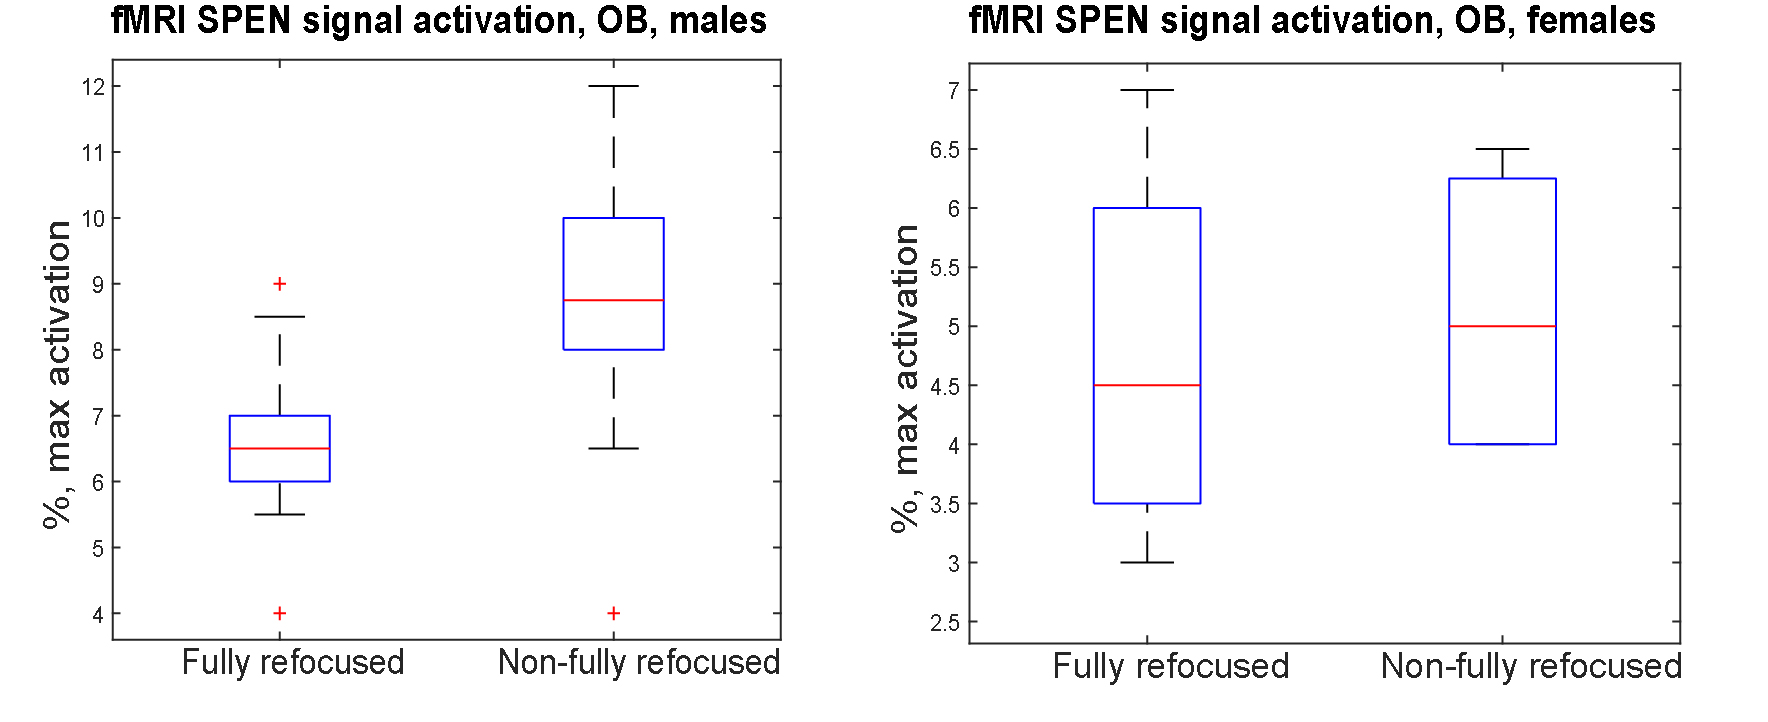
Figure 2 shows representative single-shot images targeting the OB collected with the 4 tested sequences. Despite excellent shimming (<30 Hz) GE EPI gave substantial losses; SE EPI brought a noticeable improvement, but still gave strong FOV/2 ghosts. Fully-refocused SPEN gave the most faithful image; while slightly more distorted, breaking SPEN’s full-refocusing condition did not significantly affect the OB while improving SNR thanks to a shorter effective TE. Both fully-refocused and non-fully-refocused SPEN images show clear intensity differences upon cycling between air flow and odor stimulation (Figures 3, 4). These changes are visible without any statistical treatment and are confined to the OB region: no such signal changes were detected in the control acquisitions nor in other regions proximate to the OB captured by the scans, confirming their connection to the odor stimulation. When performed in males, images show between 7% and 12% signal intensity changes for the fully- and non-fully-refocused SPEN acquisitions respectively. When performed on females these changes were in the range of 3% to 7% for these acquisitions, respectively (Figure 5). These values are to be compared with ≈1% signal changes recently reported in a 7T GE EPI study [3]. Activation maps localize in well-defined regions; according to the Paxinos and Franklin brain atlas [6] the highest fMRI response is detected in the external plexiform region, with weaker signals in the glomerular layer and the granular cell layer.Discussion and Conclusion
This study suggests that the combined use of suitable anesthesia protocols, new pulse sequences and ultrahigh fields, can enable fMRI to tackle challenging organs which, like the OB, were hitherto hard to characterize in mice. Additional improvements are clearly still needed, foremost among these expanding the region of observation. The simultaneous use of EPI and SPEN according to the challenge posed by the regions’ inhomogeneities, together with other data interleaving approaches, could enhance this information. This can help better understand how chemosensory signals are transferred into the olfactory epithelium and into other circuits in the brain, to activate responses to different odors and pheromones.Acknowledgements
We are grateful to Drs. Maxime Yon and Tangi Roussel for helpful discussions. Support from the Minerva Foundation (Germany), the Israel Science Foundation, and the Clore and Kimmel Institutes for Magnetic Resonance (Weizmann Institute), are acknowledged.References
[1] Shrot Y, Frydman L. Spatially encoded NMR and the acquisition of 2D magnetic resonance images within a single scan. J Magn Reson 2005; 172: 179–190.
[2] Tal A, Frydman L. Single-scan multidimensional magnetic resonance. Prog Nucl Magn Reson Spectrosc 2010; 57: 241–292.
[3] Zhao F, Meng X, Lu S, et al. fMRI study of olfactory processing in mice under three anesthesia protocols: Insight into the effect of ketamine on olfactory processing. Neuroimage 2020; 213: 116725.
[4] Yon M, Bao Q, Chitrit OJ, et al. High-Resolution 3D in vivo Brain Diffusion Tensor Imaging at Ultrahigh Fields: Following Maturation on Juvenile and Adult Mice. Front Neurosci 2020; 14: 590900.
[5] Schmidt R, Frydman L. New spatiotemporal approaches for fully refocused, multislice ultrafast 2D MRI. Magn Reson Med 2014; 71: 711–722.
[6] Keith F, Paxinos G. Paxinos and Franklin’s the Mouse Brain in Stereotaxic Coordinates. 3rd ed. Academic press New York, 2008.
Figures