2907
Precision of Mitral Valve Segmentations from Standard and Rotational Long Axis Cardiac Cine MRI1ICM, Charité - Universitätsmedizin Berlin, Berlin, Germany, 2Fraunhofer MEVIS, Bremen, Germany, 3Deutsches Herzzentrum Berlin, Berlin, Germany, 4German Center for Cardiovascular Research (DZHK), Partner Site Berin, Germany, 5Physikalisch-technische Bundesanstalt, Berlin, Germany
Synopsis
Diagnostic assessment of the mitral valve considers pathological alterations in anatomy as well as their effect on cardiac function. The goal of our work was to evaluate, whether the mitral valve anatomy could be assessed with diagnostic precision based on MRI imaging using standard (SLA) or rotational long axis (RLA) cine MRI. In a preliminary study, 6 healthy volunteers underwent imaging in a 1.5T scanner with both approaches. We generated 3D models for the quantitative assessment of the shape of the valves and achieve a higher precision based on the RLA image data.
Introduction
According to recent studies, it can be assumed that 2-5% of the population of western countries suffer from cardiac valve disease1. The structure of the valve as well as myocardial function are important for the comprehensive diagnosis and therapy planning2. The valve apparatus consists of delicate structures, two leaflets, and multiple chords attaching the leaflets to the papillary muscles, which can move rapidly when subject to blood flow. Imaging of the valve therefore requires high spatial and temporal resolution. Magnetic resonance imaging is commonly used in cardiac imaging to assess anatomy, myocardial contraction and tissue status. Valve imaging is typically performed with computed tomography (CT) and ultrasound (US). However, clinical studies showed considerable inter-operator variation in segmentation of the valve attributed to user experience and segmentation protocol3,4. In this study, we want to quantify the reproducibility of valve segmentations in two MRI protocols optimized for the task.Methods
Current approaches to segment the mitral valve in MRI mostly follow the same approach and are highly interactive. Landmarks and structures such as the leaflet are marked in image planes rotated around the valve axis5. We assume that the full leaflets are best visible during diastole in long-axis images. We obtain standard long-axis image stacks and sets of rotational long-axis planes to quantify the reproducibility of valve geometry from different protocols.In both protocols, the user determines the diastolic phase where the valve shows the best contrast. Then, landmarks are placed manually at relevant positions on each image plane. These positions include the annulus, the leaflet (multiple points, depending on visible portion), the free leaflet ends, the papillary muscles, and the apex. The annulus, leaflet and free end landmarks on each plane are used to interpolate additional markers to obtain a smooth curve along the leaflet. From these dense landmarks, a geometric model is created using a simple triangulation method, followed by surface remeshing.
Results
Long-axis cardiac cine MRI data was acquired on a 1.5 T scanner (Ingenia Ambition X, Philips Healthcare, Best, Netherlands) using two different imaging sequences. Six healthy volunteers (26-37 years old, 3 male and 3 female) participated in the study. Standard long-axis (SLA) stacks showing the heart in four-chamber view, with 24 parallel planes intersecting the valve, were acquired using a negative slice gap of 3mm to provide a greater number of slices where the valve is visible. The rotational long-axis (RLA) images consist of 18 planes rotated around an axis passing through the center of the mitral valve and the apex. In both protocols, each image plane was acquired in a separate breath hold (Figure 2).The landmarks were placed as described in the Methods section by two domain experts using custom software implemented in the MeVisLab platform. Both operators reported low contrast between the leaflets and the background in both protocols. One expert processed the datasets twice, to quantify intra-operator variation. Geometric models were created as described in the methods section. We performed a qualitative and quantitative comparison between the models (Figure 3). For quantification, we calculated the geometric parameters relevant for clinical diagnosis, and the relative error (operator 1 as reference) displayed in Figure 4 and 5 for each dataset.
Regarding the inter-operator variability, lower values of relative error and higher ICC values were found for most parameters obtained from RLA, except for annulus height and min. diameter. In the intra-observer variability evaluation, relative errors and ICC values are in a comparable order of magnitude between the two imaging protocols.
Discussion
Position and extent of the leaflets is subject to operator influence and limited images contrast. This directly affects the estimation of leaflet length and orifice area. In the inter-observer study, annulus parameters show lower variation with respect to free edge ones. In general, the RLA model has lower inter-operator variability with respect to the SLA parameters. In SLA stack, the annulus is difficult to identify in the slices located directly at the annulus boundary. This affects the estimation of the annulus diameter and area. The intra-observer analysis showed similar result and the annulus is always correctly traced. The annotation of leaflets is more difficult, and errors in the parameters related to them are considerably higher. Both analyses showed better agreement for the RLA data concerning the annulus. Further analysis including more case should be performed to better understand the variation of the other entities. As both protocols acquire planes in different breath holds, we will investigate in a future study how inter-cycle motion affects the landmarks, and whether motion compensation is required.Conclusion
We presented a preliminary inter and intra-observer variability study that compares the quantitative assessment of the mitral valve based on two different imaging sequences. Our work showed that the RLA model is less subjected to variability, meaning that the user can better identify the entities on the images, particularly the annulus. Regarding the leaflets, both models showed considerable observer variation. The model was generated based on the annotated points without filtering or outlier detection. We will investigate in future work how we can improve the model in case of incomplete annotations due to low contrast. Preliminary results suggest that using the RLA sequence is preferable.Acknowledgements
Funding from the German Research Foundation (GRK2260, BIOQIC)References
[1] Nkomo VT, Gardin JM, Skelton TN, Gottdiener JS, Scott CG, Enriquez-Sarano M. Burden of valvular heart diseases: a population-based study. Lancet. 2006 Sep 16;368(9540):1005-11.
[2] Falk V, Baumgartner H, Bax JJ, et al: 2017 ESC/EACTS guidelines for the management of valvular heart disease. Eur J Cardiothorac Surg 2017; 52: 616–664.
[3] Tautz, L., Neugebauer, M., Hüllebrand, M. et al. Extraction of open-state mitral valve geometry from CT volumes. Int J CARS 13, 1741–1754 (2018). https://doi.org/10.1007/s11548-018-1831-6
[4] Bouchez, S., Mackensen, G. B., Mauermann, E., McCleish, L., Cobey, F., Swaminathan, M., & Wouters, P. (2019). Differences in two-and three-dimensional assessment of the mitral valve by novices and experts, illustrated using anterior mitral valve leaflet length. Journal of cardiothoracic and vascular anesthesia, 33(4), 1022-1028.
[5] Stevanella, M., Maffessanti, F., Conti, C.A. et al. Mitral Valve Patient-Specific Finite Element Modeling from Cardiac MRI: Application to an Annuloplasty Procedure. Cardiovasc Eng Tech 2, 66–76 (2011). https://doi.org/10.1007/s13239-010-0032-4
Figures
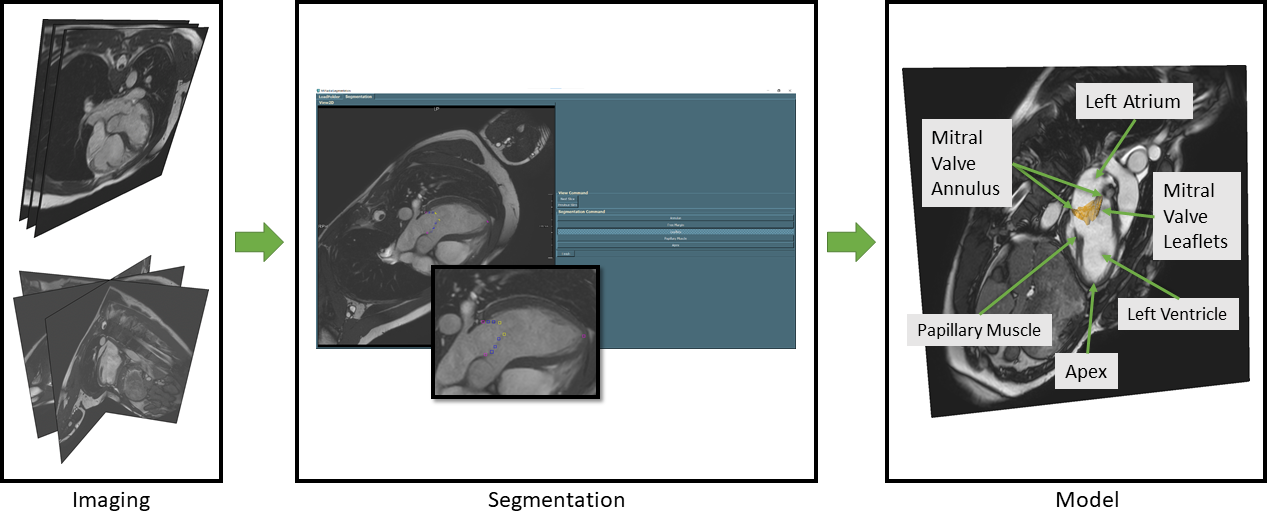
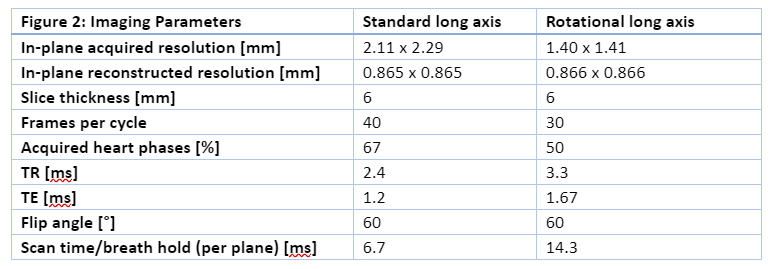
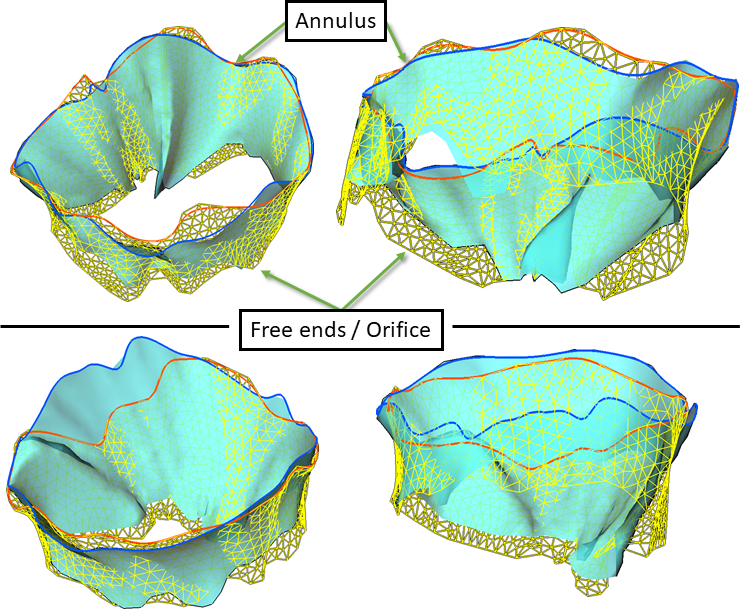
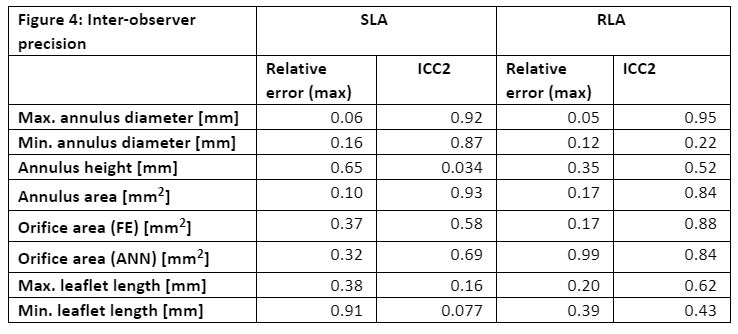
Figure 4: Inter-observer precision.
Intraclass correlation (ICC) was calculated in R (version 4.0.3, R Foundation) using the ICC function of the psych package (version 20.12). Reported values are the ICC2 estimates.

Figure 5: Intra-observer precision.
Intraclass correlation (ICC) was calculated in R (version 4.0.3, R Foundation) using the ICC function of the psych package (version 20.12). Reported values are the ICC2 estimates.