2899
Reproducibility between 3D turbo spin-echo and 2D dual inversion recovery turbo spin-echo for coronary vessel wall imaging in Kawasaki disease
Koji Matsumoto1, Hajime Yokota2, Takafumi Yoda 1, Ryota Ebata3, Hiroki Mukai1, Yoshitada Masuda1, and Takashi Uno2
1Department of Radiology, Chiba University Hospital, Chiba, Japan, 2Diagnostic Radiology and Radiation Oncology, Graduate School of Medicine, Chiba University, Chiba, Japan, 3Department of Pediatrics, Chiba University Hospital, Chiba, Japan
1Department of Radiology, Chiba University Hospital, Chiba, Japan, 2Diagnostic Radiology and Radiation Oncology, Graduate School of Medicine, Chiba University, Chiba, Japan, 3Department of Pediatrics, Chiba University Hospital, Chiba, Japan
Synopsis
We performed qualitative and quantitative evaluations of cross-sectional coronary vessel wall images collected by 3D-TSE and 2D-DIR-TSE in Kawasaki disease (KD) and assessed the reproducibility of both. Coronary vessel walls were evaluated separately in aneurysmal and normal regions. 3D-TSE was comparable to 2D-DIR-TSE in visual assessment and has reproducibility of 3D of lumen area (LA), wall area (WA), normalized wall index (NWI = WA / (LA + WA) ), and lumen-cardiac wall contrast measurements. 3D-TSE coronary vessel wall imaging can collect wide FOV and accurate cross-sectional images, and is feasible for following up the coronary arteries of KD.
Introduction
Kawasaki disease (KD) is an acute vasculitis of unknown etiology that usually occurs in children below five years of age and often involves the formation of coronary artery aneurysms [1]. Coronary artery aneurysms can rupture, thrombose, and lead to the development of stenotic lesions. Vessel wall imaging is desirable for evaluating coronary arterial lesions due to KD [2]. Two-dimensional dual-inversion turbo spin-echo (2D-DIR-TSE) imaging was used for pediatric coronary vessel wall imaging in previous reports [3]. 2D-DIR-TSE has a high in-plane resolution but suffers from a limited coverage of the coronary artery tree. Hence, a three-dimensional turbo spin-echo (3D-TSE) facilitating extensive coverage is desirable [4]. However, the blocked blood of 3D-TSE imaging depends on the blood flow direction relative to the imaging direction. Therefore, in the present study, we performed qualitative and quantitative evaluations of cross-sectional vessel wall images collected by 3D-TSE and conventional 2D-DIR-TSE images in KD and showed both’ reproducibility.Materials and methods
Subjects: Ten patients (5 females and 5 males; mean age ± standard deviation [SD], 12.9 ± 7.2 years; range, 5 to 25 years) were enrolled in this study. No thrombosis was pointed out in X-ray coronary angiography or transthoracic echocardiography.Data acquisition: All MR imaging studies were performed on a 1.5-tesla MR imaging unit (Intera Achieva Nova Dual Release 3.2, Philips Medical Systems, Best, Netherland) by using a chest-phased array coil. First, magnetic resonance angiography was acquired with an axial slice orientation of the whole heart. Subsequently, 3D-TSE was acquired with axial slice orientation in the proximal regions of the coronary artery and reformatted for cross-sectional images of the target part. 3D-TSE images were obtained with the following parameters: a free-breathing navigator-gated and cardiac-triggered 3D-TSE with a repetition time equivalent to the duration of one heartbeat (698 to 896 ms); echo time of 44 to 62 ms; refocusing flip angle of 50°; turbo factor of 15 to 20; resolution of 1.17 × 1.25 × 1.4 mm (reconstruction, 0.65 × 0.65 × 0.55 to 0.7 mm). The total scan time was 3 min 53 s with 100% navigator efficiency (calculated for a heart rate of 70 BPM). Finally, cross-sectional images of the target part were acquired with 2D-DIR-TSE.
Evaluation: Coronary vessel walls were evaluated separately in aneurysmal and normal regions. In the coronary vessel wall images, the window level and width were set the level to diminish the intraventricular blood signal. First, the quality of lumen boundary and outer wall boundary of each cross-sectional images were visually graded with a four-point grade (4, excellent; 3, good; 2, fair; 1, bad). Subsequently, lumen area (LA), wall area (WA), normalized wall index (NWI = WA / (LA + WA) ), and lumen-cardiac muscle contrast were measured in cases with a visual grade between 2 and 4 (Figure 1).
Analysis: To evaluate the reproducibility between 3D-TSE and 2D-DIR-TSE images, interclass correlation coefficients (ICCs) and Bland-Altman plots were used. Fixed and proportional biases were defined as significant with P-values of less than 0.05 of a paired t-test and linear regression.
Results
In total, 48 points (aneurysmal regions, 27; normal regions, 21) were evaluated. The visual grading of 3D-TSE and 2D-DIR-TSE images is summarized in Table 1. There was a high ICCs between 3D-TSE and 2D-DIR-TSE images in LA and WA. (LA, 0.95; WA, 0.95). LA, WA, NWI, and lumen-cardiac muscle contrast are listed in Table 2. Bland-Altman plots of the LA, WA, NWI, and lumen-cardiac muscle contrast between 3D-TSE and 2D-DIR-TSE images are shown in Figure 2. In the aneurysmal regions, the 95% limits of agreement were LA, WA, NWI, and lumen-cardiac muscle contrast of -29.9 to 30.4 mm2, -18.8 to 15.0 mm2, -0.22 to 0.20, and -0.29 to 0.33, respectively. In the normal regions, the 95% limits of agreement were LA, WA, NWI, and lumen-cardiac muscle contrast of -4.44 to 4.38 mm2, -3.51 to 4.30 mm2, -0.14 to 0.16, and -0.39 to 0.35, respectively.Discussion
Although the flow velocity was slower and the influence of turbulence was larger in the aneurysmal region than in the normal region, the visual grade of the lumen boundary was comparable in 3D-TSE and 2D-DIR-TSE images. Therefore, it was suggested that 3D-TSE imaging has a strong suppression effect on blood flow signals. The visual grade of the outer wall boundary tended to be higher in 2D-DIR-TSE images than in 3D-TSE images. The reason may be that the shot duration and scan time were shorter in 2D-DIR-TSE imaging than 3D-TSE imaging. In LA, WA, NWI and lumen-cardiac wall contrast measurements, 3D-TSE and 2D-DIR-TSE imaging were reproducible. Several limitations should be noted in this study. First, the voxel size of 3D-TSE and 2D-DIR-TSE imaging did not match. Second, reproducibility verification in the quantitative evaluation was not sufficient because an evaluator manually reconstructed 3D-TSE.Conclusion
3D-TSE imaging was reproducible with 2D-DIR-TSE imaging for coronary vessel wall assessment on KD. 3D-TSE imaging can collect a wide field of view and accurate cross-sectional images and is feasible for a follow-up examination of KD.Acknowledgements
No acknowledgement found.References
- Newburger JW, Takahashi M, Gerber MA, et al. Diagnosis, treatment, and long-term management of Kawasaki disease: a statement for health professionals from the Committee on Rheumatic Fever, Endocarditis, and Kawasaki Disease, Council on Cardiovascular Disease in the Young, American Heart Association. Pediatrics 2004;114:1708-1733.2.
- Suzuki A, Takemura A, Inaba R, et al. Magnetic resonance coronary angiography to evaluate coronary arterial lesions in patients with Kawasaki disease. Cardiol Young. 2006;16:563-571.3.
- Greil GF, Seeger A, Miller S, et al. Coronary magnetic resonance angiography and vessel wall imaging in children with Kawasaki disease. Pediatr Radiol 2007;37:666-673.
- Matsumoto K, Yokota H, Mukai H, et al. Coronary vessel wall visualization via three-dimensional turbo spin-echo black blood imaging in Kawasaki disease. Magn Reson Imaging 2019;62:159–166.
Figures
Figure 1. For each aneurysm, images from multiple cross-sections (e.g., center, proximal, distal portions) were obtained. As in normal regions, images of normally appearing juxta-proximal and juxta-distal points of the aneurysms and points where the aneurysms had already regressed were obtained (a and b). The lumen of the coronary artery and the boundaries of the wall were manually contoured on cross-sectional images (c). Wall area (WA) was measured by subtracting the lumen area (LA) from the total vessel area (TVA) (d, e, f). (RCA, right coronary artery; Ao, aorta)
Table 1. In the lumen boundary and outer wall boundary, there were no significant differences between 3D-TSE and 2D-DIR-TSE images. Grade 1 were removed from subsequent analysis.
Table 2. There were no significant differences between 3D-TSE and 2D-DIR-TSE images in aneurysmal and normal-proximal regions.
Figure 2. Bland-Altman plots of the LA, WA, normalized wall index (NWI), and lumen-cardiac muscle contrast determined by 3D-TSE and 2D-DIR-TSE in aneurysmal (a, b, c, d) and normal (e, f, g, h) regions. Bland-Altman plots demonstrate good agreement between 3D and 2D images. In the aneurysmal region, there are no proportional biases in LA, WA, NWI, and lumen-cardiac muscle contrast (P = 0.334, 0.167, 0.136, and 0.987, respectively). In the normal region, there are not proportional biases in LA, WA, NWI and lumen-cardiac muscle contrast (P = 0.600, 0.259, 0.105, and 0.439, respectively).
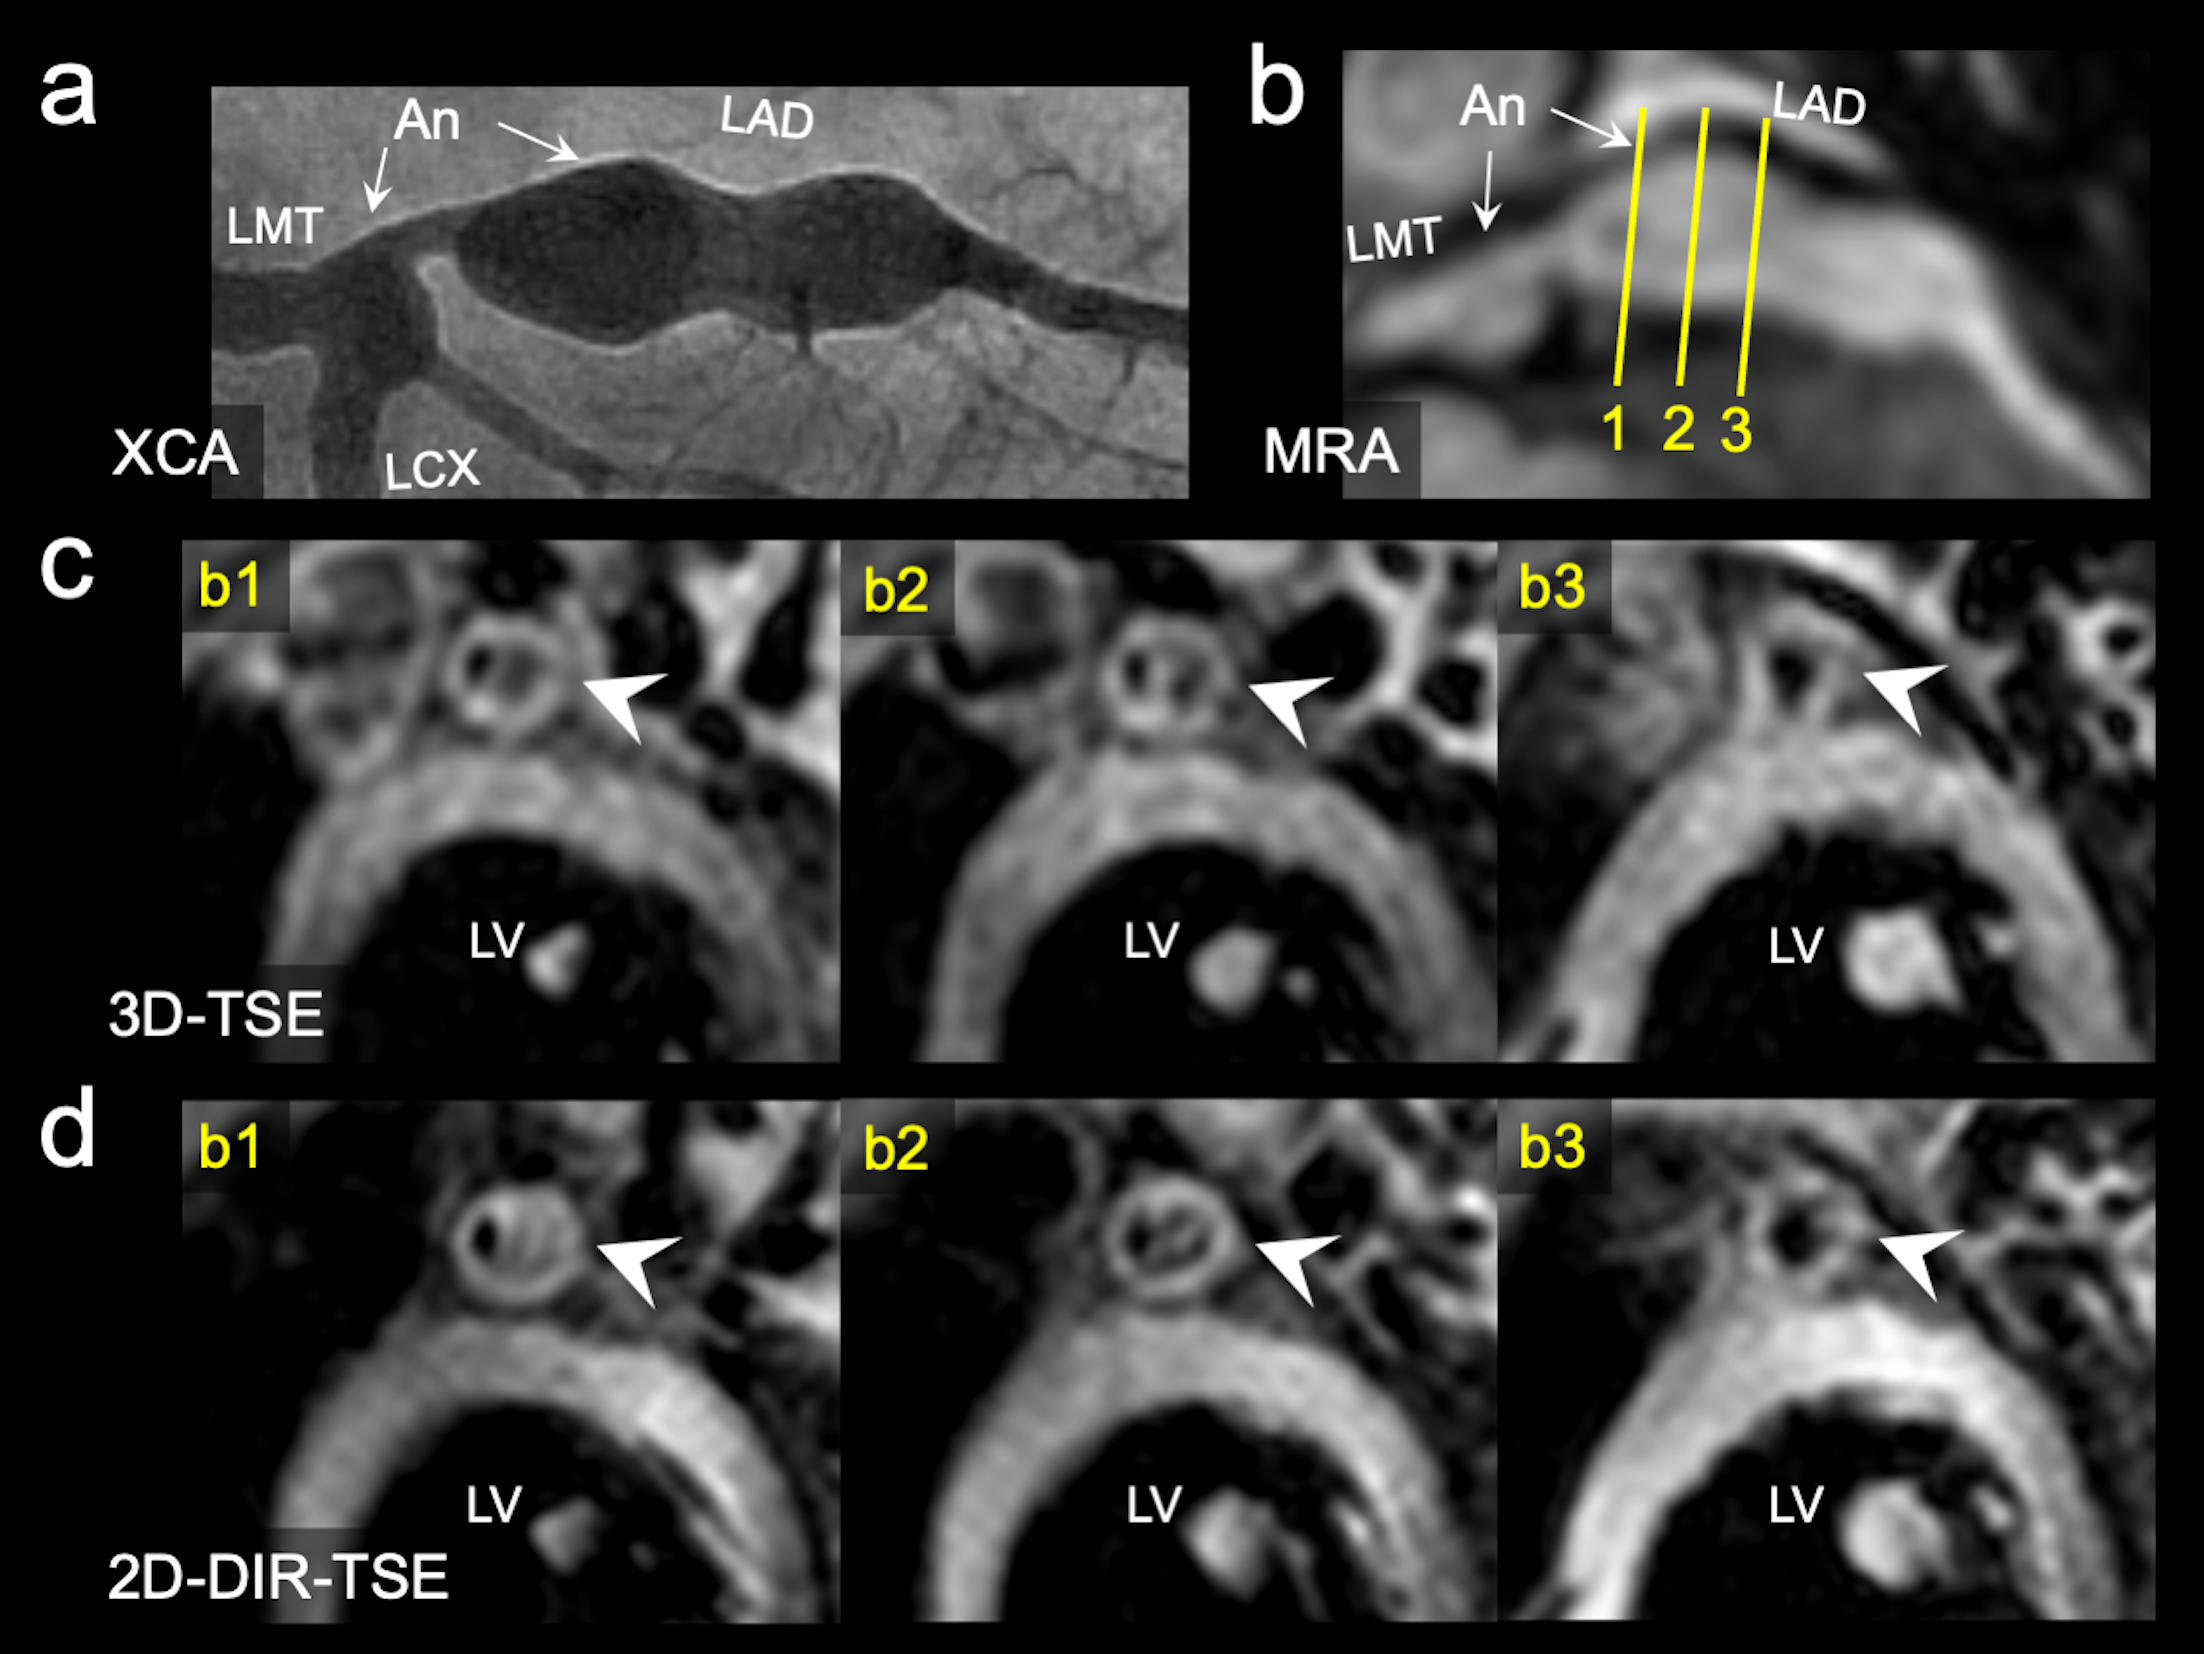
Figure 3. The X-ray coronary angiography (XCA) images demonstrate two left coronary artery aneurysms (segment 5, 4.5 mm; segment 6 to 7, 8.3 mm) in an 8-year-old boy with KD (a). Each cross-sectional image of 3D and 2D corresponds to the solid line numbers in the MRA images (b,c,d). In the 3D and 2D, intraluminal signals in the aneurysm mimics thrombi because the flow signals are not suppressed. In the cross-section indicated by b2, the visual grading of the lumen boundary and outer wall boundary in 3D and 2D were grade 2 and 4, respectively, and were depicted equally (arrowheads in c and d).