2891
Optimization of a multi-dose ferumoxytol-enhanced T1 MRI protocol for estimation of fractional myocardial blood volume
Caroline Colbert1,2,3, Michael A. Thomas3,4, Ran Yan2,5, Hengjie Liu1,2, Peng Hu1,2,5, and Kim-Lien Nguyen1,2,3
1Physics and Biology in Medicine Graduate Program, UCLA David Geffen School of Medicine, Los Angeles, CA, United States, 2Department of Radiology, UCLA David Geffen School of Medicine, Los Angeles, CA, United States, 3Division of Cardiology, UCLA David Geffen School of Medicine, Los Angeles, CA, United States, 4Department of Radiology, Northwestern School of Medicine, Chicago, IL, United States, 5Department of Bioengineering, UCLA Samueli School of Engineering, Los Angeles, CA, United States
1Physics and Biology in Medicine Graduate Program, UCLA David Geffen School of Medicine, Los Angeles, CA, United States, 2Department of Radiology, UCLA David Geffen School of Medicine, Los Angeles, CA, United States, 3Division of Cardiology, UCLA David Geffen School of Medicine, Los Angeles, CA, United States, 4Department of Radiology, Northwestern School of Medicine, Chicago, IL, United States, 5Department of Bioengineering, UCLA Samueli School of Engineering, Los Angeles, CA, United States
Synopsis
We aimed to evaluate the feasibility of an abbreviated MRI protocol for estimation of fractional myocardial blood volume (fMBV). Four normal swine were imaged with the MOLLI sequence at baseline and following seven ferumoxytol doses. We estimated fMBV using our full dataset, after application of retrospective dose under-sampling, and with the fast-exchange approximation. A four-acquisition protocol with compartmental modelling may have potential to accurately estimate fMBV in studies of myocardial perfusion.
Introduction
Elevated myocardial blood volume (MBV) has been proposed as a compensatory response in the setting of myocardial hypoperfusion and ischemia secondary to coronary stenosis.1 Multi-compartmental water exchange models can be used to estimate fractional myocardial blood volume (fMBV) with multi-dose ferumoxytol‑enhanced MRI (FE-MRI) T1 mapping.2,3 However, the need for sequential image acquisition after each cumulative ferumoxytol dose prolongs the examination time, which may deter clinical adoption of the technique. To date, the minimum number of contrast doses needed to accurately model fMBV has not been adequately addressed. We aim to evaluate the feasibility of an abbreviated T1 MRI protocol for estimation of fMBV using a two-compartment water exchange model.Methods
For our reference dosing scheme, we acquired mid-ventricular myocardial T1 maps in four healthy, normal male swine using the 5(3)3 Modified Look-Locker Inversion (MOLLI) recovery sequence4 with a balanced steady-state free precession (bSSFP) readout [FOV = 240 x 300 mm, matrix size = 384 x 308, TR = 2.6 ms, TE = 1.08 ms, slice thickness = 8 mm, pixel bandwidth = 1085 Hz, flip angle = 35˚, TI = 100 – 180 ms]. Ferumoxytol contrast was then administered in seven cumulative doses (0.125, 0.25, 0.5, 1.0, 2.0, 3.0, 4.0 mg/kg). Following each dose, we observed a five-minute delay to achieve contrast steady state before repeating mid-ventricular T1 mapping. The typical total duration of our multi-dose acquisition was 55 minutes. Following T1 fitting,5 we estimated fMBV in each mid-ventricular myocardial segment6 (N=24) using a two-compartment water exchange model.7Protocol optimization: We evaluated the feasibility of sparser dose-sampling schemes with shorter total acquisition duration by selectively under-sampling our full dataset (Table 1). We applied six dose sampling schemes: each included the baseline and final (0.0 and 4.0 mg/kg) acquisitions in order to capture the full range of myocardial and blood pool T1, with two additional doses in the 0.125 – 3.0 mg/kg range. We favored sampling in the low-dose domain (0.125 – 0.5 mg/kg), informed by a prior study.3 We then estimated fMBV based on each under-sampled dataset. We also evaluated the fast-exchange approximation of fMBV.1 We used Bland-Altman analysis to compare fMBV estimated using the full (eight-acquisition) and under-sampled (four-acquisition) datasets and the fast-exchange approximation (two-acquisition).
Results
We found a mean mid-ventricular fMBV of 6.7±1.8% in four healthy swine subjects. Fast-exchange fMBV computed at 2.0 mg/kg ferumoxytol showed the best nominal agreement with model-fitted fMBV. Linear regression analysis showed a moderate correlation between fast-exchange fMBV and model-fitted fMBV (r = 0.77, p <0.001). Bland-Altman analysis found limits of agreement (LOA) of ‑2.59% [-3.45, -1.73%] to 2.01% [1.15, 2.87%] without significant bias (mean difference = -0.29, p=0.24, Figure 1). Scheme 3 showed the worst agreement with our fully sampled results, with significant bias, and wide limits of agreement (mean difference = -4.99, p<0.001; LOA ‑13.17% [-16.23, -10.12%] to 3.20% [0.14, 6.25%]; Figure 2). Finally, of the six dose under-sampling schemes evaluated, we found that fMBV estimated using scheme 1 showed the best agreement with the fMBV estimated using the full dataset, showing strong correlation (R=0.95, p<0.001). Bland-Altman analysis showed no significant bias (mean difference = 0.07, p=0.541) between the two methods with LOA ‑1.04% [-1.45, -0.62%] to 1.18% [0.77, 1.59%] (Figure 2).Discussion
This preliminary study demonstrates the feasibility of fMBV quantification using a two-compartment model with multi-dose FE MOLLI T1 mapping in four healthy, normal swine subjects. Long exam times and complex acquisition protocols can deter clinical adoption of new imaging approaches. While optimized protocols for quantification of total body blood volume have been investigated previously,8 the minimum number of acquisitions required to accurately model fractional myocardial blood volume has not been adequately addressed. To facilitate clinical translation, we identified a sparser dose sampling scheme that maintained the accuracy of fMBV estimates within ±1.1% fMBV. Our findings indicate that accurate estimation of fMBV may be feasible with four T1 acquisitions, rather than eight. This dose sampling scheme would reduce the total study time to approximately 35 minutes, comparable to the duration of a typical stress perfusion MRI study. Further evaluation is needed to compare the sensitivity and specificity of these methods in a clinical setting.Conclusions
A four-acquisition multi-dose FE-MRI T1 mapping protocol combined with a two-compartment water exchange model may have potential to accurately estimate fMBV. If confirmed in patients, estimated fMBV using multi-dose FE MOLLI T1 mapping may serve as a potential direct marker of myocardial tissue perfusion.Acknowledgements
We thank the UCLA Translational Research Imaging Center (TRIC) and the Division of Laboratory Animal Medicine at UCLA for their assistance.References
- Bane O, Lee DC, Benefield BC, et al. Leakage and water exchange characterization of gadofosveset in the myocardium. Magnetic Resonance Imaging. 2014;32(3):224-235. doi:10.1016/j.mri.2013.10.014
- Chatterjee N, Bane O, Spottiswoode BS, Carr JC, Carroll T. Measurement of myocardial blood volume and water exchange using ferumoxytol. Journal of Cardiovascular Magnetic Resonance. 2015;17(S1):4-5. doi:10.1186/1532-429x-17-s1-w11
- Black D, Stoumpos S, Jerosch-Herold M, et al. Myocardial fractional blood volume estimation using ultra low dose ferumoxytol enhanced MRI and three-compartment model of water exchange in patients with chronic kidney disease. In: Society for Magnetic Resonance Angiography 29th Annual International Conference; 2017:112.
- Higgins DM, Ridgway JP, Sivananthan MU, Radjenovic A, Messroghli DR, Kozerke S. Modified Look-Locker inversion recovery (MOLLI) for high-resolution T1 mapping of the heart. Magnetic Resonance in Medicine. 2004;52(1):141-146. doi:10.1002/mrm.20110
- Shao J, Nguyen K-L, Natsuaki Y, Spottiswoode B, Hu P. Instantaneous signal loss simulation (InSiL): An improved algorithm for myocardial T1 mapping using the MOLLI sequence. Journal of Magnetic Resonance Imaging. 2015;41(3):721-729. doi:10.1002/jmri.24599
- Cerqueira MD, Weissman NJ, Dilsizian V, et al. Standardized myocardial segmentation and nomenclature for tomographic imaging of the heart: A Statement for Healthcare Professionals from the Cardiac Imaging Committee of the Council on Clinical Cardiology of the American Heart Association. Circulation. 2002;105(4):539-542. doi:10.1161/hc0402.102975
- Bjørnerud A, Bjerner T, Johansson LO, Ahlström HK. Assessment of myocardial blood volume and water exchange: Theoretical considerations and in vivo results. Magnetic Resonance in Medicine. 2003;49(5):828-837. doi:10.1002/mrm.10430
- Ramasawmy R, Rogers T, Alcantar MA, et al. Blood volume measurement using cardiovascular magnetic resonance and ferumoxytol: preclinical validation. Journal of Cardiovascular Magnetic Resonance. 2018;20(1):62. doi:10.1186/s12968-018-0486-3
Figures
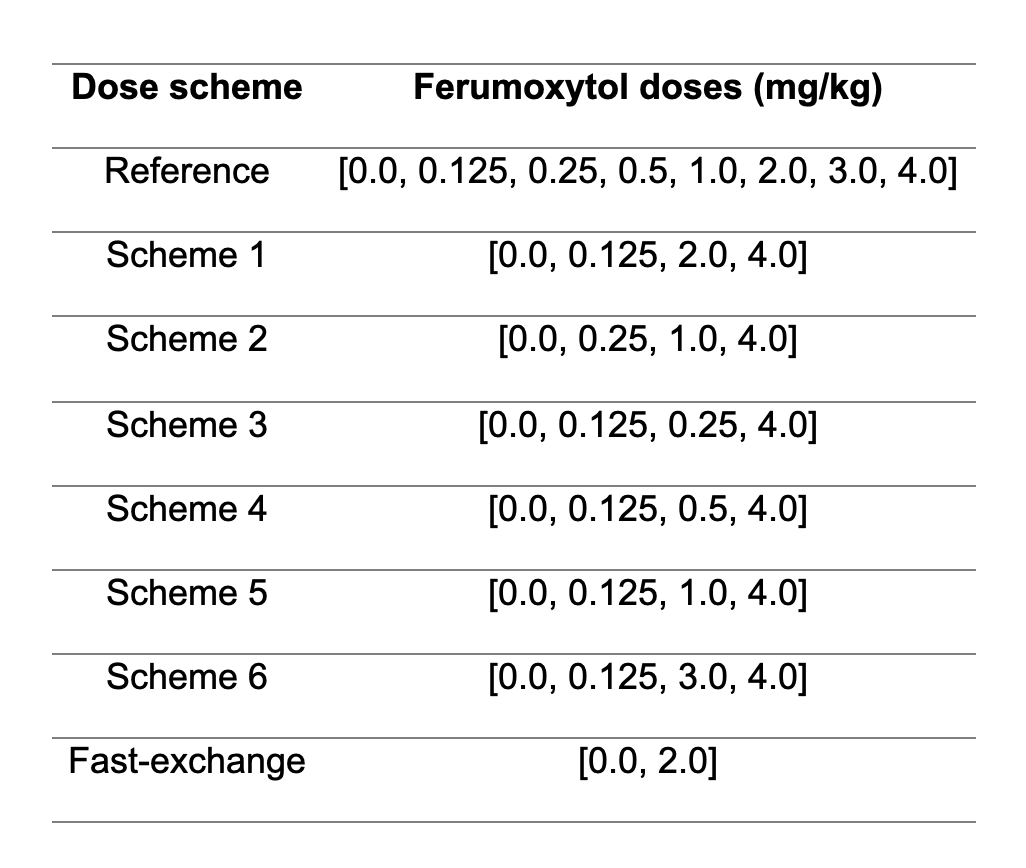
Table 1. Cumulative ferumoxytol doses (mg/kg) comprising each dose under-sampling scheme analyzed. fMBV estimated using scheme 1 showed best agreement with fMBV estimated using the complete dataset.
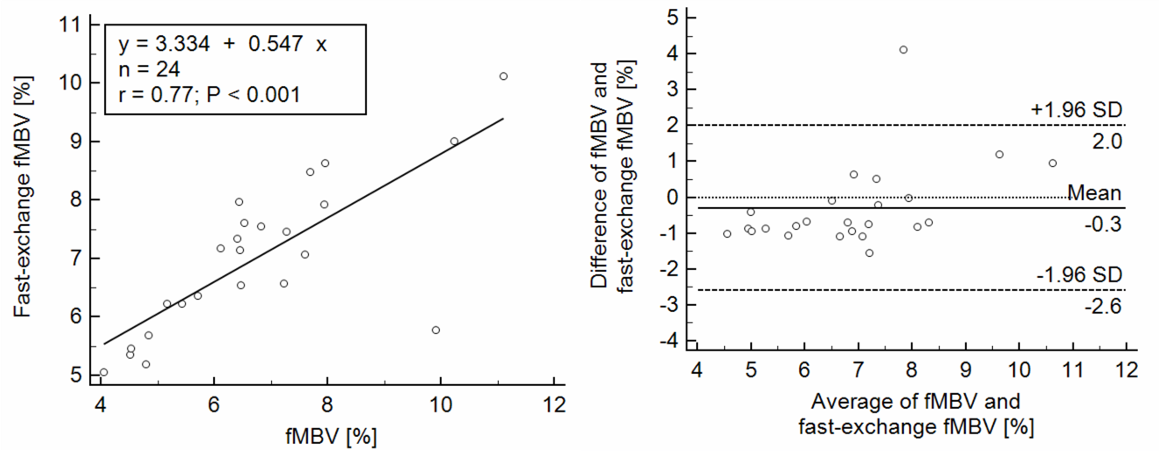
Figure 1. Bland-Altman analysis of fMBV in 4 swine subjects fitted using the complete 8-acquisition dataset and fast-exchange fMBV. Moderate correlation and relatively wide limits of agreement indicate that accurate quantification of tissue perfusion using only two T1 images during ferumoxytol infusion may not be feasible.
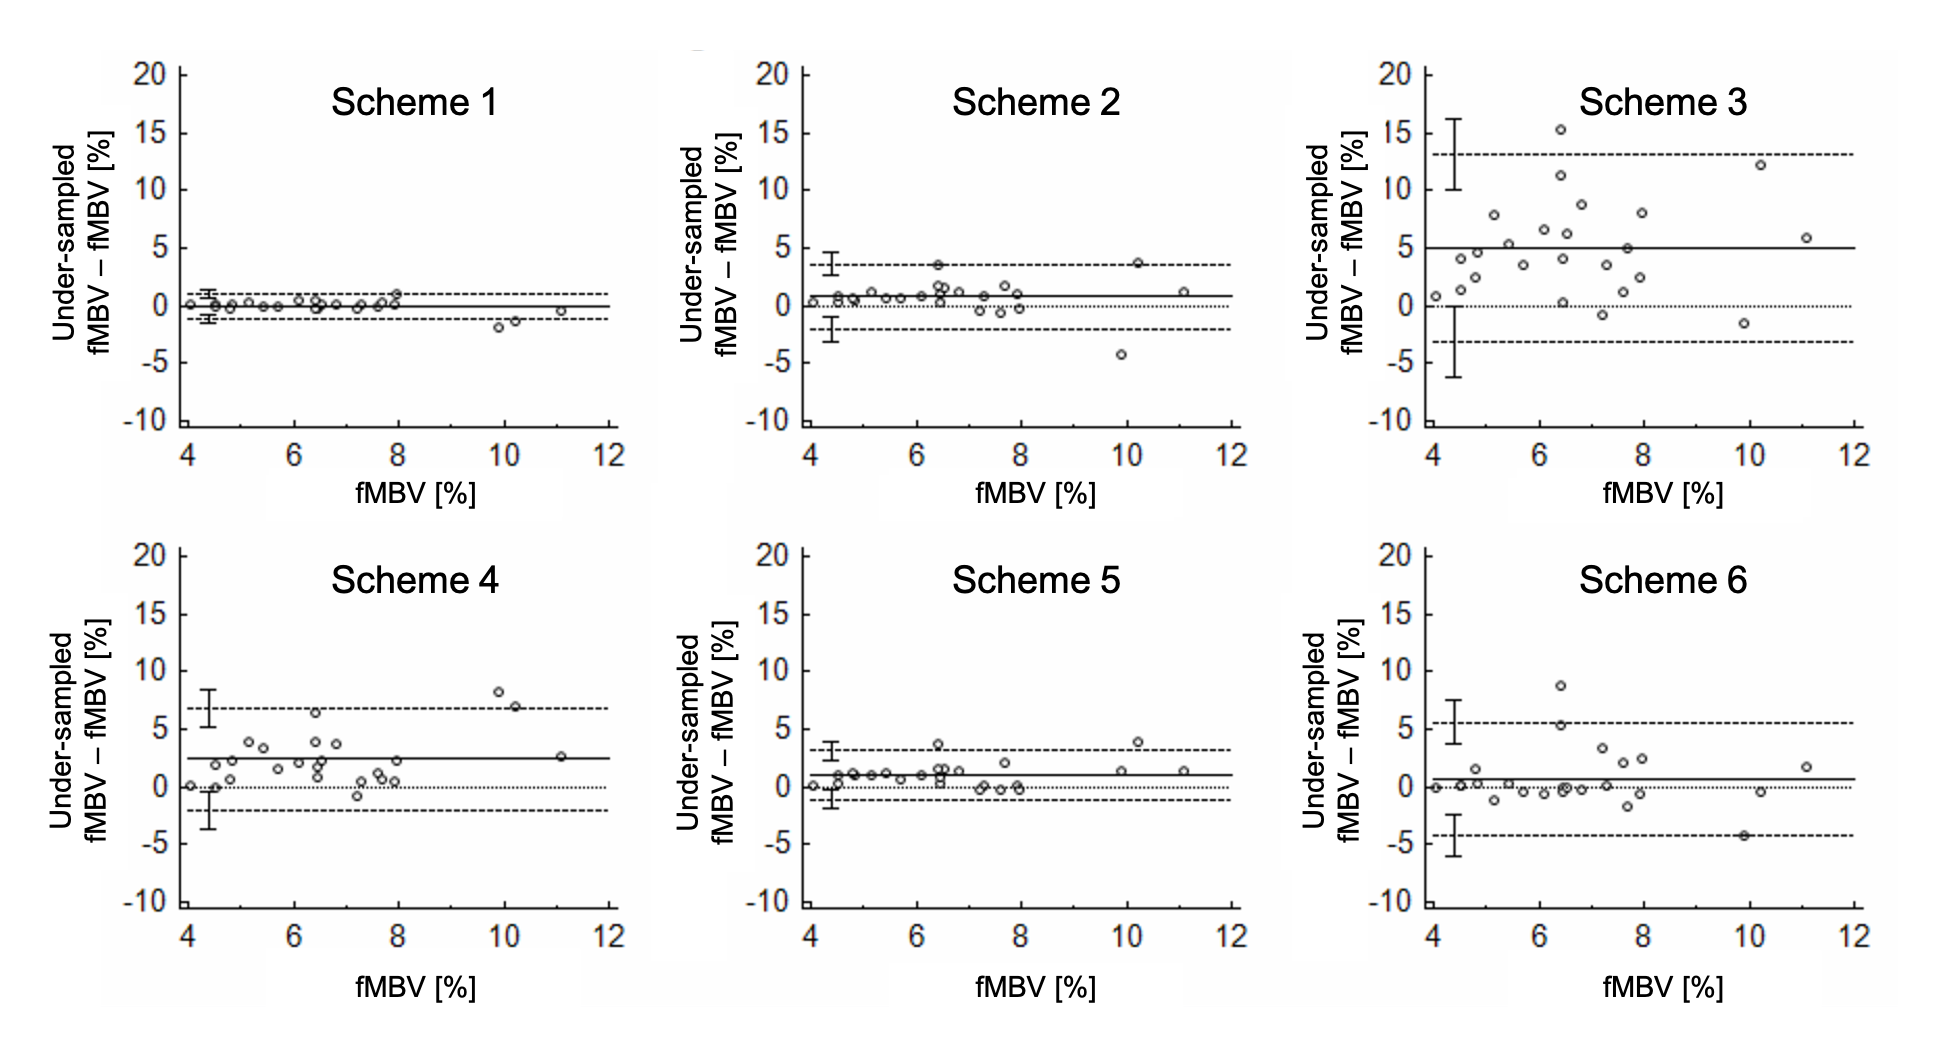
Figure 2. Agreement comparison of fMBV estimated using 6 under-sampling schemes with fMBV fitted from the complete dataset. Compared to fully sampled fMBV, fMBV estimated using scheme 1 showed a median absolute percent error of 2.63% [1.61, 4.50%]. Scheme 3 showed a median percent error of 65.41% [43.65, 99.72%].