2883
Functional Segmentation and Reconstruction for High-Definition DCE MRI Exploiting Vascular Heterogeneity priors1Biomedical Engineering, Sungkyunkwan University, Gyunggido, Korea, Republic of, 2Seoul National University Hospital, Seoul, Korea, Republic of, 3Intelligent Precision Healthcare Convergence, Sungkyunkwan University, Gyunggido, Korea, Republic of
Synopsis
In this work, we propose a novel, joint functional segmentation and reconstruction directly from largely incomplete DCE measurements exploiting multi-scale vascular heterogeneity priors to achieve high-definition whole brain DCE MRI. Experimental studies were performed in patients with brain tumor to investigate the feasibility of the proposed method in jointly visualizing vascular structures and functions from a single measurement after administering contrast agents. We demonstrated that the proposed method outperforms conventional methods in delineating angiographic structures, functional segment maps, and corresponding perfusion-permeability maps
Introduction
Dynamic contrast enhanced (DCE) MRI has been widely used in a clinical routine to investigate time-varying vascular structures and microvascular functions in pathological tissues. In DCE MRI, arteries and veins exhibit rapid, high uptake and wash-out signal patterns, while capillaries are typically characterized by slow, low uptake and wash-out signal patterns. Furthermore, depending on microvascular contrast dynamics, pathological tissues particularly in brain tumor can be categorized into highly perfused, hypoxic, and necrotic regions. Given the above considerations, we introduce a novel, joint functional segmentation and reconstruction directly from largely incomplete DCE measurements exploiting the vascular heterogeneity priors to achieve high-definition DCE MRI. Both vascular structure and microvascular function maps are jointly estimated by solving a constrained optimization problem in which vascular heterogeneity priors are represented by spatially weighted nonnegative matrix factorization (NMF). The proposed method exhibits highly well-defined macrovascular structure and microvascular function maps for patients with brain cancer due to the synergetic combination of functional segmentation and reconstruction within a single framework.Materials and Methods
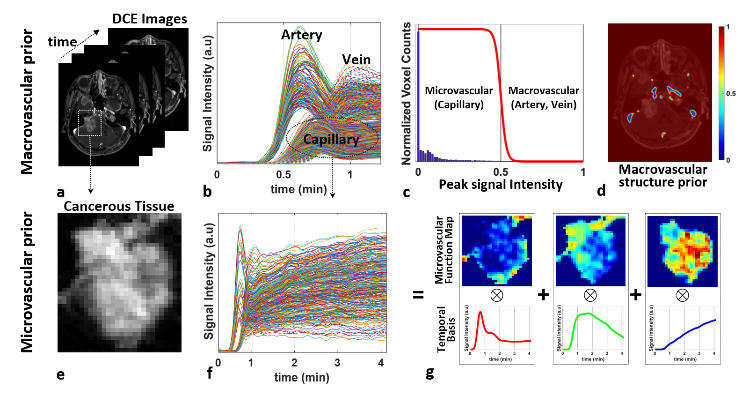
1) Reference-Subtracted DCE Signal: Prior to injection of CA, a set of pre-contrast reference can be constructed by employing either full sampling in a single phase or interleaved sampling followed by averaging over multiple time phases. Magnitudes are taken from a time series of the reference-subtracted signal vectors: $$\mathbf{R_X} = \mathbf{X} -\mathbf{X}_\mathbf{0} = \mathbf{X}_\mathbf{D} + \mathbf{N}$$ where $$$\mathbf{R_X}$$$ is the reference-subtracted signal matrix; $$$\mathbf{X_0}$$$ is the reference signal matrix; $$$\mathbf{X_D}$$$ is the target matrix containing contrast dynamics.2) Signal Representation For Vascular Heterogeneities: To differentiate penalties on arteries relative to capillaries, vascular structural priors are constructed by using all temporal signals over the whole brain (Fig.1a-1b), performing a histogram analysis with respect to signal intensity, and weighting voxels with a reverse sigmoid function (Fig.1c). Macrovascular regions are then much less weighted compared with microvascular regions (Fig.1d). Apart from arteries and veins, microvascular regions, particularly in pathological tissue, are characterized into highly perfused, hypoxic, and necrotic groups, which are then mathematically represented by spatially weighted NMF in which signals only in microvascular regions are decomposed into temporal basis and its corresponding spatial weights while macrovascular regions are excluded (Figs.1e-1g).Given all considerations, the proposed, spatially adaptive signal representation for vascular heterogeneities can be described by $$\mathbf{M}\mathbf{X_D} = \mathbf{M}(\mathbf{W}\mathbf{H})\\\mathbf{W}\geq 0, \mathbf{H}\geq 0$$
where $$$\mathbf{M}$$$ is the spatial weight matrix which differentiates arteries and veins (low values) from capillaries (high values). $$$\mathbf{H}$$$ is one of the NMF matrix in which row vectors represent temporal basis unique containing microvascular contrast dynamics;$$$\mathbf{W}$$$ is the other NMF matrix in which each column vector represents a spatial weight distribution (functional segment) specific to each temporal basic signal pattern.
3) Joint Reconstruction of Vascular Structure and Functional Segmentation Maps Using Vascular Heterogeneity priors: The proposed method employs the vascular heterogeneity priors to jointly reconstruct macrovascular structures and microvascular function maps directly from highly highly incomplete measurements for high-definition DCE MRI. This strategy is mathematically formulated by the following constrained minimization problem with spatially adaptive sparsity and NMF priors using the following objective function:$$\mathcal{J}(\mathbf{W, H},\mathbf{X_D})= ||\mathbf{M}\mathcal{F}_{t}(\mathbf{X_D})||_1\\ \quad\quad\quad\quad\quad\quad\quad\quad+ \tau_1||\mathbf{W}||_1 +\frac{\tau_2}{2} ||\mathbf{M}(\mathbf{X_D}-\mathbf{WH})||_F^2\\
\textrm{s.t.}\quad\mathbf{R_Y} = \mathbf{Y-Y_0}= \mathcal{F}_{u}(\mathbf{P_D}\odot\mathbf{X_D})\\ \quad\quad\mathbf{W}\geq 0, \mathbf{H}\geq 0 $$
where $$$\mathcal{F}_{t}$$$ is the temporal Fourier transform operator, $$$\mathbf{R_Y}$$$ is the measured residual (k-t space) between the reference and DCE data, and is the $$$\mathcal{F}_{u}$$$ Fourier-encoding operator that includes the Fourier transform with incomplete sampling.$$$\mathbf{P_D}$$$ is the low resolution phase, and $$$\tau_1$$$ and $$$\tau_2$$$ are the balancing parameters.
Experiment
A time series of 4D whole brain DCE data was acquired in 25 patients with brain cancer on a 3T whole-body MR scanner using our customized, time-resolved 3D spoiled gradient echo (GRE) MR pulse sequence. Each set of 3D data was vastly undersampled on the Cartesian grid in a pseudo-radial fashion with a reduction factor 50. The sampling points were rotated using a golden angle with time.Results
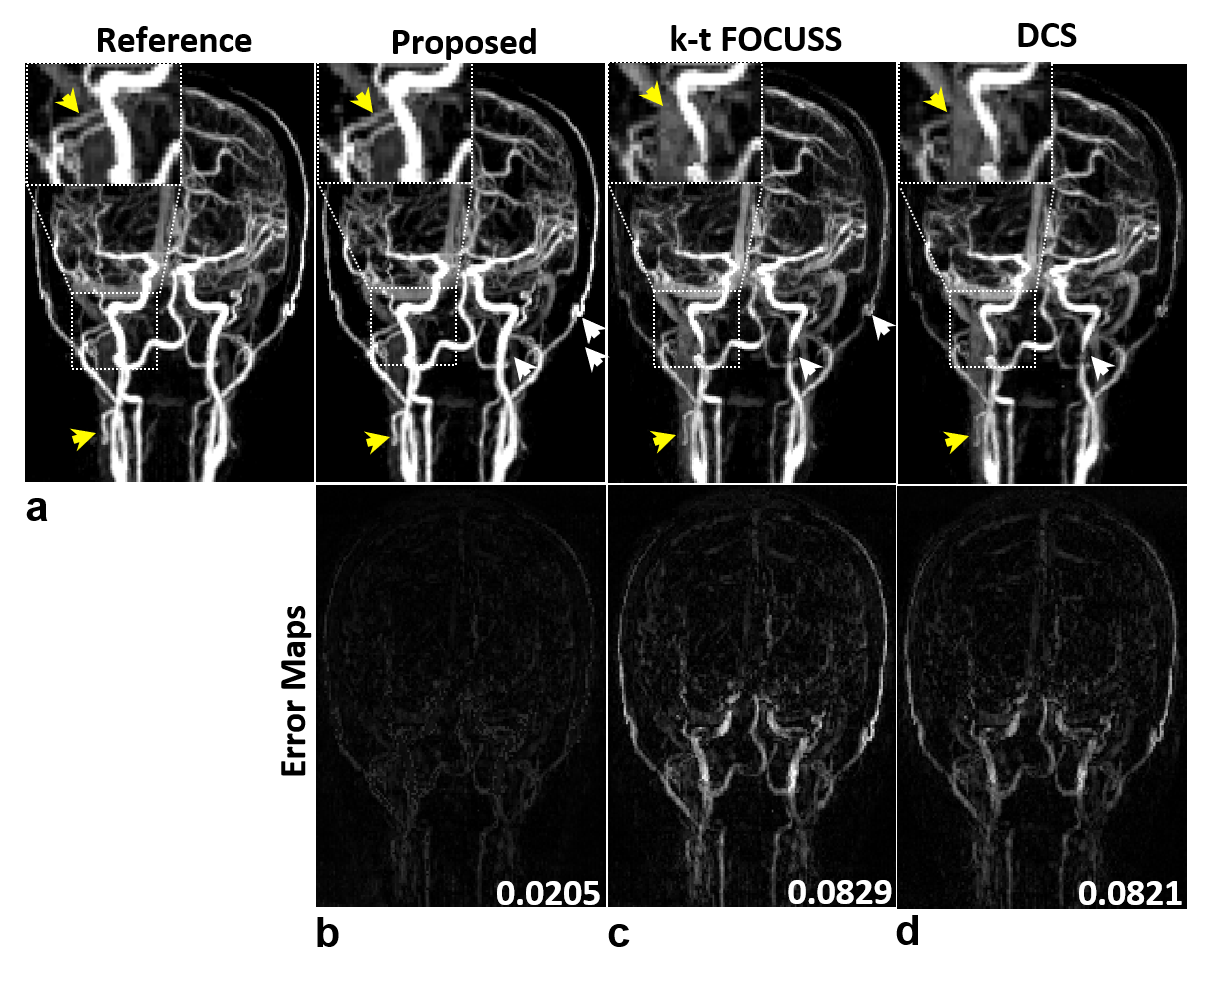
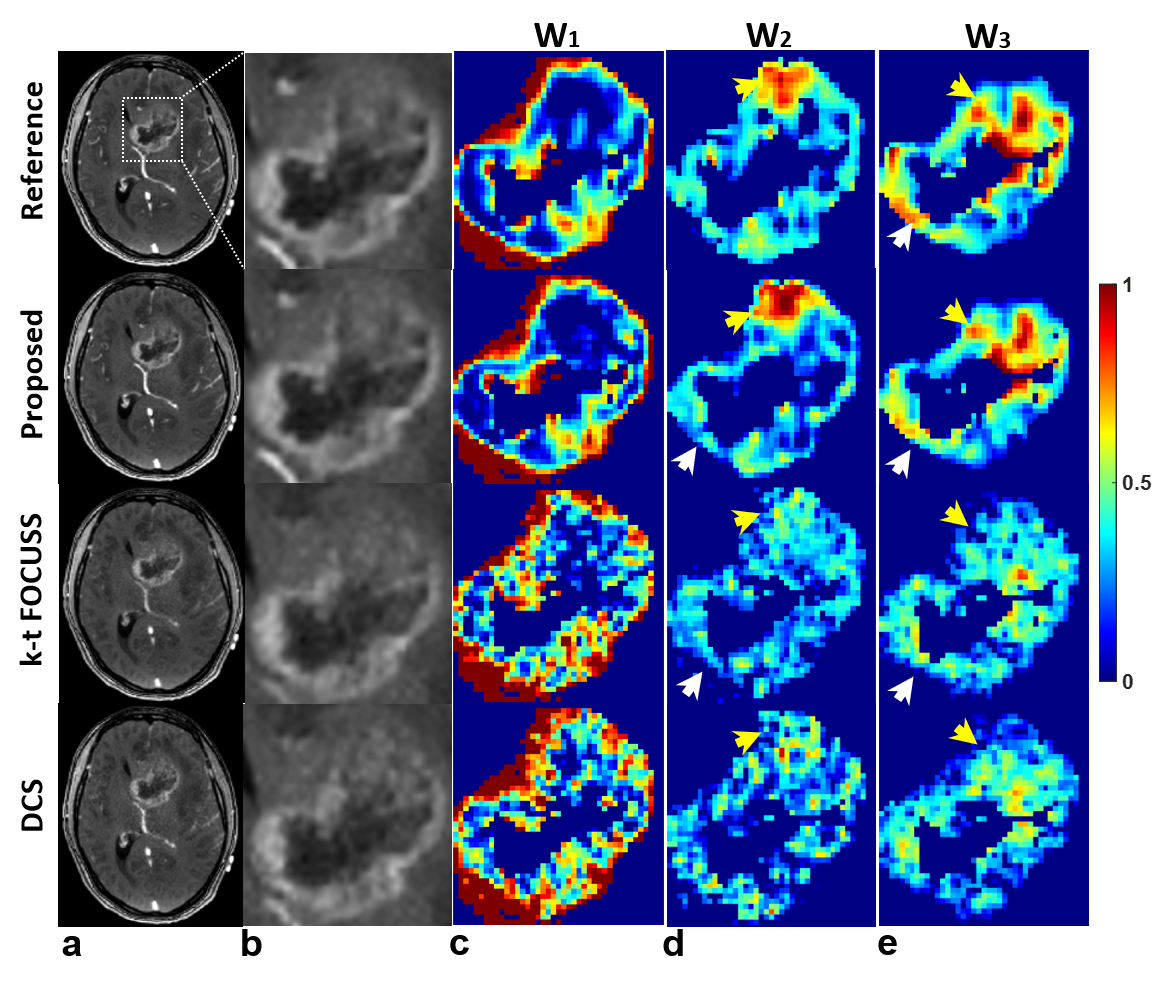
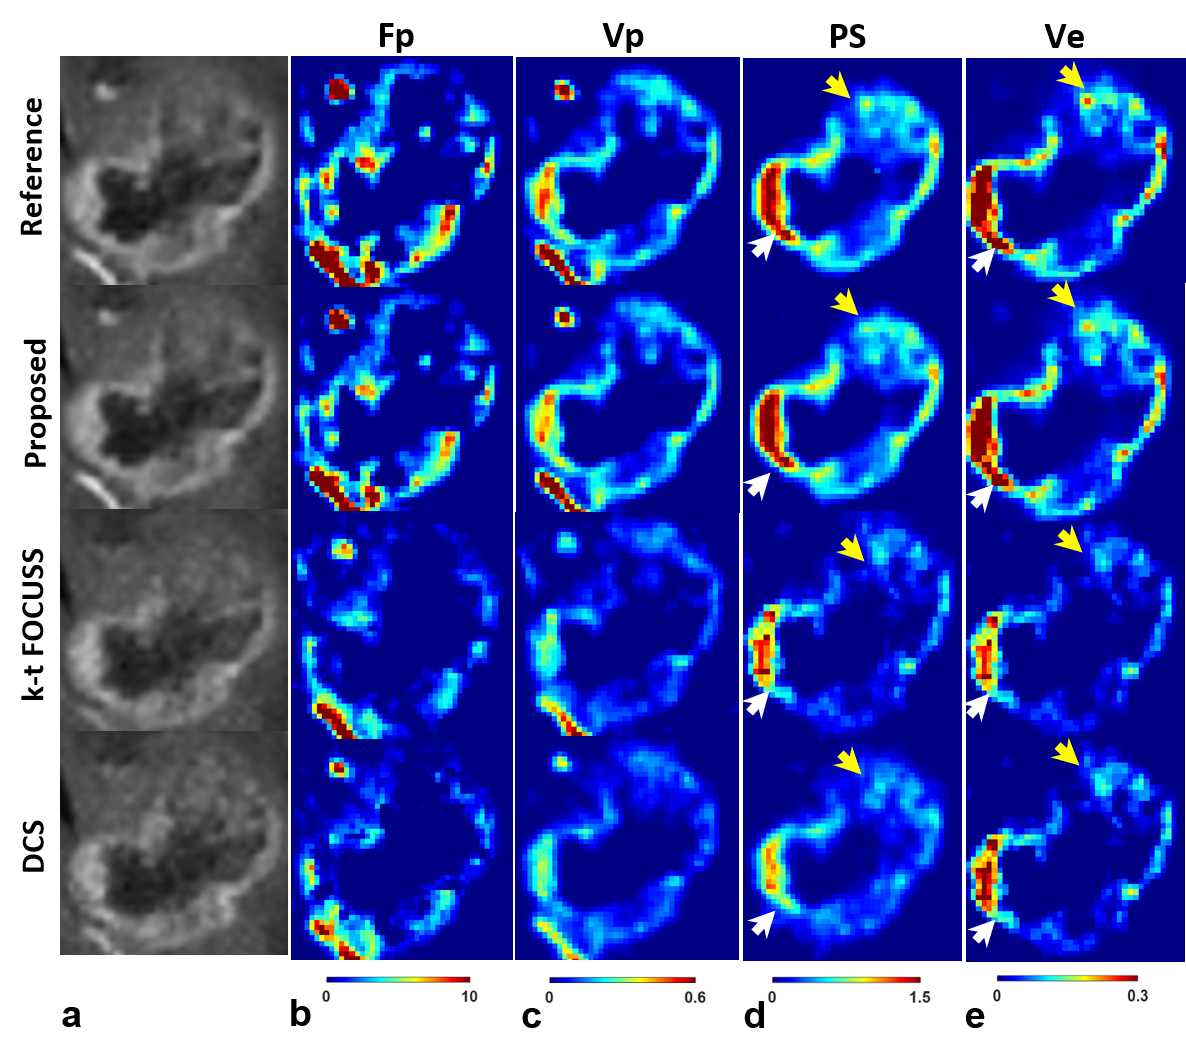
It is noted that the proposed method simultaneously produces vascular structure (Fig. 2) and microvascular functional segmentation maps (Fig. 3) in single framework, while conventional methods(k-t FOCUSS and DCS) generates both maps separately. Vascular structures are contaminated by background artifacts in conventional methods (arrows in Figs. 2c,2d) while being clearly delineated in the proposed methods (Figs. 2b) as compared to the reference (Fig. 2a). Figure 3 shows reconstructed tumor images (Figs. 3a,3b) and corresponding microvascular functional segmentation maps (W1: highly perfused (Fig. 3c), W2: hypoxic (Fig. 3d), W3: necrotic (Fig. 3e)). All reconstructed W maps in the proposed method are very close to those in the reference. However, k-t FOCUSS and DCS yield highly noisy and erroneous maps particularly in W2 and W3 in Figs. 3d and 3e. Fig 4 represents the corresponding perfusion and microvascular permeability maps using the four-parameter tracer-kinetic model, 2CXM. Unlike k-t FOCUSS,DCS, the proposed method exhibits nearly the same level of activations as the reference in all TK parameter maps.Conclusion
we successfully demonstrated the feasibility of the proposed method in jointly producing highly well-defined macrovascular structures as well as microvascular function maps in a single step directly from largely incomplete DCE measurements in patients with brain cancer. We expect that the proposed method widens its clinical utilities to various pathological diseases that accompany BBB leakages in the future.Acknowledgements
This work is supported in part by NRF-2018M3C7A1056887.References
1. Korosec, Frank R., et al. "Time‐resolved contrast‐enhanced 3D MR angiography." Mag Reson Med, 36.3, 345-351 (1996).
2. Stoyanova, Radka, et al. "Mapping tumor hypoxia in vivo using pattern recognition of dynamic contrast-enhanced MRI data." Transl Oncol, 5.6, 437 (2012)
3. Kontopodis, Eleftherios, et al. "Investigating the role of model-based and model-free imaging biomarkers as early predictors of neoadjuvant breast cancer therapy outcome." IEEE J Biomed Health Inform, 23.5, 1834-1843 (2019).
Figures