2882
3D DCE MRI of carotid plaque by dynamic T1 mapping using Single Reference Variable Flip Angle 3D Pseudo Golden Angle Stack of Stars Acquisition1UCAIR, Department of Radiology and Imaging Sciences, University of Utah, Salt Lake City, UT, United States, 2Department of Veterans Affairs, VASLCHCS, Salt Lake City, UT, United States
Synopsis
Dynamic contrast‐enhanced (DCE) MRI has been used for quantitative assessment of the neovascular architecture and perfusion properties in the carotid artery wall5. While DCE-MRI has great potential in plaque component characterization, it is presently limited by SNR, contrast, available resolution, and motion artifacts for carotid plaque application. In this work, we propose a new dynamic MRI method capable of high spatial and temporal resolution, and dynamic T1 mapping-based quantification of contrast agent concentration for the assessment of carotid intraplaque hemorrhage to overcome the barriers that prevent DCE-MRI from being the clinical standard for carotid IPH evaluation.
INTRODUCTION
Intraplaque hemorrhage (IPH) is considered an independent risk factor for acute ischemic stroke1,2. There are important questions about microvascular remodeling in IPH, its link to stroke, and the ability to target it for translational research3,4. Dynamic contrast‐enhanced (DCE) MRI has been used for quantitative assessment of the neovascular architecture and perfusion properties in the carotid artery wall5. While DCE-MRI has great potential in plaque component characterization, it is presently limited by SNR, contrast, available resolution, and motion artifacts for carotid plaque application6. In this work, we propose a new dynamic MRI method capable of high spatial and temporal resolution, and dynamic T1 mapping-based quantification of contrast agent concentration for the assessment of carotid IPH to overcome the barriers that prevent DCE-MRI from being the clinical standard for carotid IPH evaluation.METHODS
We implemented a single reference (SR) variable flip angle(VFL) method7 using a 3D pseudo golden angle stack of stars (PGA-SOS) acquisition8. To simulate the sensitivity and the optimal choice of FA for the SR- VFA in DCE of IPH, T1 measurements were simulated using a Monte Carlo technique for a range of FA. To test the feasibility of this technique, SR non-contrast DEC T1 acquisition was performed on a uniform phantom with known T1 while imaging with 3D PGA-SOS sequence. With IRB consent we also acquired DCE T1 acquisitions from four patients with known carotid. All scans were performed on a 3T MRI system with composite head and neck coils9. Dynamic T1 acquisition was started at 32 seconds before the contrast administration. A reference image was acquired at FA=5° and dynamic images were acquired at FA=20°. Other imaging parameters of 3D a PGA-SOS were: 0.7 mm isotropic dimension, 24 slices, TE/TR = 2.46/5.62 ms, 1518 projections. To Images were reconstructed using a symmetric sliding k-space weighted image contrast (KWIC) window with 377 total and 13 innermost projections10 giving an effective temporal resolution of 2.29 s. Before calculate the dynamic T1, FA was corrected by the B1 mapping method11. The original T1 value is calculated from baseline dual FA images before contrast injection. The SR-VFA T1 measurements were calculated as well as the percent change in T1 from baseline. Ktrans was created by using two compartments model12. AIF curve and tissue concentration were calculated directly from dynamic T1 maps13. Reconstructions including dynamic T1 maps and Ktrans were calculated and displayed using software written in Matlab.RESULTS
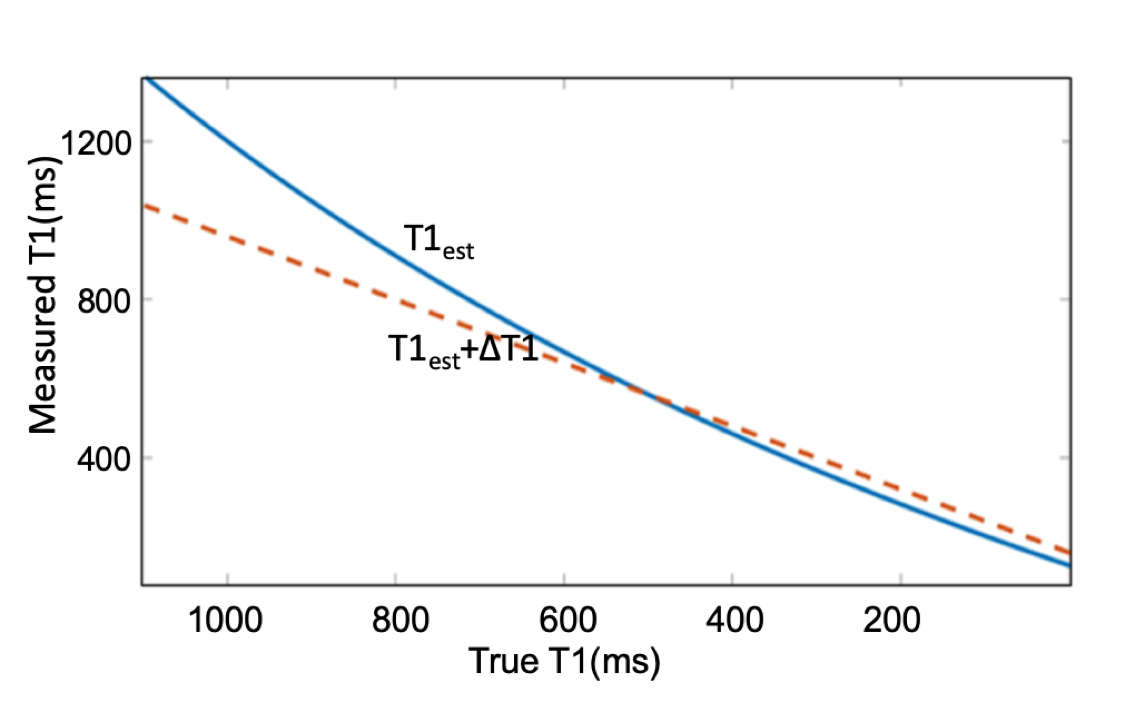
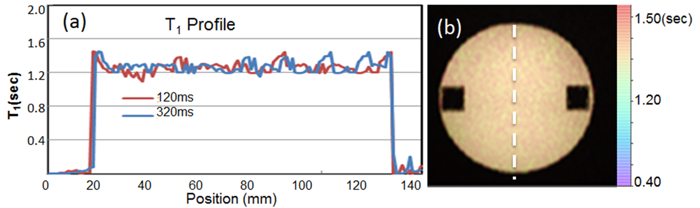
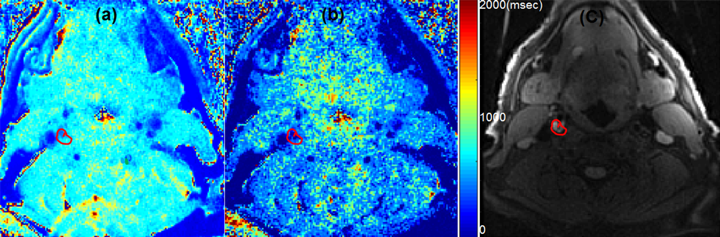
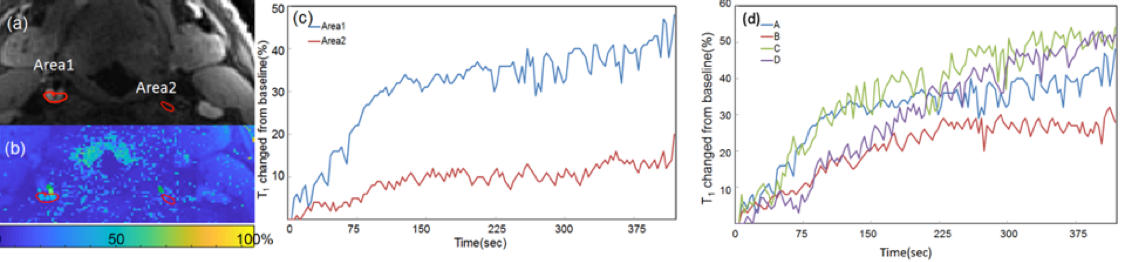
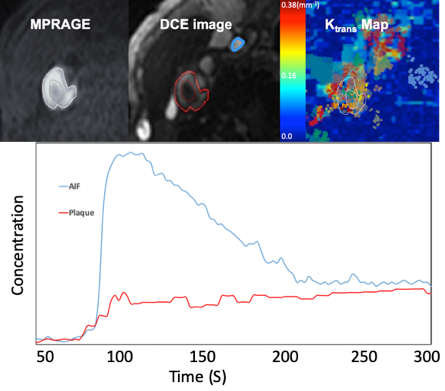
Monte Carlo simulations of SR-VFA precision are shown in Fig 1 for several values of ΔT1. The optimal choice of reference FA was 5° if initial T1 was 500ms with FA of 20o. The phantom study results are shown in the Fig 2. The dynamic T1 profiles(a) and T1 map(b) at different time t=132 and t=320 s after baseline demonstrate the relatively uniform T1 distribution across the phantom without ΔT1 correction. Fig 3 shows dynamic T1 maps of a patient with carotid atherosclerotic plaque at t = 10s(a) and t = 320s(b). The T1 value of the plaque was deceased from 570±84ms (red contour in (a)) to 275±48ms (b). Fig 4 shows the T1 map at peak time(b) of same patient and the dynamic peak time percent T1 changes(c) in area 1(plaque) and area 2(normal wall). It indicates active contrast uptake within the plaque. The dynamic percent changes on four different carotid atherosclerotic plaques acquired from four patient studies were plotted on the Fig 4d. The MPRAGE, DCE image reconstructed by using KWIC, and Ktrans map, and calculated contrast agent concentration curves of AIF(red) and IPH(blue) by using dynamic T1 changes of a patient with IPH were shown on Fig 5. Mean Ktrans in IPH (red contour) was 0.21±0.11 mm-1.DISCUSSION
The SR-VFA T1 method provides the possibility for dynamic T1 measurement in carotid plaque with high temporal and spatial resolution when combined with a PGA-SOS sequence reconstructed with a sliding KWIC window. The dynamic percent T1 changes and DCE can provide the direct contrast uptake quantification, which may be more predictive of plaque vulnerability and a better metric to monitor treatment effects compared to visual inspection. Our DCE kinetic parameters of patients are in line with the values in literatures5. The precision of the T1 measurement can be optimized with proper choice of FA. Using a VFA method will amplify noise through its nonlinear nature of calculating T1. For standard VFA, the ideal choice of FA will produce ~71% of Ernst angle signal with the two FA on different sides of the Ernst angle. A more accurate estimate of the percent of the Ernst angle signal could be simulated with much finer FA increments, or possibly an exact estimate could be derived14.CONCLUSION
DCE kinetic parameters calculated by using dynamic T1 measurement proposed in this work may provide important information for investigators interested in quantifying plaque vulnerability and monitoring treatment effects.Acknowledgements
Supported by R01 HL127582, RSNA Research Scholar Grant RSCH1414, AHA Scientist Development Grant 17SDG33460420, Siemens Medical Solutions, the Clinical Merit Review Grant from the Veterans Administration health Care System.References
1. Moody AR, Murphy RE, Morgan PS, et al. Characterization of complicated carotid plaque with magnetic resonance direct thrombus imaging in patients with cerebral ischemia. Circulation. 2003;107(24):3047-3052.
2. McNally JS, Kim S-E, Yoon H-C, et al. Carotid magnetization-prepared rapid acquisition with gradient-echo signal is associated with acute territorial cerebral ischemic events detected by diffusion-weighted MRI. Circ Cardiovasc Imaging. 2012;5(3).
3. Virmani R, Kolodgie FD, Burke AP, et al. Atherosclerotic plaque progression and vulnerability to rupture: Angiogenesis as a source of intraplaque hemorrhage. Arterioscler Thromb Vasc Biol. 2005;25(10):2054-2061.
4. Lappalainen H, Laine P, Pentikäinen MO, Sajantila A, Kovanen PT. Mast cells in neovascularized human coronary plaques store and secrete basic fibroblast growth factor, a potent angiogenic mediator. Arterioscler Thromb Vasc Biol. 2004;24(10):1880-1885.
5. Kerwin WS, O’Brien KD, Ferguson MS, Polissar N, Hatsukami TS, Yuan C. Inflammation in carotid atherosclerotic plaque: A dynamic contrast-enhanced MR imaging study. Radiology. 2006;241(2):459-468.
6. Calcagno C, Lobatto ME, Dyvorne H, et al. Three-dimensional dynamic contrast-enhanced MRI for the accurate, extensive quantification of microvascular permeability in atherosclerotic plaques. NMR Biomed. 2015;28(10):1304-1314.
7. Svedin BT, Payne A, Parker DL. Simultaneous proton resonance frequency shift thermometry and T1 measurements using a single reference variable flip angle T1 method. Magn Reson Med. 2019;81(5):3138-3152.
8. Svedin BT, Payne A, Bolster BD, Parker DL. Multiecho pseudo-golden angle stack of stars thermometry with high spatial and temporal resolution using k-space weighted image contrast. Magn Reson Med. 2018;79(3):1407-1419.
9. Beck MJ, Parker DL, Bolster BD, et al. Interchangeable neck shape–specific coils for a clinically realizable anterior neck phased array system. Magn Reson Med. 2017;78(6):2460-2468.
10. Lin W, Guo J, Rosen MA, Song HK. Respiratory motion-compensated radial dynamic contrast-enhanced (DCE)-MRI of chest and abdominal lesions. Magn Reson Med. 2008;60(5):1135-1146.
11. Chung S, Kim D, Breton E, Axel L. Rapid B1+ mapping using a preconditioning RF pulse with turboFLASH readout. Magn Reson Med. 2010;64(2):439-446.
12. Tofts PS, Brix G, Buckley DL, et al. Estimating kinetic parameters from dynamic contrast-enhanced T1- weighted MRI of a diffusable tracer: Standardized quantities and symbols. J Magn Reson Imaging. 1999;10(3):223-232.
13. Wang N, Christodoulou AG, Xie Y, et al. Quantitative 3D dynamic contrast‐enhanced (DCE) MR imaging of carotid vessel wall by fast T1 mapping using Multitasking. Magn Reson Med. 2019;81(4):2302-2314.
14. Schabel MC, Morrell GR. Uncertainty in T1 mapping using the variable flip angle method with two flip angles. Phys Med Biol. 2009;54(1).
Figures