2868
Improved signal integrity in multi-echo fMRI through locally low-rank tensor regularization1Mayo Clinic Graduate School of Biomedical Sciences, Rochester, MN, United States, 2Radiology, Mayo Clinic, Rochester, MN, United States
Synopsis
Locally low-rank (LLR) regularization is extended to a multi-echo tensor framework for resting-state fMRI, building on previous generalizations of LLR frameworks. We demonstrate substantial increases in temporal SNR with improved robustness in mapping default mode, auditory, and sensorimotor resting-state connectivity networks in a preliminary seed-based analysis.
Introduction
Blood oxygenation level dependent (BOLD) functional magnetic resonance imaging (fMRI)1 in the clinic enables task-based2-4 and resting-state (rs)5-9 physiologic imaging of the brain. Limitations of fast acquisitions (e.g., echo planar imaging [EPI]) enabling functional imaging are inherited by fMRI data, including relatively low signal to noise ratio (SNR) and spatial/temporal resolution along with artifacts, especially signal dropout in regions of susceptibility.10,11 These limitations yield uncertainty in derived activation maps, confounding interpretation and impeding widespread clinical adoption of rs-fMRI.12,13 Advances in system design and next-generation scanners such as the compact 3T14,15 used herein afford enhanced resolution, SNR, and robustness to artifacts, but acceleration techniques required to achieve ultramodern functional acquisitions introduce tradeoffs. Simultaneous multi-slice (SMS) imaging16-21 improves spatial and/or temporal resolution, but with decreased temporal SNR (tSNR) at higher acceleration factors, especially combined with in-plane techniques.22 Multi-echo (ME) fMRI improves performance in regions of susceptibility and boosts statistical power for detecting functional signals,10 but shares SNR limitations when combined with acceleration methods. EPI-based fMRI thus remains SNR limited.We previously adapted locally low-rank (LLR)23-26 regularization ("denoising") for single-echo task-based fMRI, demonstrating increased statistical confidence in derived activation maps following LLR denoising of complex-valued data.27 Here we extend LLR regularization to the multi-echo image time series tensor, adapting previous generalizations28-32 and yielding improved signal integrity and stronger correlation networks achieved at group level for ME-fMRI.
Methods
Define $$$\mathbf{G}=\mathbf{X}+\mathbf{Z}$$$ as an $$$N\times{T}\times{E}$$$ 3-way tensor of dimensions space, time, and echoes. The complete solution of estimating $$$\mathbf{X}$$$ must be determined iteratively. However, the first iteration result arising from a variable splitting approach typically yields sufficient performance and is reported herein. We estimate $$$\hat{\mathbf{X}}$$$ with singular value thresholding33 (SVT) of a specific matricization of $$$\mathbf{G}$$$, i.e.$$\hat{\mathbf{X}}=Q^{-1}C_{(2)}^{-1}\bigg\{\sum_b(I\otimes{R_b})^*SVT_\lambda\big\{(I\otimes{R_b})C_{(2)}\{\mathbf{G}\}\big\}\bigg\}$$
where $$$Q=\sum_b{R_b^*R_b}$$$, $$$R_bC_{(n)}\{\mathbf{U}\}$$$ denotes extraction by binary operator $$$R_b$$$ of a spatial submatrix $$$b$$$ from the $$$n$$$th matricization of tensor $$$\mathbf{U}$$$, $$$\Omega$$$ is the set of overlapping blocks of size $$$\beta$$$ tiling the tensor spatial dimension, $$$\otimes$$$ is the Kronecker product, and $$$\lambda$$$ is a regularization parameter. Here, $$$C_{(2)}\{\mathbf{G}\}$$$ is the $$$NE\times{T}$$$ matricization of $$$\mathbf{G}$$$, orthogonally separating space and echoes from time.
Seven healthy volunteers were scanned under an institutional review board protocol. Whole-brain ME-fMRI acquisition at $$$1810$$$ ms $$$TR$$$ was enabled by a high gradient performance compact 3T (C3T) scanner.14,15 Resting-state fMRI data were collected using a $$$32$$$-channel head coil with imaging parameters $$$N_x\times{N_y}\times{N_z}\times{N_t}=160\times{160}\times{51}\times{234}$$$, $$$22.4$$$ cm FOV, $$$74^{\circ}$$$ flip angle, $$$3\times{3}$$$ through-plane (SMS) and in-plane (ARC) acceleration, and $$$TE=12.10,34.29,$$$ and $$$56.57$$$ ms. A sagittal MPRAGE facilitated registration. Cardiac and respiratory data were collected during fMRI.
Multi-echo fMRI data were jointly denoised with LLR tensor regularization in Matlab on DICOM image data with $$$\beta=8,\lambda=25$$$. Two initial TRs were discarded preceding LLR denoising or functional processing for control.34 Control and LLR-denoised data were then equivalently processed using Analysis of Functional Neuroimages (AFNI), working from afni_proc.py.35 Processing steps included despiking, physiologic nuisance signal removal (RETROICOR),36 slice timing adjustment, alignment and volume registration, T2*-weighted echo combination,11,37 $$$4$$$ mm full-width at half-maximum (FWHM) Gaussian spatial smoothing, and motion- and hardware-related linear regression (ANATICOR).38 Resulting residual time series datasets were atlased to the TT_N27 template.
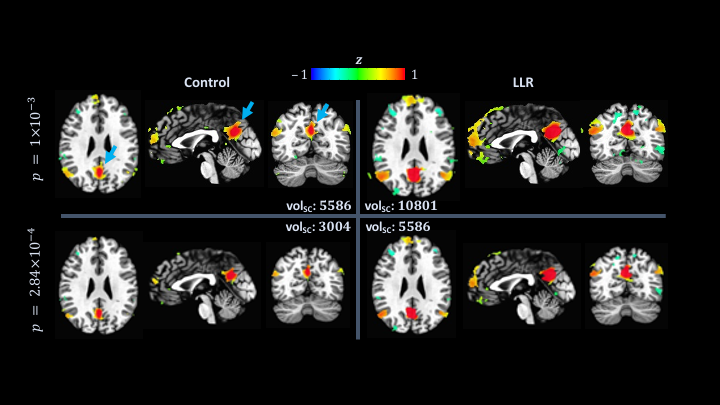
Functional connectivity analysis entailed computing seed-based correlation maps of the default mode, auditory, and sensorimotor networks. For each network, a $$$5$$$ mm radius ($$$515$$$ voxels) sphere was manually placed within the template and used as a standard mask of atlased individual residual time series for control and LLR-denoised data. Resulting mean time series seeds were used for each subject, processing variant, and network in correlation analysis. Correlation maps were converted to Fisher $$$z$$$-scores for group-level analysis with one-sided $$$t$$$-tests.
Results
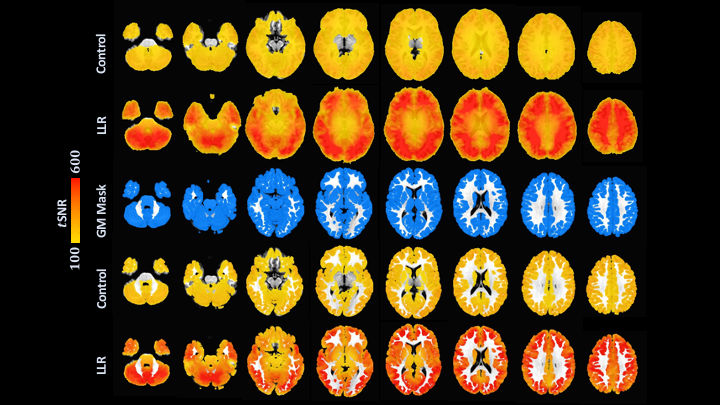
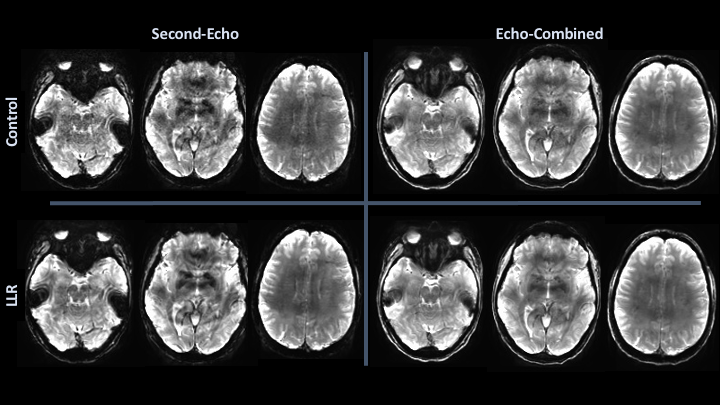
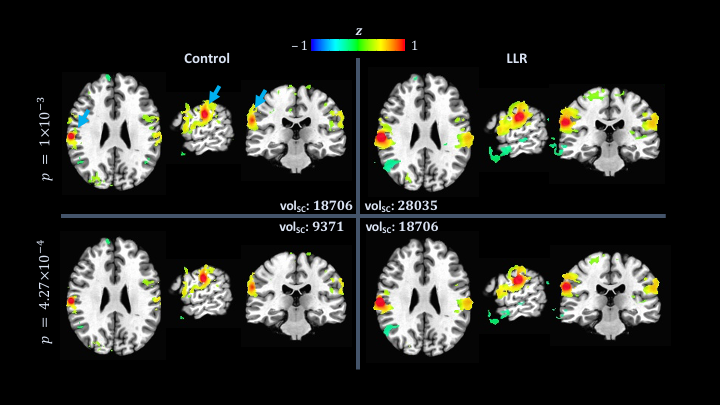
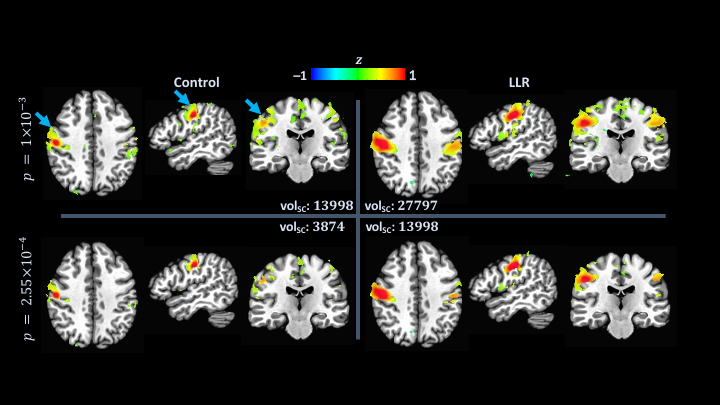
LLR denoising provides a substantial quantified increase in temporal signal-to-noise ratio (tSNR). LLR-denoised echo-combined mean global tSNR, grey-matter masked tSNR, and default mode, auditory, and sensorimotor network seed tSNRs were $$$251\%$$$, $$$240\%$$$, $$$180\%$$$, $$$234\%$$$, and $$$210\%$$$ of respective control tSNRs. LLR-denoised data better preserves tSNR in regions of susceptibility, demonstrated in Figure 1. Static image SNR is reported for one subject visually in Figure 2, showing improvements in single-echo and combined-echo image quality through joint denoising. In group-level analysis, LLR denoising afforded robust mapping of default mode, auditory, and sensorimotor resting-state connectivity networks as shown in Figures 3, 4, and 5 with $$$93.3\%$$$, $$$49.9\%$$$, and $$$98.6\%$$$ increases in seed-containing cluster volumes at fixed $$$p=1\times{10}^{-3}$$$.Discussion
Locally low-rank tensor regularization of multi-echo fMRI data yields highly increased tSNR with robustly improved network connectivity maps compared with equivalently processed control data. Increases in tSNR are preserved in regions adjacent to susceptibility. LLR tensor regularization for multi-echo fMRI thus improves functional signal integrity, boosts connectivity detection and introduces potential to reduce scan time leveraging increased tSNR.39 A systematic comparison with existing smoothing methods, functional processing pipeline optimization, and extension to independent components analysis (ICA) is omitted in this preliminary work but will soon be pursued.Conclusion
Locally low-rank regularization extended to a multi-echo tensor framework for resting-state fMRI yields substantial increases in temporal SNR and improved robustness of mapping resting-state connectivity networks demonstrated in a preliminary seed-based analysis.Acknowledgements
This work was supported by NIH Grants U01 EB024450 and U01 EB026979 and the National Science Foundation Graduate Research Fellowship Program (GRFP).References
1. Ogawa S, Lee TM et al. Brain magnetic resonance imaging with contrast dependent on blood oxygenation. Proc Natl Acad Sci USA. 1990; 87(24):9868-9872.
2. Black DF, Vachha B et al. American Society of Functional Neuroradiology–Recommended fMRI Paradigm Algorithms for Presurgical Language Assessment. Am J Neuroradiol. 2017, 38:E65–E73.
3. Mahdavi A, Azar R et al. "Functional MRI in clinical practice: Assessment of language and motor for pre-surgical planning". Neuroradiol J. 2015; 28(5):468-473.
4. Vysotski S, Madura C et al. Preoperative FMRI Associated with Decreased Mortality and Morbidity in Brain Tumor Patients. Interdiscip Neurosurg. 2018; 13:40-45.
5. Lee MH, Smsyer CD, Shimony JS. Resting-state fMRI: a review of methods and clinical applications. AJNR Am J Neuroradiol . 2013 Oct;34(10):1866-72.
6. Dierker D, Roland JL et al. Resting state fMRI in Presurgical Functional Mapping: Sensorimotor Localization. Neuroimaging Clin N Am. 2017 Nov; 27(4): 621–633.
7. Kumar VA, Heiba IM et al. The role of resting-state functional MRI for clinical preoperative language mapping. Cancer Imaging 2020; 20(1):47.
8. Park KY, Lee JJ et al. Mapping language function with task-based vs. resting-state functional MRI. PLoS One. 2020; 15(7): e0236423.
9. Lee MH, Miller-Thomas MM et al. Clinical Resting-state fMRI in the Preoperative Setting: Are We Ready for Prime Time? Top Magn Reson Imaging . 2016 Feb;25(1):11-8.
10. Kundu P, Voon V et al. Multi-echo fMRI: A review of applications in fMRI denoising and analysis of BOLD signals. NeuroImage 2017; 154:59-80.
11. Kundu P, Inati SJ et al. Differentiating BOLD and non-BOLD signals in fMRI time series using multi-echo EPI. NeuroImage 2012, 60(3): 1759-1770.
12. O'Connor EE, Zeffiro TA. Why is Clinical fMRI in a Resting State? Front Neurol. 2019; 10:420.
13. Specht K. Current Challenges in Translational and Clinical fMRI and Future Directions. Front Psychiatry. 2019; 10:924.
14. Foo TK, Laskaris E et al. Lightweight, compact, and high-performance 3T MR system for imaging the brain and extremities. Magn Reson Med. 2018;80:2232-2245.
15. Kang D, Jo HJ et al. Feasibility of high spatial and temporal resolution multi-echo multi-band whole brain resting-state functional MRI on a compact 3T system. Proc Intl Soc Mag Reson Med. 2020; 1218.
16. Nunes RG, Hajnal JV et al. Simultaneous slice excitation and reconstruction for single shot EPI. Proc Intl Soc Mag Reson Med. 2006; 293.
17. Larkman DJ, Hajnal JV et al. Use of multicoil arrays for separation of signal from multiple slices simultaneously excited. J Magn Reson Imaging. 2001; 13(2):313-317.
18. Moeller S, Yacoub E et al. Multiband multislice GE-EPI at 7 tesla, with 16-fold acceleration using partial parallel imaging with application to high spatial and temporal whole-brain fMRI. Magn Reson Med. 2010; 63(5):1144-1153.
19. Setsompop K, Gagoski BA et al. Blipped-controlled aliasing in parallel imaging for simultaneous multislice echo planar imaging with reduced g-factor penalty. Magn Reson Med. 2012; 67(5):1210-1224.
20. Barth M, Breuer F et al. Simultaneous multislice (SMS) imaging techniques. Magn Reson Med. 2016; 75(1):63-81.
21. Mark IT, Black DF et al. Higher temporal resolution multiband fMRI provides improved presurgical language maps. Neuroradiology 2020.
22. P Seidel, Levine SM et al. Temporal Signal-to-Noise Changes in Combined Multislice- and In-Plane-Accelerated Echo-Planar Imaging with a 20- and 64-Channel Coil. Scientific Reports 2020; 10:5536.
23. Trzasko JD, Manduca A. Local versus Global Low-Rank Promotion in Dynamic MRI Series Reconstruction. Proc Intl Soc Mag Reson Med. 2011; 4371.
24. Candes EJ; Sing-Long CA; Trzasko JD. Unbiased Risk Estimates for Singular Value Thresholding and Spectral Estimators. IEEE Trans Signal Process. 2013; 61(19):4643-4657.
25. Zhang T, Pauly JM, Levesque IR. Accelerating Parameter Mapping with a Locally Low Rank Constraint. Magn Reson Med. 2015; 73(2):655-661.
26. Hu Y, Levine EG et al. Motion‐robust reconstruction of multishot diffusion‐weighted images without phase estimation through locally low‐rank regularization. Magn Reson Med. 2019; 81(2):1181-1190.
27. Meyer NK, Campeau NG et al. Locally low-rank denoising of complex-valued EPI reconstructions preceding task fMRI analysis. Proc Intl Soc Mag Reson Med. 2020; 3877.
28. Trzasko JD. Exploiting Local Low-Rank Structure in Higher-Dimensional MRI Applications. Proc. SPIE 2013; Wavelets and Sparsity XV; 885821.
29. Yaman B, Weingärtner, S et al. Locally Low-Rank Tensor Regularization for High-Resolution Quantitative Dynamic MRI. Int Workshop Comput Adv Multisens Adapt Process. 2017.
30. Trzasko JD, Manduca A. A Unified Tensor Regression Framework for Calibrationless Dynamic, Multi-Channel MRI Reconstruction. Proc Intl Soc Mag Reson Med. 2013, 0603.
31. Gandy S, Recht B, Yamada I. Tensor completion and low-n-rank tensor recovery via convex optimization. Inverse Problems 2011; 27(2):025010.
32. Guo S, Fessler JA, Noll DC. High-Resolution Oscillating Steady-State fMRI Using Patch-Tensor Low-Rank Reconstruction. IEEE Trans Med Imaging. 2020; 39(12):4357-4368.
33. Cai JF, Candes EJ, Shen Z. A Singular Value Thresholding Algorithm for Matrix Completion. SIAM J Optim. 2010; 20(4):1956-1982.
34. Caballero-Gaudes C, Reynolds RC. Methods for cleaning the BOLD fMRI signal. NeuroImage 2017; 154:128-149.
35. Cox RW. AFNI: Software for analysis and visualization of functional magnetic resonance neuroimages. Comput Biomed Res. 1996; 29:162-173.
36. Glover GH, Li TQ, Ress D. Image-based method for retrospective correction of physiological motion effects in fMRI: RETROICOR. Magn Reson Med. 2000 Jul;44(1):162-167.
37. Posse S, Wiese S et al. Enhancement of BOLD-contrast sensitivity by single-shot multi-echo functional MR imaging. Magn Reson Med . 1999 Jul;42(1):87-97.
38. Jo HJ, Saad ZS et al. Mapping sources of correlation in resting state FMRI, with artifact detection and removal. NeuroImage 2010; 52(2):571-582.
39. Murphy K, Bodurka J, Bandettini BA. How long to scan? The relationship between fMRI temporal signal to noise and necessary scan duration. NeuroImage 2007, 34(2): 565-574.
Figures