2866
Hemodynamic simulations reveal changes in ascending venules leads to enhanced venous CBV response to arterial dilation.1Athinoula A. Martinos Center for Biomedical Imaging, Boston, MA, United States
Synopsis
Here we extend a recent approach employing biophysical simulations of realistic cortical microvascular anatomy and dynamics to test whether the topology of the microvasculature impact the BOLD response. We create 3D vascular anatomical networks with varying ratios of arteries to venules and simulated the effects on cerebral blood flow and volume responses. We observed a difference in the cerebral blood volume response after we varied the ratio of diving arteries to ascending veins.
Summary of Main Findings
We adapted realistic models of cortical microvasculature to alter the topology of the vascular network and performed dynamical simulations of blood flow and volume changes following neural activity. We find that the topology changes cause qualitatively different blood volume responses.Introduction
Although it is well known that vascular anatomy has a strong influence on the functional magnetic resonance imaging (fMRI) signal, recent biophysical simulations based on reconstructions of cortical microvasculature predicted unexpected effects imposed by the geometry of the microvascular network that were later confirmed experimentally. Here we extend this approach by asking whether the topology of the microvascular network imparts similar effects on the BOLD response temporal characteristics. Cortical microvascular topology varies between species, brain regions, and cortical depth1–3, and these changes in the angioarchitecture may be one contributing factor to the observed differences in hemodynamics. In order to investigate in isolation the impact of topological properties of the microvascular network on the hemodynamic response to neural activity, we employed a recently developed methodology to synthesize realistic microvascular models matched to the statistical distributions reported from published optical microscopy studies4,5, which allow for parametric variation of several network parameters of interest while holding other properties constant. In this preliminary study, we varied the ratio of intracortical penetrating arteries to ascending venules, which is known to vary across species1, to investigate whether this results in a measurable effect on the temporal properties of the BOLD response.Methods
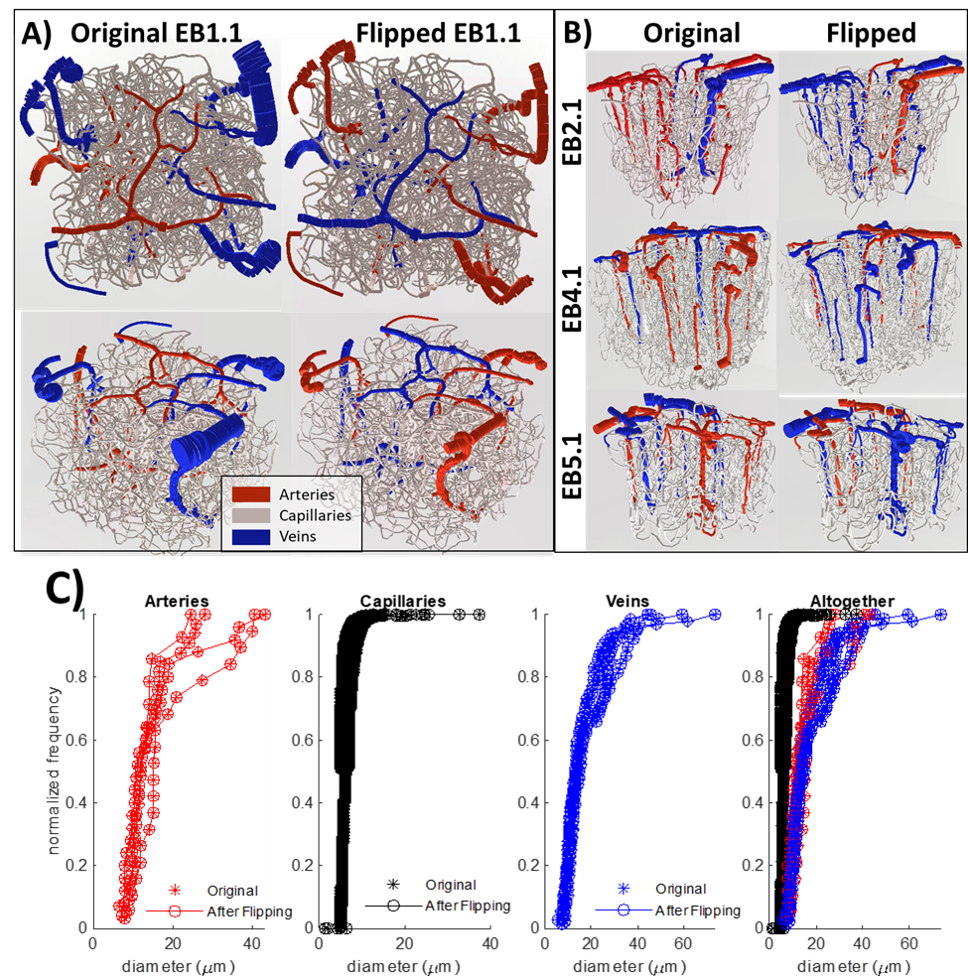
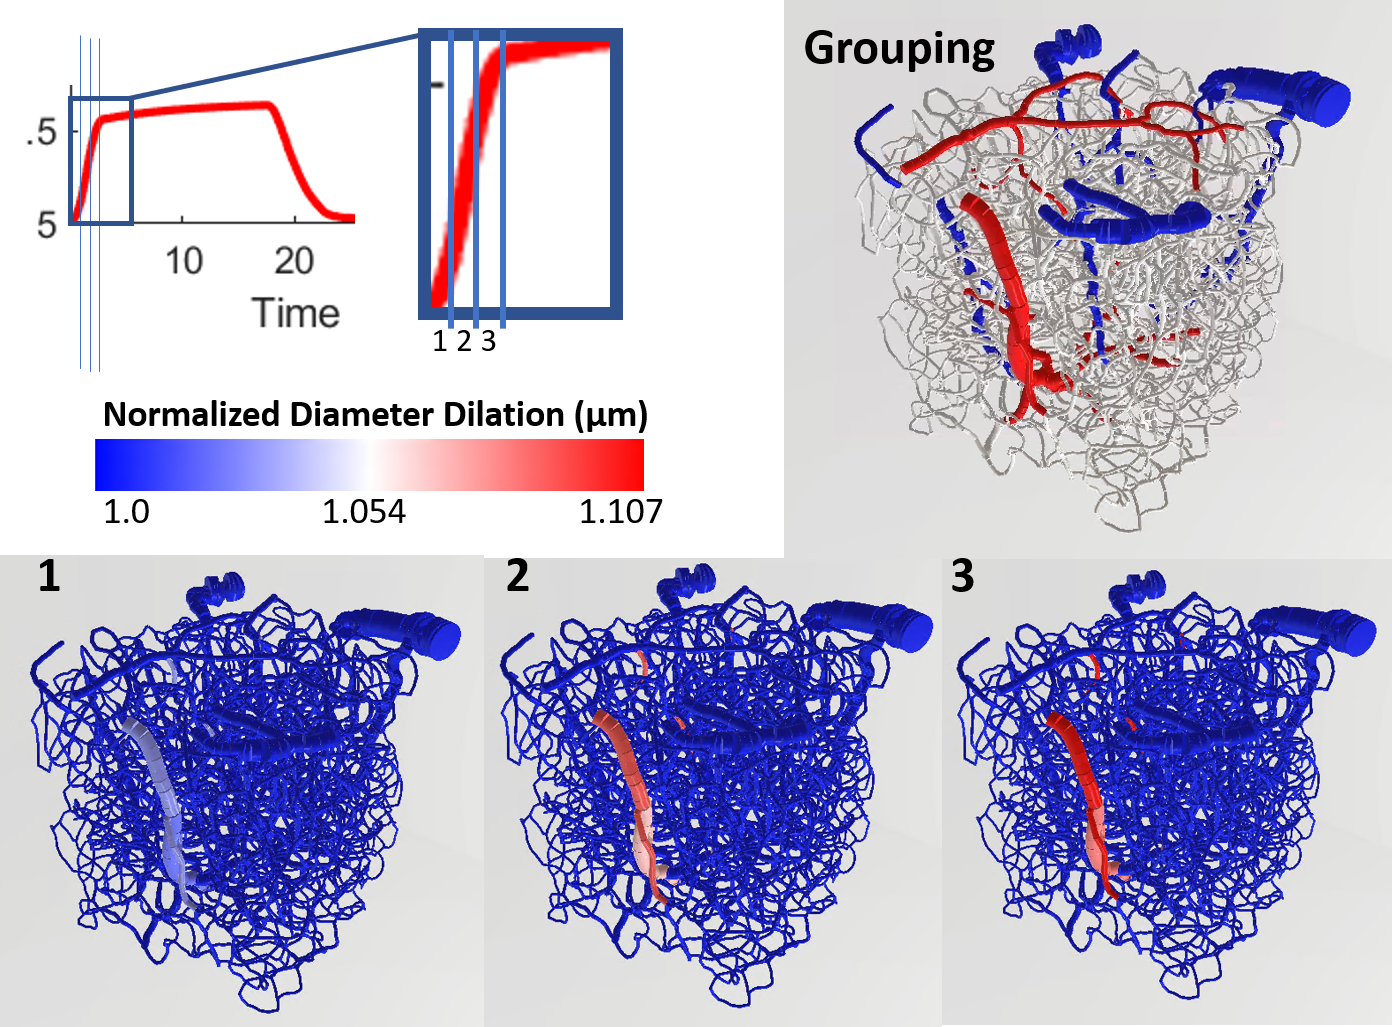
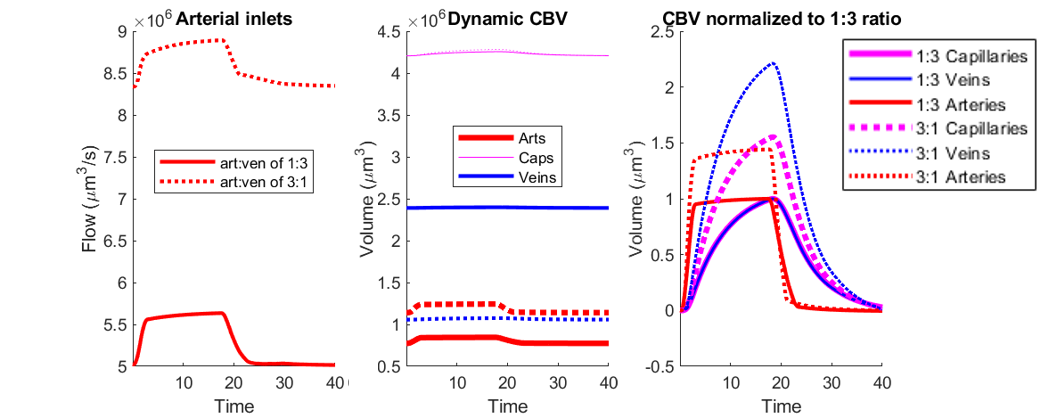
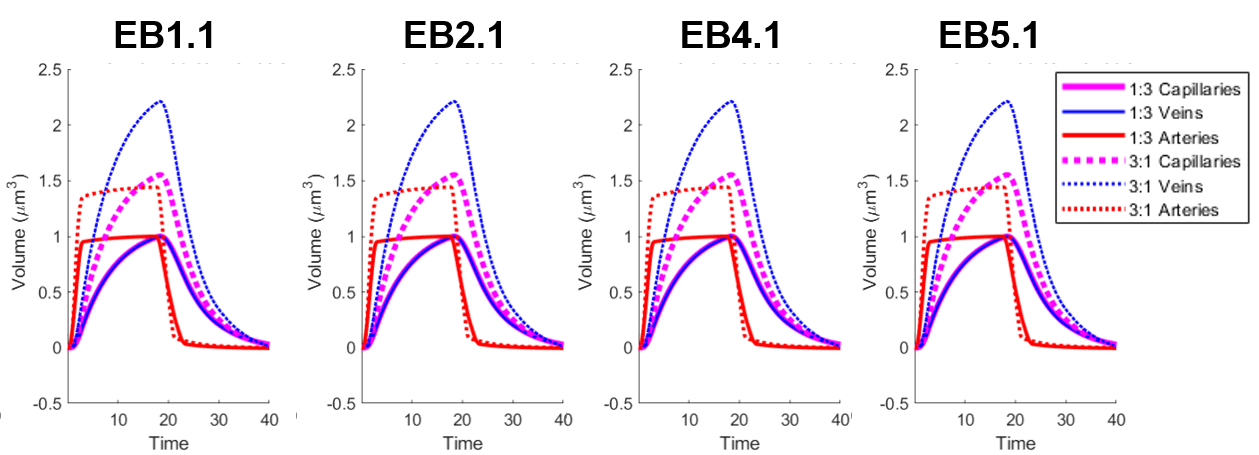
Using a previously described simulation platform6, we computed the cerebral blood volume (CBV) changes during functional hyperemia in image-derived, realistic vascular anatomical networks (VANs). The native model exhibited a 1:3 ratio of penetrating arterioles to ascending venules7 that is reflected in the mouse cortex. To isolate and test the opposing topological configuration (3:1 ratio as observed in humans), we imposed the anatomical grouping, simulation parameters, and the diameter spectra (using a topological matching algorithm5) from the arteries onto the veins and vice versa. We generated a total of four vascular models8,9, each with a 1:3 and 3:1 configuration. This vascular synthesis approach was implemented in Object Pascal with simulations conducted in Matlab. With these models in place, the resulting blood flow and volume dynamics were calculated as previously described7,8. For both models the arteries underwent the same amplitude of active arterial dilation for a prolonged period of 17.5 s during which time the capillaries and veins exhibited a passive compliance as described previously10.Results
We observed an initial rise in the arterial cerebral blood volume (CBV) followed by a slow onset of venous and capillary ballooning that reached its peak at the end of the arterial dilation period as visualized in Figure 1. When comparing the native model (1:3 ratio) to the swapped model (3:1 ratio), we noticed a CBV increase during activation in the swapped model in conjunction with an increase in overall blood perfusion. Because the swapping of arteries and veins increases the arterial volume, this increased CBV in all compartments could be explained by the immediate increase in actively dilated vessels. The accompanying decrease in baseline venous volume reduces the venous ballooning, but not enough to eradicate the increased CBV changes seen in the swapped model.Discussion
One of the fundamental assumptions in functional brain imaging, specifically in fMRI acquisition, is does not account for vascular differences between brain regions and species. We note that here we imposed an identical arteriolar dilation in both cases. While it may be the case in brain regions with more arteries less dilation is needed to supply the capillary bed, further simulations are underway to evaluate several possible scenarios of arterial dilation. Our findings suggest that the microvascular topology may influence the BOLD signal implying that this may be one contribution to the observed differences in the BOLD response between brain regions and species. Prior work has also suggested that differences in vascular topology could impact the BOLD signal11. This aspect of the BOLD response is likely independent of neuronal response, although vascular topology may reflect local neural architecture2. If these vasculature-dependent effects can be characterized, future fMRI studies can be enriched by further isolating the vascular-independent portion of the signal and achieve improved neural specificity.Acknowledgements
This work was supported in part by the NIH NIBIB (grant P41-EB030006 and R01-EB019437), by the BRAIN Initiative (NIH NIMH grants R01-MH111419, R01-MH111438, and F32-MH125599), and by the MGH/HST Athinoula A. Martinos Center for Biomedical Imaging; and was made possible by the resources provided by NIH Shared Instrumentation Grant S10-RR023043.References
1. Schmid, F., Barrett, M. J. P., Jenny, P. & Weber, B. Vascular density and distribution in neocortex. NeuroImage (2017) doi:10.1016/j.neuroimage.2017.06.046.
2. Tsai, P. S. et al. Correlations of Neuronal and Microvascular Densities in Murine Cortex Revealed by Direct Counting and Colocalization of Nuclei and Vessels. J. Neurosci. 29, 14553–14570 (2009).
3. Smith, A. F. et al. Brain capillary networks across species: a few simple organizational requirements are sufficient to reproduce both structure and function. Front. Physiol. 10, 233 (2019).
4. Linninger, A., Hartung, G., Badr, S. & Morley, R. Mathematical synthesis of the cortical circulation for the whole mouse brain-part I: theory and image integration. Comput. Biol. Med. (2019).
5. Hartung, G. et al. Mathematical synthesis of the cortical circulation for the whole mouse brain-Part II: microcirculatory closure. Comput. Biol. Med. ((In Review)).
6. Fang, Q. et al. Oxygen Advection and Diffusion in a Three Dimensional Vascular Anatomical Network. Opt. Express 16, 17530–17541 (2008).
7. Gagnon, L. et al. Quantifying the Microvascular Origin of BOLD-fMRI from First Principles with Two-Photon Microscopy and an Oxygen-Sensitive Nanoprobe. J. Neurosci. 35, 3663–3675 (2015).
8. Gagnon, L. et al. Validation and optimization of hypercapnic-calibrated fMRI from oxygen-sensitive two-photon microscopy. Philos. Trans. R. Soc. B Biol. Sci. 371, 20150359 (2016).
9. Gagnon, L. et al. Modeling of Cerebral Oxygen Transport Based on In vivo Microscopic Imaging of Microvascular Network Structure, Blood Flow, and Oxygenation. Front. Comput. Neurosci. 10, (2016).
10. Boas, D. A., Jones, S. R., Devor, A., Huppert, T. J. & Dale, A. M. A vascular anatomical network model of the spatio-temporal response to brain activation. NeuroImage 40, 1116–1129 (2008).
11. Báez-Yáñez, M. G., Siero, J. & Petridou, N. Investigation of the dynamic fingerprint of the BOLD fMRI signal based on a novel statistical 3D cortical vascular network of the human brain.
Figures