2865
Improving the predictive power of The Virtual Brain in healthy and neurodegenerative diseases with cerebro-cerebellar loops integration.1Brain Connectivity Center Research Department, IRCCS Mondino Foundation, Pavia, Italy, 2Brain and Behavioral Sciences, University of Pavia, Pavia, Italy, 3NMR Research Unit, Queen Square MS Centre, Department of Neuroinflammation, UCL Queen Square Institute of Neurology, Faculty of Brain Sciences, UCL, London, United Kingdom
Synopsis
The Virtual Brain (TVB) has been recently developed to simulate whole-brain dynamics in healthy and pathological conditions, including only cerebral nodes. However, it has been demonstrated that the integration of cerebro-cerebellar connections in TVB can improve its predictive power. Thus, in this study we integrated cerebro-cerebellar connectivity in TVB simulation exploring its impact on prediction of brain dynamics in three different conditions: healthy, Alzheimer’s disease and Frontotemporal Spectrum Disorder. Notably we demonstrated that cerebro-cerebellar circuits integration in the TVB further improve its predictive power, both in healthy and pathological states.
Introduction
The Virtual Brain (TVB1,2) is a novel neuroinformatic platform developed to simulate whole-brain dynamics starting from individual structural (SC) and functional connectivity (FC). To date the TVB has been used to characterize brain dynamics of both healthy and pathological subjects, including Alzheimer’s disease (AD) patients3. However, only cerebral nodes and their connections have been considered. Notably, it has recently been demonstrated that the integration of cerebro-cerebellar loops in the TVB can improve its capability of predicting brain activity4. Moreover, cerebellar impairment has been confirmed in several forms of dementia, from AD5 to Frontotemporal Spectrum Disorder6 (FTSD). For all these reasons, here we integrated cerebro-cerebellar connections in the TVB to assess the cerebellar impact on brain dynamics generation and to investigate its role in different physiological, i.e. healthy controls (HC), and neurodegenerative conditions, i.e. AD and FTSD.Methods
Subjects: Five HC (54±7.79 years, 2 males), five patients diagnosed with AD (73±7.33 years, 3 males) and five patients diagnosed with FTSD (67±6.26 years, 4 males) underwent MRI examination using a 3T Siemens Skyra scanner. The protocol included resting-state fMRI (rs-fMRI) (T2∗-weighted GRE-EPI sequence, TR/TE=3010/20ms; voxel=2.5x2.5x2.5mm3 isotropic,120 volumes), diffusion weighted images (SE-EPI sequence, TR/TE=10000/97ms, voxel=2x2x2mm3 isotropic, 64 diffusion-weighted directions, b=1200s/mm2, 10 b0-images), and 3DT1-weighted volume (MPRAGE sequence, TR/TE/TI=2.3/2.95/900ms, voxel=1x1x1.2mm3).Preprocessing and tractography: 3DT1-weighted images were segmented (FSL7) as white matter, gray matter (GM), subcortical GM and cerebrospinal fluid (CSF). 30 million streamlines whole-brain Anatomically-Constrained Tractography was performed (MRtrix38), estimating fibers orientation distribution with multi-shell multi-tissue CSD and using probabilistic streamline tractography.
fMRI processing: fMRI data processing was performed using the Data Processing Assistant for Resting-State fMRI (DPARSF9, v.5.1) within SPM12. Slice-timing correction, realignment, co-registration to 3DT1-weighted data, polynomial detrending, nuisance regression of 24 motion parameters and CSF, and temporal band-pass filtering (0.008-0.09 Hz) were performed.
Structural and functional connectivity matrices: SC and FC matrices were estimated from tractography results and rs-fMRI of each subject. An ad-hoc atlas was created combining 93 cerebral (including cortical/subcortical structures) and 33 cerebellar (SUIT10) labels. The parcellation of whole-brain tractography led to the SC matrix containing the normalized number of streamlines as edges and cortical/subcortical labels as nodes. The time-course of BOLD signals was extracted for each node and the FC matrix was computed for each subject correlating time-courses between nodes with a Fisher-z transformed coefficient thresholded at 0.12064.
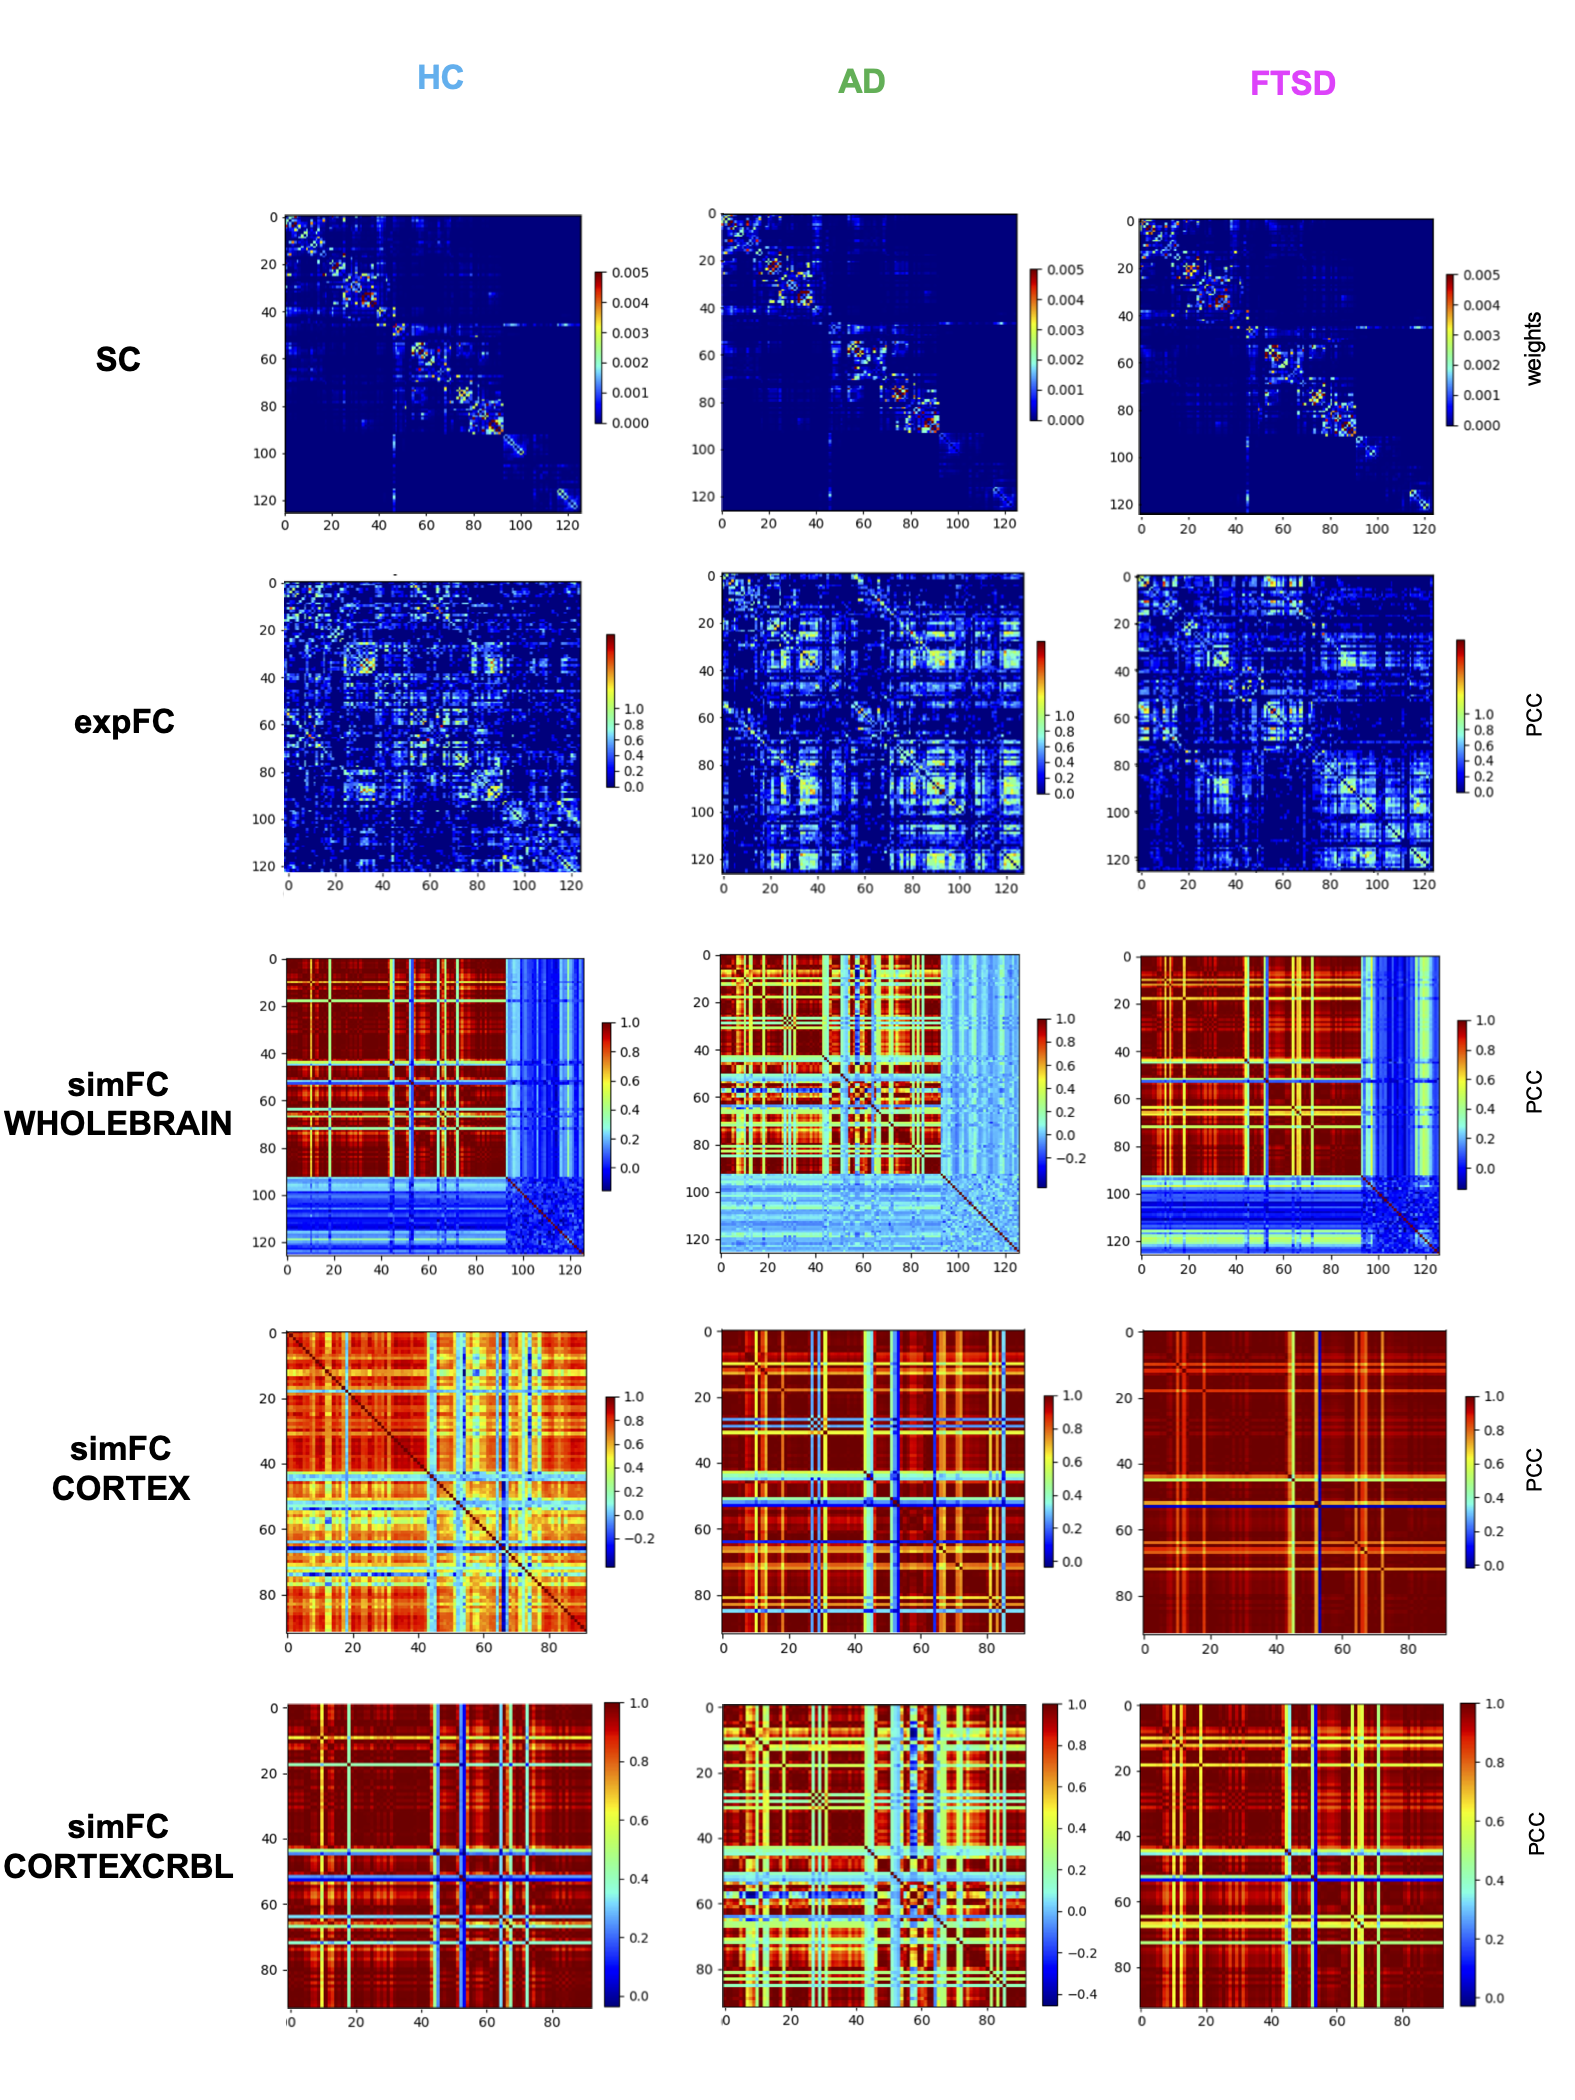
TVB simulation: For each subject, the SC matrix was incorporated in the TVB analysis to obtain subject-specific simulated global dynamics. A reduced Wong-Wang model11 was chosen to simulate the activity of each node. An iterative optimization of the global coupling (Gcoupl) value was performed. This value is a scaling factor for the anatomical weights and different values of Gcoupl significantly affect the correlation between the experimental FC (expFC) and the simulated FC (simFC). Gcoupl was tuned until the maximum correlation between expFC and simFC was obtained. Then, brain dynamics were simulated for a period of 6 minutes and the Pearson correlation coefficient (PCC) between simFC and expFC was calculated. To investigate the impact of the cerebellum on brain dynamics, simulations were performed in three networks: whole-brain (with whole-brain SC), cortical subnetwork (only cerebral SC), embedded cerebro-cerebellar subnetwork (evaluating simFC for cerebral nodes taking into account the influence of cerebellar subnetwork) (Fig.1).
Statistics: All PCC were normally distributed (Shapiro-Wilk test) and general linear model (GLM) (multivariate and Bonferroni corrected for repeated measures) with age and gender as covariates was performed to assess significant differences between groups (HC, AD, FTSD) and networks (SPSS v21).
Results
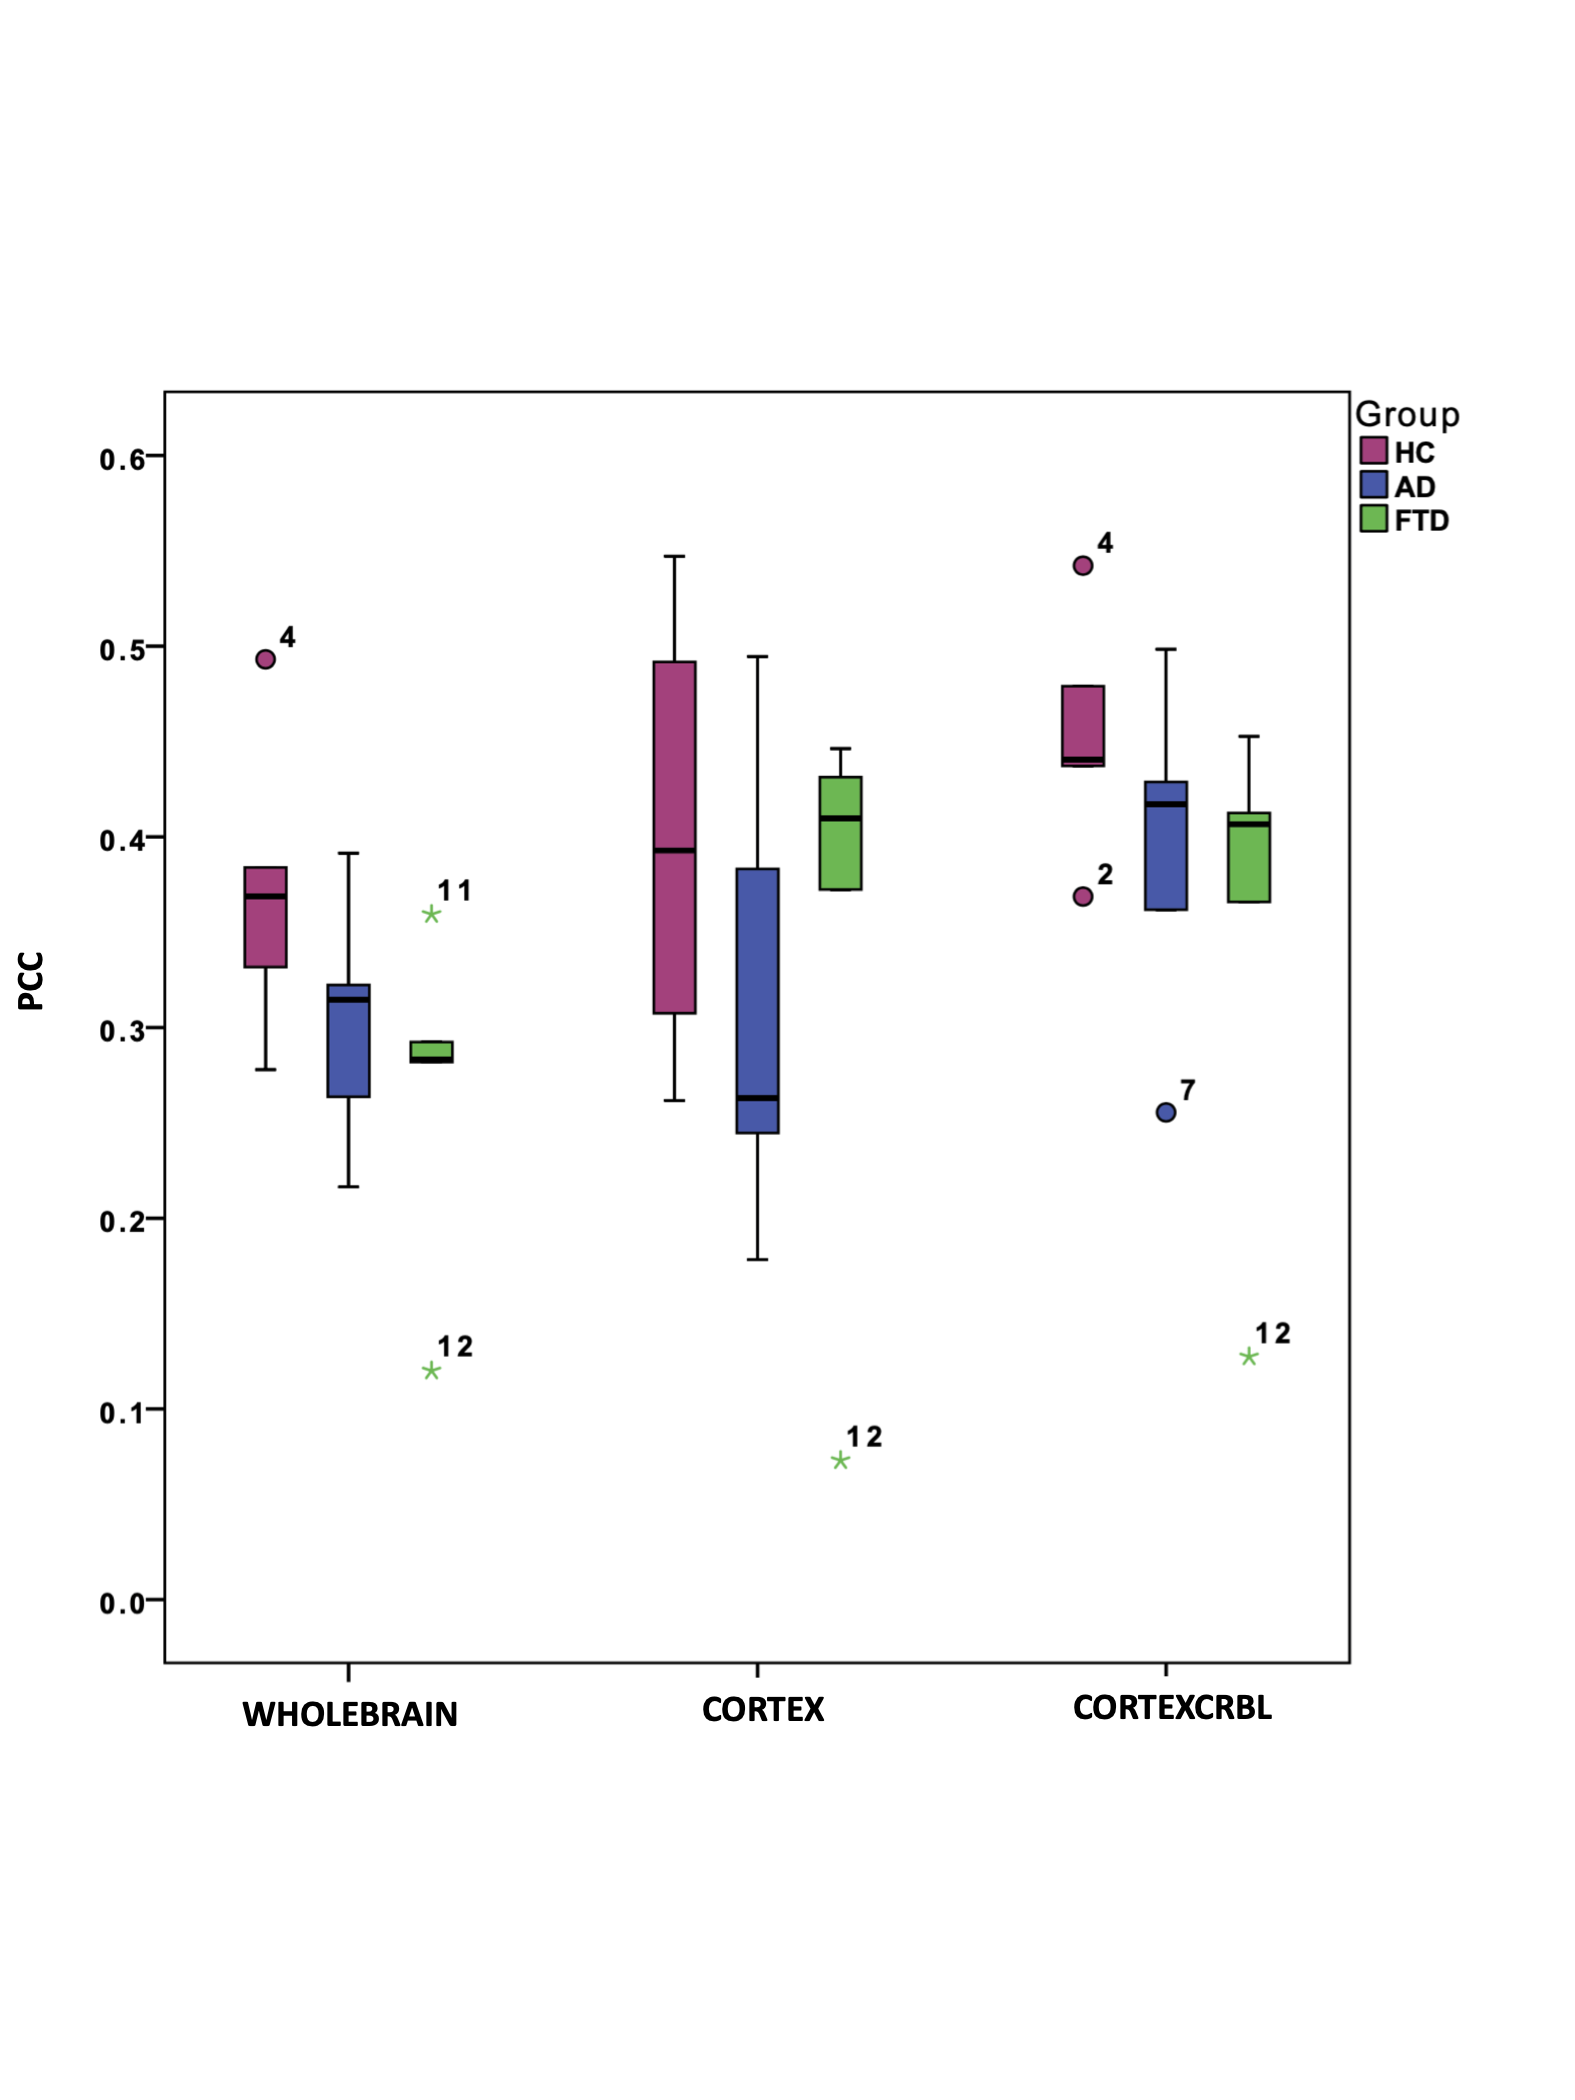
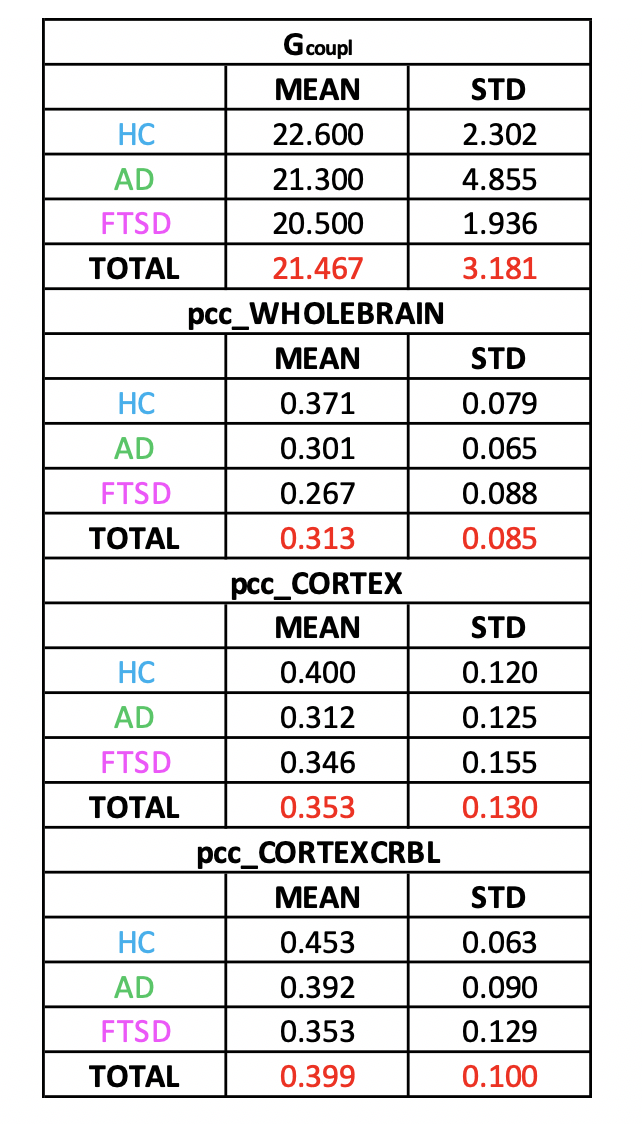
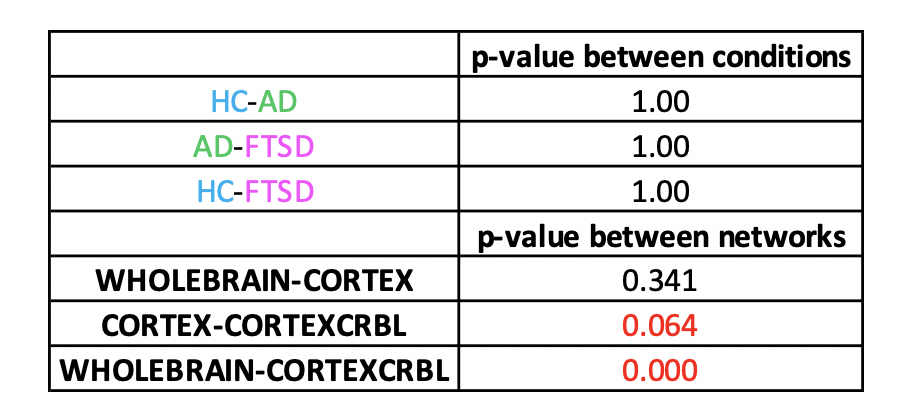
Gcoupl and PCC values found for each group using different networks are reported in Table1. According to multivariate GLM, no statistical differences were found comparing all parameters between groups (Table2). However, the GLM with repeated measures demonstrated that PCC calculated when embedding the cerebro-cerebellar subnetwork was higher than PCC obtained with the other two networks (Fig.2, Table2). In particular, this difference was significant between embedded cerebro-cerebellar subnetwork and whole-brain network and close to significant between embedded cerebro-cerebellar and cortical subnetwork.Discussion
In this work we demonstrated that the inclusion of cerebro-cerebellar connections in TVB leads to an increase of the correlation between expFC and simFC, not only in healthy conditions but also in dementia, both AD and FTSD. This opens new insights in how best to use TVB to characterize brain dynamics in pathological subjects. Further analysis will aim to:· evaluate the relationship between local model parameters, related to excitatory and inhibitory neuronal populations and clinical phenotypes;
· investigate the impact of the integration of a specific mean-field model reflecting cerebellar microcircuit physiology on TVB predictive capability;
· explore pathological mechanisms by simulating the activity of subnetworks that are typically known to be impaired in AD or FTSD.
Eventually these TVB simulations should help to integrate structural and functional properties in neurodegenerative states causing dementia and to uncover the specific involvement of cerebro-cerebellar loops and other subcircuits in these pathologies.
Acknowledgements
This work was performed at the IRCCS Mondino Foundation and was supported by the Italian Ministry of Health (RC2020). This research received funding by H2020 Research and Innovation Action Grants Human Brain Project 785907 and 945539 (SGA2 and SGA3) and by the MNL Project “Local Neuronal Microcircuits” of the Centro Fermi (Rome, Italy) to ED and FP. CGWK received funding from the UK MS Society (#77), Wings for Life (#169111), Horizon2020 (CDS-QUAMRI, #634541), BRC (#BRC704/CAP/CGW).References
1. Sanz Leon, P., S. A. Knock, M. M. Woodman, L. Domide, J. Mersmann, A. R. McIntosh & V. Jirsa (2013) The Virtual Brain: a simulator of primate brain network dynamics. Front Neuroinform, 7, 10.
2. Sanz-Leon, P., S. A. Knock, A. Spiegler & V. K. Jirsa (2015) Mathematical framework for large-scale brain network modeling in The Virtual Brain. Neuroimage, 111, 385-430.
3. Zimmermann, J., A. Perry, M. Breakspear, M. Schirner, P. Sachdev, W. Wen, N. A. Kochan, M. Mapstone, P. Ritter, A. R. McIntosh & A. Solodkin (2018) Differentiation of Alzheimer's disease based on local and global parameters in personalized Virtual Brain models. Neuroimage Clin, 19, 240-251.
4. Palesi, F., R. M. Lorenzi, C. Casellato, P. Ritter, V. Jirsa, C. A. M. Gandini Wheeler-Kingshott & E. D'Angelo (2020) The Importance of Cerebellar Connectivity on Simulated Brain Dynamics. Front Cell Neurosci, 14, 240.
5. Castellazzi, G., F. Palesi, S. Casali, P. Vitali, E. Sinforiani, C. A. Wheeler-Kingshott & E. D'Angelo (2014) A comprehensive assessment of resting state networks: bidirectional modification of functional integrity in cerebro-cerebellar networks in dementia. Front Neurosci, 8, 223.
6. Pizzarotti, B., F. Palesi., P. Vitali, G. Castellazzi, N. Anzalone, E. Alvisi, D. Martinelli, S. Bernini, M. Cotta Ramusino.,M. Ceroni, G. Micieli, E. Sinforiani, E. D’Angelo, A. Costa & C. Gandini Wheeler-Kingshott (2020). Frontal and Cerebellar Atrophy Supports FTSD-ALS Clinical Continuum. Frontiers in Aging Neuroscience, 12, 593526.
7. https://fsl.fmrib.ox.ac.uk/fsl/fslwiki
8. http://www.mrtrix.org/
9. Yan, C. G., X. D. Wang, X. N. Zuo & Y. F. Zang (2016) DPABI: Data Processing & Analysis for (Resting-State) Brain Imaging. Neuroinformatics, 14, 339-51.
10. Diedrichsen, J., J. H. Balsters, J. Flavell, E. Cussans & N. Ramnani (2009) A probabilistic MR atlas of the human cerebellum. Neuroimage, 46, 39-46.
11. Wong, K. F. & X. J. Wang (2006) A recurrent network mechanism of time integration in perceptual decisions. J Neurosci, 26, 1314-28.
Figures