2864
Impact of ASL modelling strategies on cerebral blood flow and reactivity assessment
Joana Pinto1, Nicholas P. Blockley2, James W. Harkin3, and Daniel P. Bulte1
1Institute of Biomedical Engineering, Department of Engineering Science, University of Oxford, Oxford, United Kingdom, 2School of Life Sciences, University of Nottingham, Nottingham, United Kingdom, 3Respiratory Medicine Department, School of Medicine, University of Nottingham, Nottingham, United Kingdom
1Institute of Biomedical Engineering, Department of Engineering Science, University of Oxford, Oxford, United Kingdom, 2School of Life Sciences, University of Nottingham, Nottingham, United Kingdom, 3Respiratory Medicine Department, School of Medicine, University of Nottingham, Nottingham, United Kingdom
Synopsis
Despite most ASL cerebrovascular reactivity (CVR) studies being based on single-PLD approaches, it has been shown that the vascular spatiotemporal dynamics of cerebral blood flow (CBF) are altered during hypercapnia. This ultimately leads to inaccuracies in some ASL modelling assumptions, compromising CVR assessment. In this work, we test several multiple-PLD ASL modelling strategies and assess their impact on CBF dynamics and CVR assessment. In particular, the individual and combined impact of estimating dispersion effects and the macrovascular signal are evaluated in terms of quantification of several haemodynamic parameters using multiple-PLD ASL data during two different conditions (resting-state and hypercapnia).
Introduction
Cerebrovascular reactivity (CVR) can be defined as the intrinsic mechanism of cerebral blood vessels to adjust their calibre and cerebral blood flow (CBF) in response to vasoactive stimuli. CVR has been shown to be impaired in several pathologies, possibly providing sensitive disease biomarkers. Most CVR studies based on ASL use single-PLD approaches. However, it is known that, during hypercapnia, the vascular spatiotemporal dynamics of CBF are altered, making some assumptions of ASL modelling invalid, possibly compromising CVR assessment. Although some recent studies have investigated the impact of modelling strategies on ASL-based CBF quantification during resting-state1,2 and hypercapnia1, we expand on those findings by testing additional modelling strategies and assessing their impact on CBF and CVR quantification during both conditions.Methods
10 healthy subjects (5M, 20.4 ± 0.8 years old) were studied on a 3T Siemens Prisma Scanner with a 32 channel receive only head coil. MR scanning included a multi-PLD pCASL sequence (2D multi-slice GE-EPI, background suppressed, resolution 3.5 × 3.5 × 4.5 mm3, TR/TE = 4100/14 ms, bolus duration 1400 ms, 6 PLDs 250, 500, 750, 1000, 1250, and 1500 ms, 8 averages for each PLD, slice timing = 46 ms), acquired during two conditions (6 min 40 s, each): air (normocapnia) and hypercapnia (RespirAct Gen 3, Thornhill Medical, target PETCO2 = 10 mmHg above subject's measured baseline). For registration and tissue segmentation purposes, a high-resolution structural image was also collected (MPRAGE, spatial resolution = 1 mm isotropic, TR/TE = 1900/3.74 ms). All data were analysed using FSL3 and MATLAB. ASL data pre-processing steps included extraction of first volume (M0t), motion correction and distortion correction using a field map. A standard kinetic model was fitted to the data using BASIL3 (T1a=1.65s, T1t=1.3s), estimating CBF and bolus arrival time (BAT). The impact of adding dispersion effects (gamma-shaped dispersion kernel4, Mdisp) and/or intravascular arterial component was also studied (extended kinetic model5, Mart). The resulting CBF and arterial bolus volume (aBV) maps were then calibrated (voxelwise long TR M0t approach6, labelling efficiency = 0.85) and CVR was computed as:$$CBF( \% /mmHg) = 100 \times \frac{\frac{CBF_{hypercapnia}-CBF_{air}}{CBF_{air}}}{PETCO2_{hypercapnia}-PETCO2_{air}}$$
After co-registration to structural space (BBR3 and FNIRT3), mean CBF, BAT, aCBV and CVR values were computed for the following regions: gray matter (GM, segmented using FAST3), frontal, parietal, temporal and occipital (MNI atlas intersected with GM). To evaluate differences between parameters across models and conditions, repeated-measures 3-way-ANOVAs and post-hoc analyses were performed (p<0.05, Greenhouse-Geisser correction for unequal variance (if applicable), Bonferroni correction for multiple comparisons). Models and conditions were also compared using the negative free energy (FE) of the model fit in each voxel.
Results and Discussion
Figure 1 shows representations of CBF, BAT, and aCBV maps derived from the different modelling strategies and conditions tested, for one illustrative subject. Figure 2 provides the regional analysis of the maps averaged across all subjects. The hypercapnic condition led to higher CBF and lower BAT across the brain (Figure 1 and 2). For the different models, the effects observed were similar between conditions. Incorporating a gamma dispersion model leads to a significant decrease in CBF and BAT values across all regions (Figure 2). The lowest CBF values in all regions and for both conditions were obtained when combining the macrovascular component and dispersion into the modelling (MartMdisp), while the lowest BAT values in GM were obtained when including dispersion but without the macrovascular component modelling (MnoartMdisp). Although not significant regionally, the aCBV maps obtained with gamma dispersion modelling show a global signal increase and the voxels more distally located in the vascular tree display higher intensities (Figures 1 and 2). The mean negative FE for all regions was significantly increased when including the macrovascular component and a gamma dispersion kernel (MartMdisp), which implies a better model fit when including these components (Figure 3). Most CVR values were not affected by the modelling strategy, except for GM with the inclusion of gamma dispersion and macrovascular components (MartMdisp), which led to significantly higher CVR values (Figure 4).Conclusion
Our results demonstrate that the choice of modelling strategy significantly impacts CBF dynamics quantification, regardless of the condition used. In particular, including a gamma distribution dispersion kernel in a two-component model (macrovascular component), seems to improve the multi-PLD ASL model fitting, possibly providing more accurate estimates of CBF parameters. The differences in BAT across the brain, for both conditions, also highlight the need of acquiring multiple-PLD ASL strategies for the accurate quantification of CBF. Further work is still required in order to validate these results and to fully understand the impact of the different conditions and modelling strategies. In the future, we plan to incorporate other dispersion kernels and to perform a comparison between CVR measurements derived from ASL and more commonly used methods (e.g. BOLD fMRI, TDU).Acknowledgements
This work was funded by EPSRC grants EP/G004277/1, EP/K025716/1 and EP/S021507/1References
- Donahue, M. J., et al. (2016). Time delay processing of hypercapnic fMRI allows quantitative parameterization of cerebrovascular reactivity and blood flow delays. J. Cereb. Blood Flow Metab. 36, 1767–1779.
- van der Plas, Merlijn C.E., et al. (2019). Combined estimation of dispersion and macrovascular signal in multi-PLD pCASL data using a two-component model. Proc. Intl. Soc. Mag. Reson. Med. 27 (2019)
- FSL (https://fsl.fmrib.ox.ac.uk/fsl/fslwiki/)
- Chappell, M. A., et al. (2013). Modeling dispersion in arterial spin labeling: validation using dynamic angiographic measurements. Magn. Reson. Med. 69, 563–70.
- Chappell, M. A., et al. (2010). Separation of macrovascular signal in multi-inversion time arterial spin labelling MRI. Magn. Reson. Med. 63, 1357–65.
- Pinto, J., et al. (2020). Calibration of arterial spin labeling data—potential pitfalls in post‐processing. Magn. Reson. Med. 83, 1222–1234. doi:10.1002/mrm.28000.
Figures
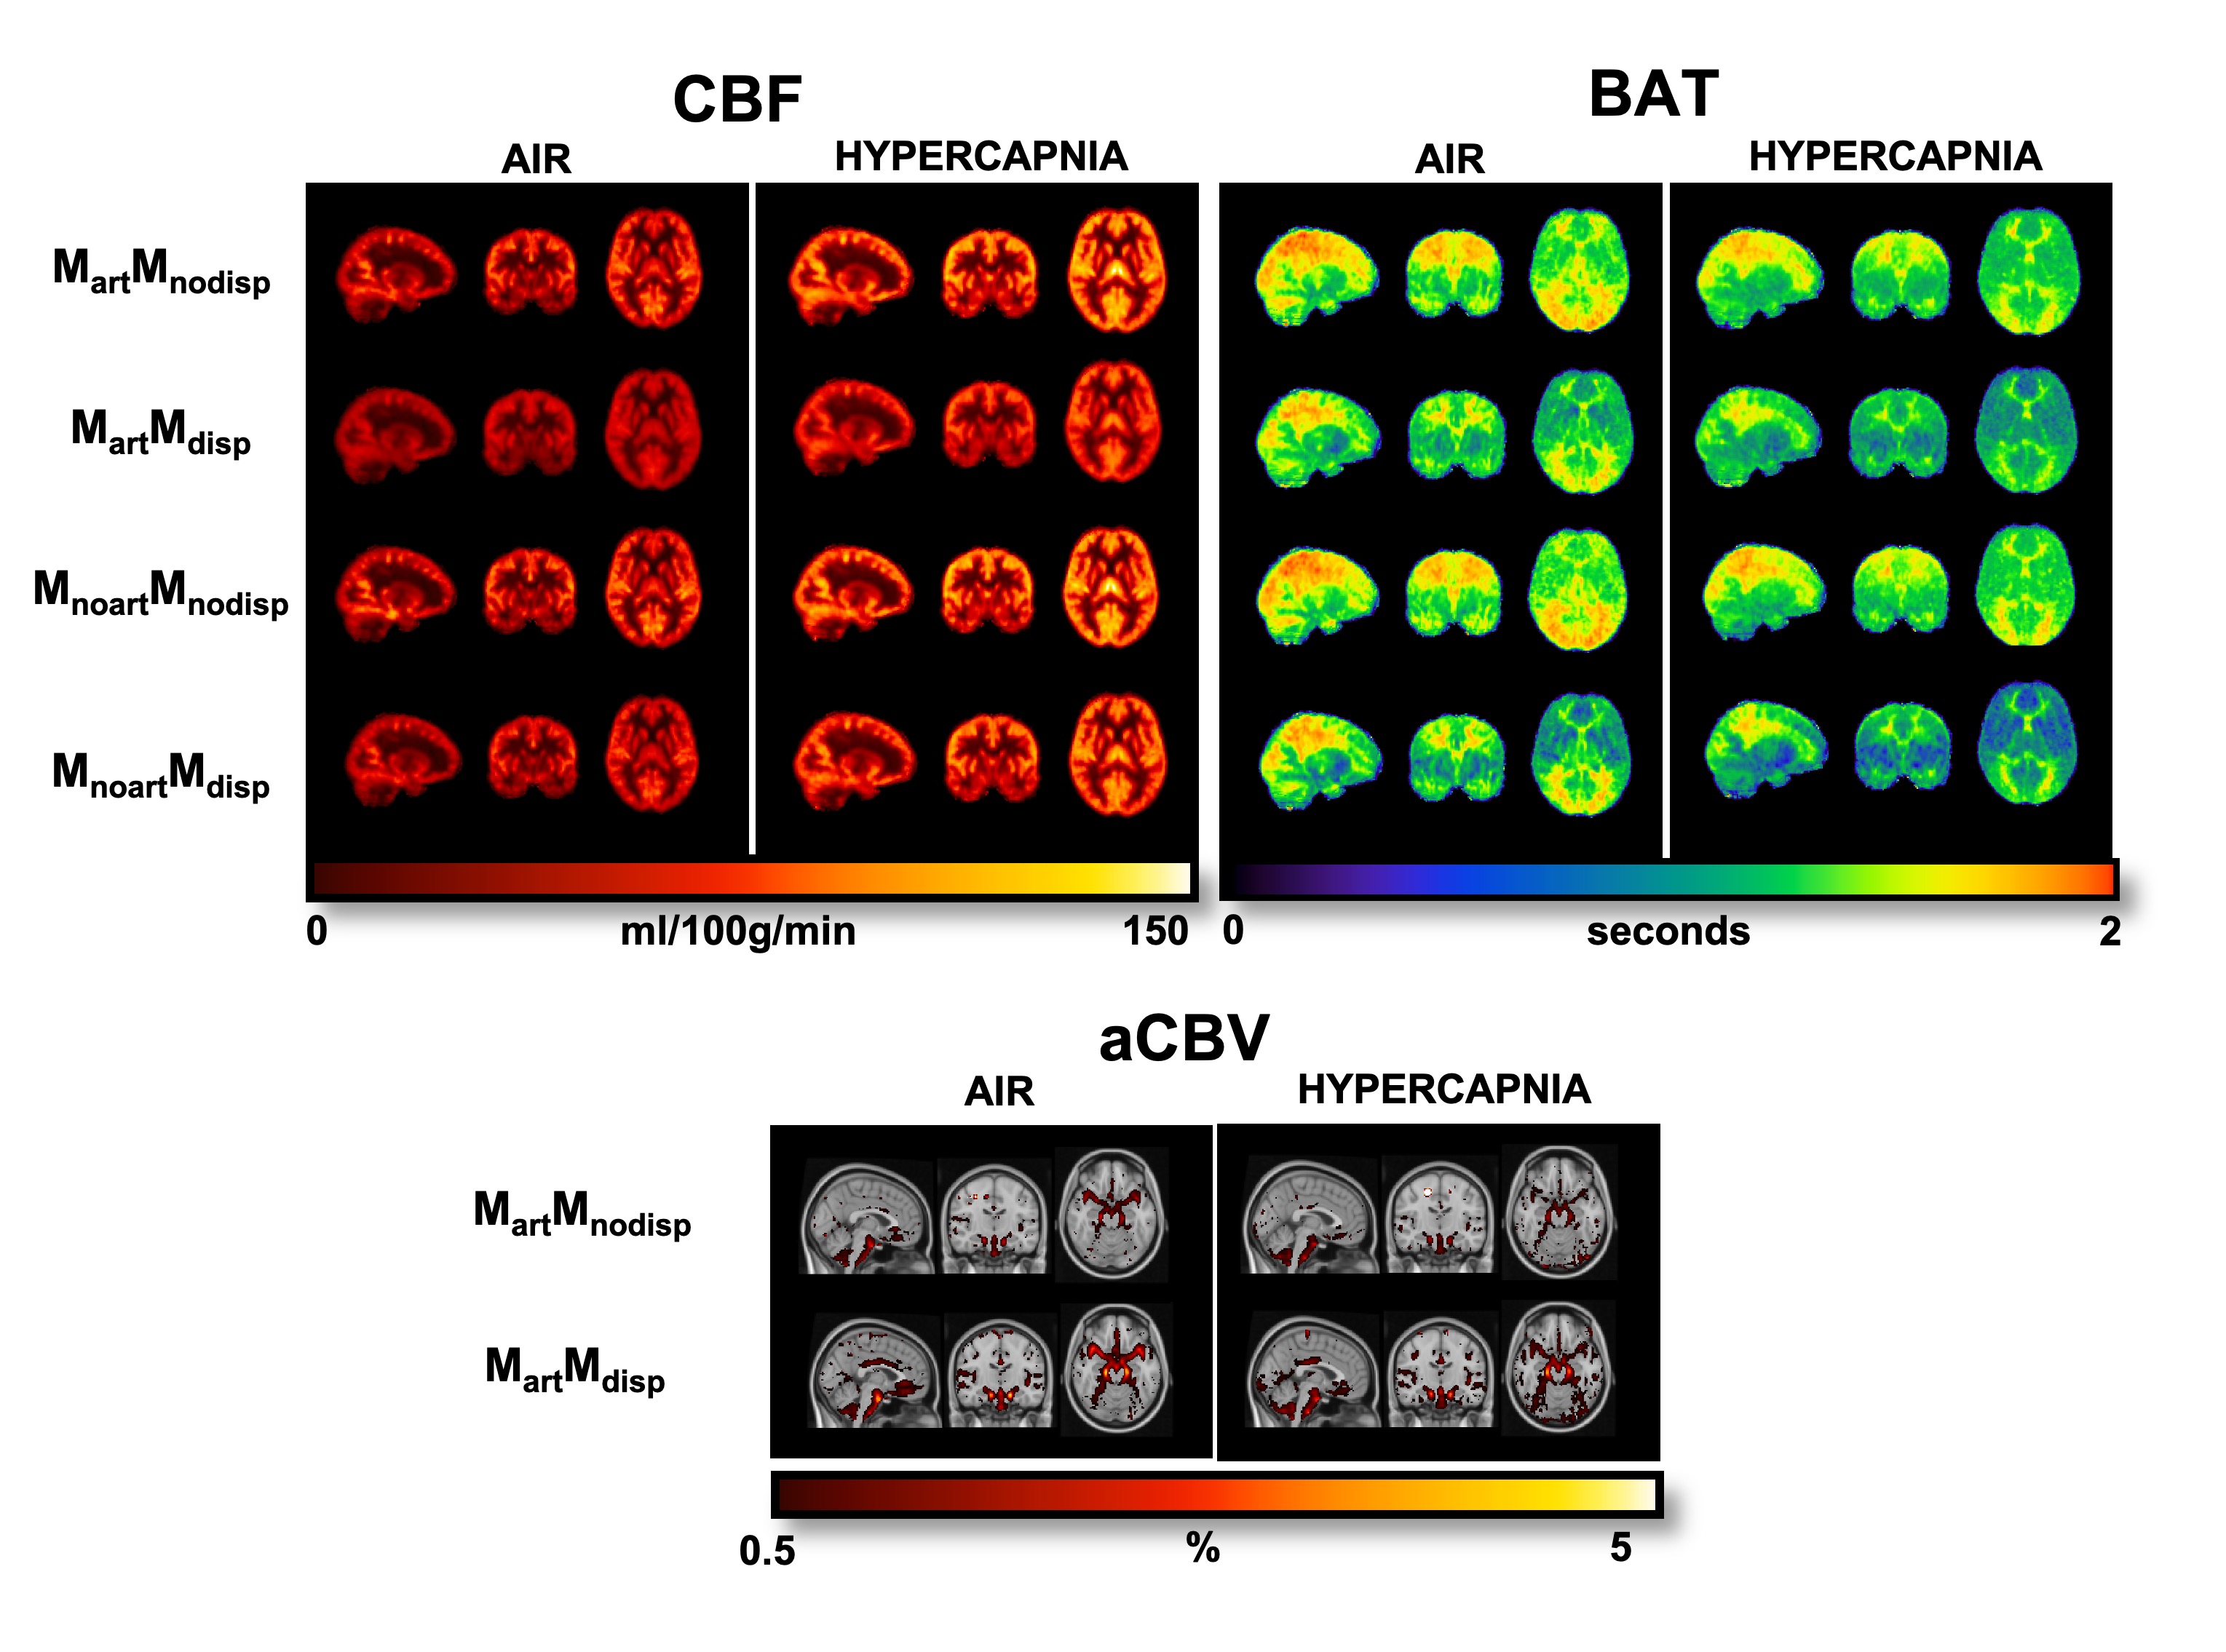
Figure 1. Orthogonal representations of CBF, BAT, and aCBV maps of one subject for the different modelling strategies and conditions (air and hypercapnia). aCBV maps are only obtained when using strategies where the macrovascular component is modelled (Mart). MartMnodisp - model with macrovascular component but without dispersion, MartMdisp - model with macrovascular and dispersion components, MnoartMnodisp - model without macrovascular and dispersion components, MnoartMdisp - model with dispersion but without macrovascular component.
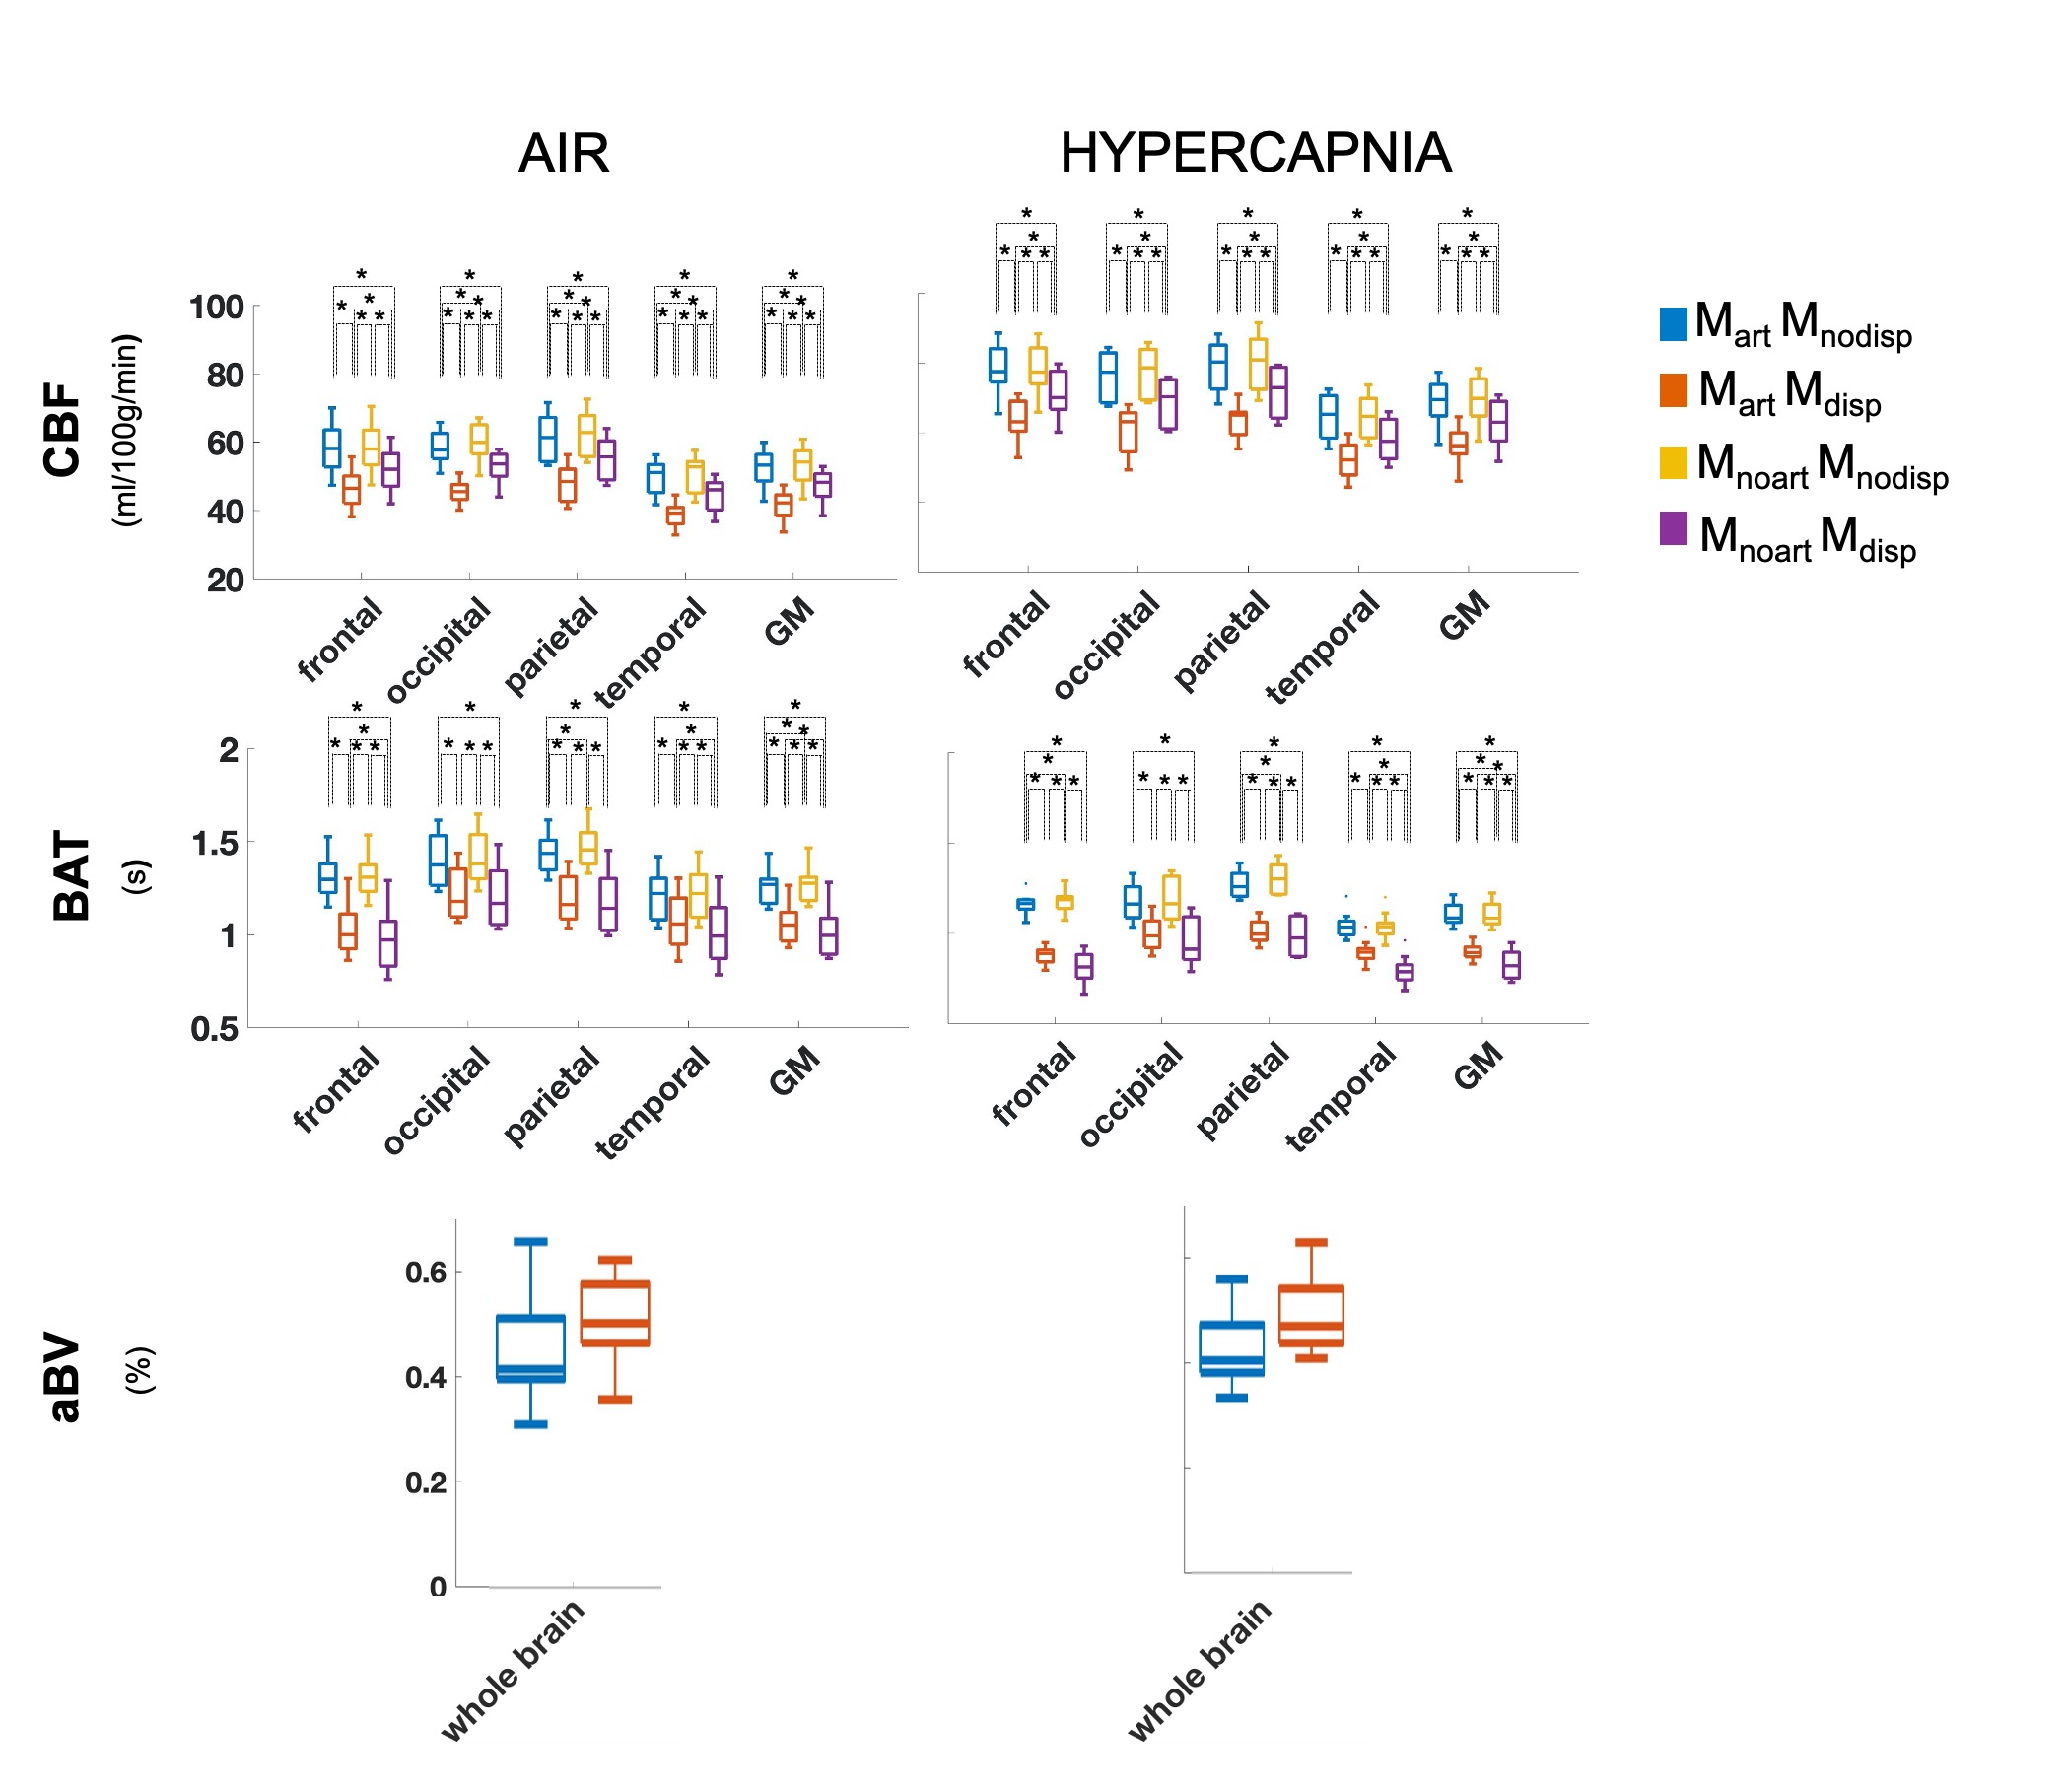
Figure 2. Regional analysis of the different haemodynamic parameters (CBF, BAT and aBV; rows) with the different modelling strategies (colors, correspondence detailed in Figure 1 legend) and conditions (columns). Statistically significant results are highlighted with * (p>0.05, corrected for multiple comparisons).
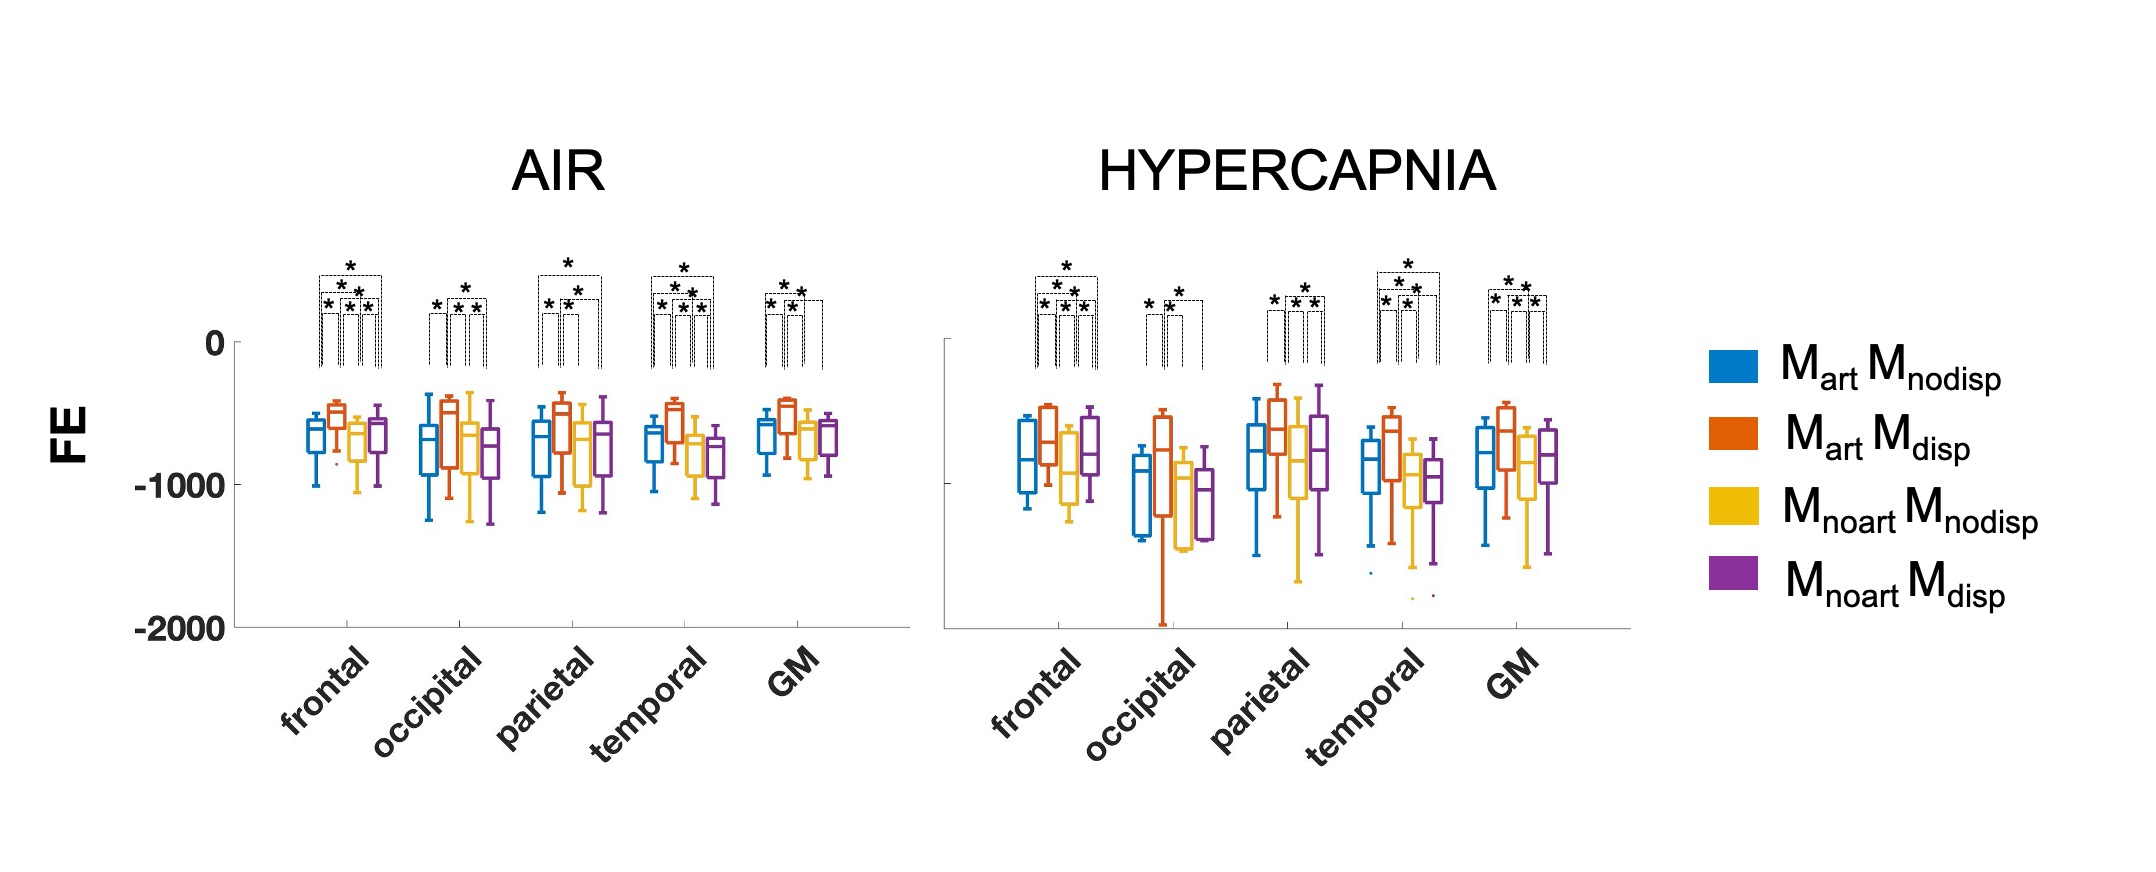
Figure 3. Regional negative free energy (FE) across the modeling strategies and conditions tested. Higher values (less negative) correspond to a better model fit. Statistically significant results are highlighted with * (p>0.05, corrected for multiple comparisons).
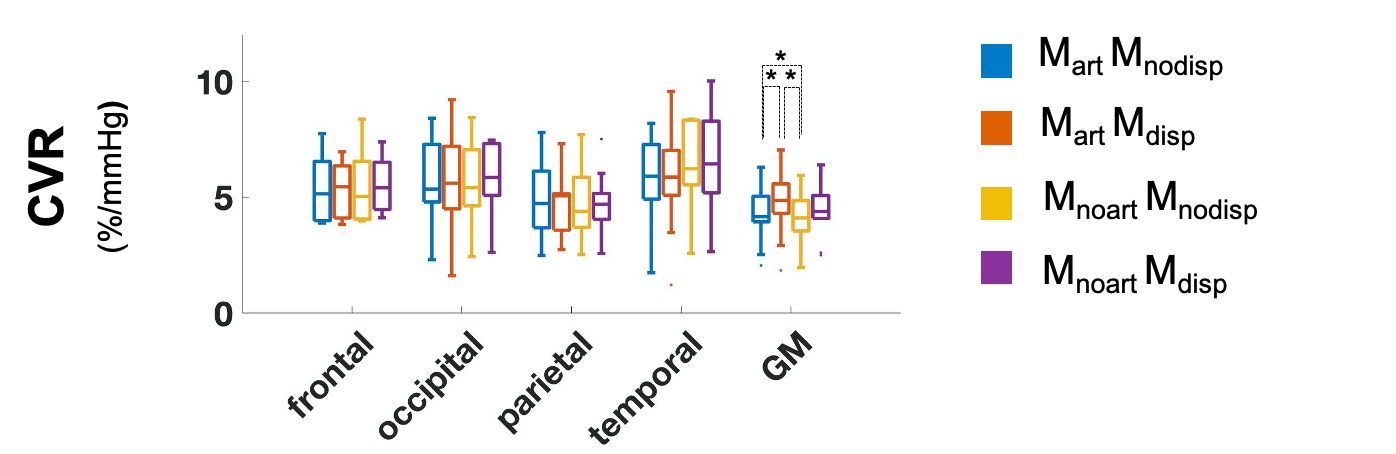
Figure 4. Regional CVR (%/mmHg) across all modeling strategies tested (different colors, correspondence detailed in Figure 1 legend). Statistically significant results are highlighted with * (p>0.05, corrected for multiple comparisons).