2858
Modelling Depth-Dependent VASO and BOLD Signal Changes in Human Primary Motor Cortex1Centre for Advanced Imaging, The University of Queensland, Brisbane, Australia, 2School of Information Technology and Electrical Engineering, Brisbane, Australia, 3ARC Training Centre for Innovation in Biomedical Imaging Technology, Brisbane, Australia
Synopsis
Depth-dependent high resolution fMRI studies in animals and humans hold promise to reveal the input-output and feedforward-feedback connections across cortical layers. However, our understanding of the underling physiology is limited. In this work, using a cortical vascular model we simulated BOLD and VASO signal changes in human primary motor cortex.
Introduction
Measuring depth-dependent fMRI signal changes can provide insights into cortical information processing and microcircuits of the human brain [1]. However, the interpretation of these signals remains challenging, as most fMRI contrasts measure a hemodynamic response following neural activity [2], which is a function of the underlying vasculature [3]. Thus, to better understand local (arterioles, capillaries, and venules) and global (intracortical arteries and veins (ICAs and ICV)) vascular signal contributions to measured fMRI signal changes, we have adapted the ‘cortical vascular model’ [4] to simulate not only gradient-echo blood-oxygenation-level-dependent (BOLD) signal changes, but also the vascular-space-occupancy (VASO) contrast, which has been shown to be more spatially specific [5, 6]. Further, we added intra-cortical arteries, which are known to dilate upon activation [7] and contribute to cerebral blood volume (CBV) changes measured using VASO. As the model was previously designed for the primary visual cortex (V1), we have extended it to simulate the functional responses in the human primary motor cortex (M1) by considering its unique vascular features, such as layer boundaries, thickness, and baseline blood volume. To verify the ability of this model to simulate the experimental data, and to obtain an estimate of CBV change across layers, VASO and BOLD responses from Huber et al., [8] for four different tasks were simulated in this work.Methods
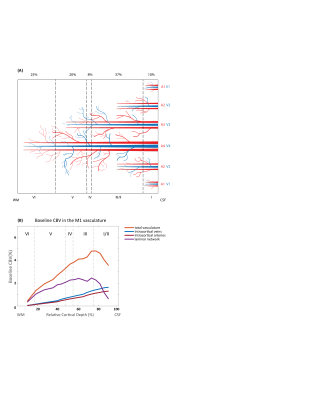
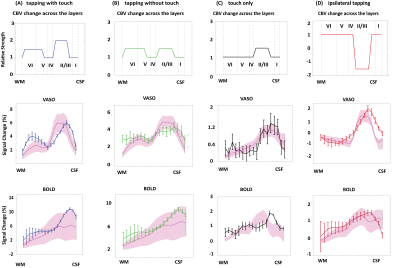
Figure 1A shows a schematic of the modelled region centered on two principal veins (V4 and V3) surrounded by an arterial ring with an artery to vein ratio of 2 [9]. The baseline blood volume in the laminar network comprising arterioles, capillaries, and venules was estimated from Duvernoy et al. [10]. The diameters of ICVs and ICAs diameter were then calculated in each depth following Markuerkiaga et al. [4] and the baseline CBV in each compartment is shown in Figure 1B. BOLD [11] and VASO [12] signal models were used to simulate the intra- and extra-vascular BOLD and the extra-vascular VASO signal.VASO simulation: We simulated a wide range of possible profiles from the model by varying ΔCBV between 0-150% for each compartment. Note that across depths, each ΔCBV value was modulated by the relative profiles (Figure 2A-D) adapted from Huber et al., representing expected modulation of the input and output activity. All profiles were then compared to the experimental profiles from Huber et al. [8] (Figure 2A-D) by calculating the root-mean-squared-error (RMSE).
BOLD simulation: To simulate the BOLD response, we used the ΔCBV from the VASO simulation with the lowest RMSE and allowed the oxygen saturation values to vary at baseline (60-75%) and at activation (70-90%). Similar to the VASO simulations, the simulated profile with the minimum RMSE was considered as the best fit to our measured BOLD profile. For simplicity, the oxygen saturation in arterioles/ICAs and capillaries were assumed to be 95% and 85% at baseline, 100% and 95% during activation [13].
Result and Discussion
The diameters of the intracortical vessels estimated from the baseline CBV are shown in Table 1 and agree with Duvernoy et al. [10].The simulated BOLD and VASO profiles along with the corresponding relative CBV change across depths are depicted in Figure 2 for the four tasks: 1) tapping with touch, 2) tapping without touch, 3) touch only, and 4) ipsilateral tapping. To examine the model sensitivity to and oxygenation change, profiles with RMSE 20% higher than the minimum RMSE are plotted as the shaded area in Figure 2. The estimated ΔCBV and oxygenation changes with the minimum RMSE are shown in Table 2. Overall, the simulated VASO profiles resembled the measured data much more closely than the BOLD profiles, although, a slight misalignment in the peak location especially in superficial layers remains. Due to the strong dominance of intracortical veins in the modelled BOLD signal, the simulated profiles cannot accommodate the distinct peak and high signal changes present in the superficial layers of the measured BOLD data in the tapping with and without touch conditions. Similarly, the estimated large ΔCBV in the venules for these conditions (Table 2) appear unlikely [7, 14], in particular as one would expect a similar neurovascular coupling in M1 in all conditions. This illustrates the current limitations of this model, i.e. the lack of detailed information on baseline CBV, vessel density, blood velocity, and vessel diameter across different regions of the human brain. To address this issue, comprehensive ex-vivo studies on cortical vasculature spanning all components of the vascular network are needed.Acknowledgements
We thank Laurentius (Renzo) Huber for providing the data for our simulations. We acknowledge Irati Markuerkiaga and David Norris to provide us with the cortical vascular model used in our simulations. SB and MB acknowledge funding from the NHMRC- NIH BRAIN Initiative Collaborative Research Grant APP1117020, NIH grant 1R01MH111419. AA acknowledges support through the Australian Government Research Training Program Scholarship.
References
1. Lawrence, S.J., D.G. Norris, and F.P.J.E. De Lange, Dissociable laminar profiles of concurrent bottom-up and top-down modulation in the human visual cortex. 2019. 8: p. e44422.
2. Iadecola, C.J.N., The neurovascular unit coming of age: a journey through neurovascular coupling in health and disease. 2017. 96(1): p. 17-42.
3. Logothetis, N.K., What we can do and what we cannot do with fMRI. Nature, 2008. 453(7197): p. 869. 4. Markuerkiaga, I., M. Barth, and D.G. Norris, A cortical vascular model for examining the specificity of the laminar BOLD signal. Neuroimage, 2016. 132: p. 491-498.
5. Lu, H., et al., Functional magnetic resonance imaging based on changes in vascular space occupancy. Magnetic Resonance in Medicine, 2003. 50(2): p. 263-274.
6. Huber, L., et al., Cortical lamina-dependent blood volume changes in human brain at 7 T. Neuroimage, 2015. 107: p. 23-33.
7. Vanzetta, I., R. Hildesheim, and A.J.J.o.N. Grinvald, Compartment-resolved imaging of activity-dependent dynamics of cortical blood volume and oximetry. 2005. 25(9): p. 2233-2244.
8. Huber, L., et al., High-resolution CBV-fMRI allows mapping of laminar activity and connectivity of cortical input and output in human M1. Neuron, 2017. 96(6): p. 1253-1263. e7.
9. Francis, C., et al., Scaling laws for branching vessels of human cerebral cortex. 2009. 16(4): p. 331-344.
10. Duvernoy, H.M., S. Delon, and J.J.B.r.b. Vannson, Cortical blood vessels of the human brain. 1981. 7(5): p. 519-579.
11. Uludağ, K., B. Müller-Bierl, and K.J.N. Uğurbil, An integrative model for neuronal activity-induced signal changes for gradient and spin echo functional imaging. 2009. 48(1): p. 150-165.
12. Huber, L., et al., Slab‐selective, BOLD‐corrected VASO at 7 Tesla provides measures of cerebral blood volume reactivity with high signal‐to‐noise ratio. Magnetic resonance in medicine, 2014. 72(1): p. 137-148.
13. Vovenko, E.J.P.A., Distribution of oxygen tension on the surface of arterioles, capillaries and venules of brain cortex and in tissue in normoxia: an experimental study on rats. 1999. 437(4): p. 617-623.
14. Jin, T. and S.-G. Kim, Improved cortical-layer specificity of vascular space occupancy fMRI with slab inversion relative to spin-echo BOLD at 9.4 T. Neuroimage, 2008. 40(1): p. 59-67.
Figures

