2857
Established a rat model of discogenic low back pain for evaluating the paravertebral muscle functional magnetic resonance changes1The First Affiliated Hospital of Kunming Medical University, kunming, China, 2GE Healthcare, MR Research China, Beijing, Beijing, China
Synopsis
In this study, a discogenic low back pain (DLBP) model was established by puncture of rat intervertebral disc under the guidance of X-ray, and functional magnetic resonance imaging (fMRI) was performed on paravertebral muscles of DLBP rats to explore the feasibility of the DLBP model and the changes of T2 value and R2*value of paravertebral muscles in the early stage of DLBP. The conclusion is that it is feasible to construct DLBP rat model by X-ray guided puncture of intervertebral disc, and the T2 value changes earlier than R2*in the early stage of DLBP.
Introduction
Low Back Pain (LBP) is one of the main clinical and social health burdens in the world, about 39% of LBP patients are caused by disc lesions1. Paravertebral muscle is the main stable structure of the spine2, and paravertebral muscle dysfunction is crucial to the promotion and development of DLBP. Therefore, the construction of appropriate animal models is conducive to explore the pathological changes of paravertebral muscles in the process of DLBP, but the previous establishment of rat DLBP model destroyed the abdomen and paravertebral muscles or lumbar facet joints3, making it difficult to evaluate the paravertebral muscles of DLBP. In this study, we used X-ray guided puncture disc technology to avoid the injury of paravertebral muscle, so as to build rat DLBP model, and to explore the changes of T2 and R2*values of paravertebral muscle in the early stage of DLBP.Material and Methods
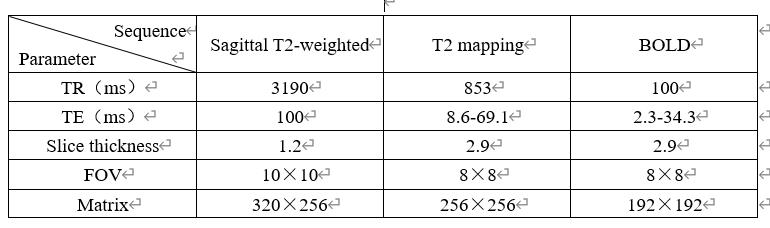
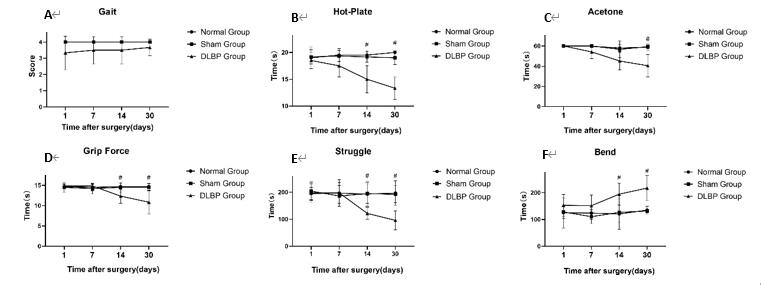
Study design:1.Eighteen healthy female SD rats were randomly divided into three groups: normal group, sham operation group (sham group) and DLBP group, with six rats in each group. 2. DLBP group: X-ray guided puncture of L4/5 and L5/6 intervertebral discs in rats, and injection of Phosphate Buffered Saline (PBS); Sham group: only puncture L4/5 and L5/6 levels of paravertebral muscle; Normal group doesn't do anything. 3.After 1,7,14,30 days operation. Behavioral assay: Gait assay to assess the severity of gait disturbance in rats; Hot plate and acetone assays to evaluate the response threshold of rats to pain and temperature sensation; Grip force and tail suspension assay to evaluate the behavior characteristics of axial LBP. 4. After one-month operation. MRI T2 weighted sagittal scanning was performed to observe the signal change of intervertebral disc. The changes of paravertebral muscles in early stage of DLBP were evaluated by T2 mapping and BOLD. 5. Histological staining (hematoxylin-eosin) was used to observe disc degeneration. 6.All subjects underwent MR scanning after one-month operation on a 3.0 T MRI scanner (Discovery MR 750W, GE Healthcare, Waukesha, USA) using 16 channel rat coil.Magnetic resonance scanning parameters are shown in the following (Figure.1).
Statistical methods: All statistical analysis and graphs were constructed with Prism 8.0 (GraphPad,San Diego,CA). The data that fit a normal distribution were analyzed by repeated measurement analysis of variance (ANOVA) and Fisher PLSD as a post-hoc test. while those that did not meet the normal distribution were analyzed with a nonparametric Mann-Whitney test. P <0.05 was considered statistically significant.
Results
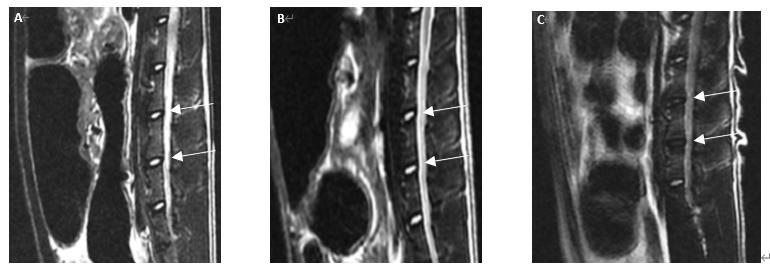
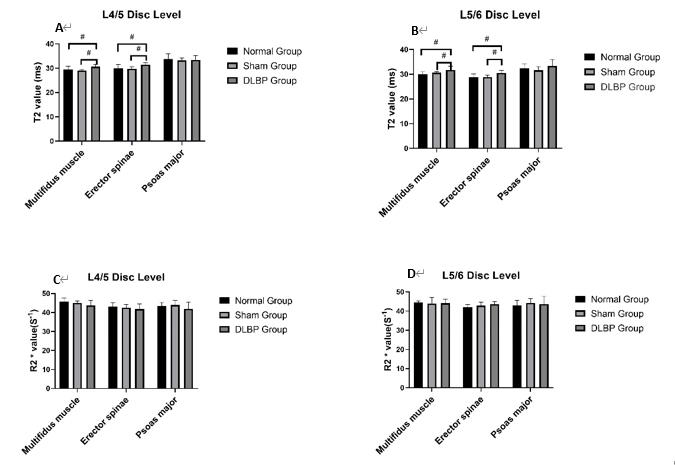
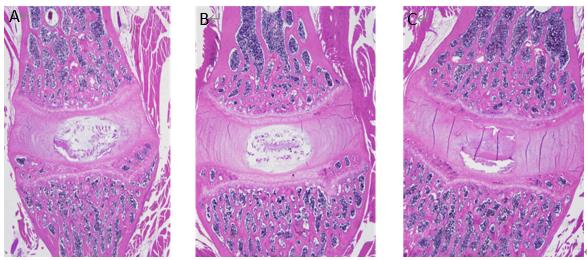
Behavioral assay results show that one month after operation, there was no significant difference in gait disturbance score among the three groups (P all > 0.05). For the DLBP group, pain and warmth response threshold decreased (P < 0.01), the time of grasping decreased (P < 0.01), the time of struggling decreased (P < 0.01), the time of bending prolonged (P<0.01, Figure.2). Imaging results showed that compared with normal group and sham group, DLBP group rats intervertebral disc signal decreased significantly (Figure.3); After paravertebral muscle T2 mapping and BOLD scanning, the T2 values of multifidus and erector spinae in the DLBP group were higher than those in the normal group and the sham group (P < 0.05). There was no significant difference in R2*values of multifidus, erector spinae and psoas major among the three groups ( P all> 0.05, Figure.4).The histological results showed that, in the DLBP group, the normal nucleus pulposus was replaced by fibrous substances, the concentric annulus fibrous structure disappeared, the arrangement was disturbance, and cracks appeared (Figure.5).Discussion and Conclusion
In this study, the model of DLBP in rats was successfully established by X-ray guided puncture of intervertebral disc, and observed the behavioral, imaging and histological changes. Behaviorally, the rats with this modeling method showed a decrease in pain and temperature response threshold. The grip force and tail suspension assay could induce the axial pain in the back of rats. Imaging showed lumbar disc signal reduction. Histology showed that the normal disc structure disappeared and the nucleus pulposus was replaced by fibrous substances.The behavior disturbance and intervertebral disc degeneration of DLBP rats were consistent with the clinical and imaging findings of DLBP patients, indicating that the modeling method is feasible and effective. It was also found that the T2 value of multifidus and erector spinae in the DLBP group was higher than that in the normal group and the sham group. Existing literature suggest that a higher resting state T2-value is related to more fat infiltration4. But in this study, DLBP is still at an early stage, we suggested that this may be caused by inflammation and edema of paravertebral muscle, and may also be related to the excessive movement of spinal segments and excessive activation of paravertebral muscle caused by early spinal instability of DLBP. There was no significant difference in R2*value in this study, the possible reason was that the course of DLBP is still in early stage and has not affected the change of muscle perfusion. The establishment of this model provides a reliable animal model for further study of DLBP paravertebral muscle pathology and molecular changes. Meanwhile, T2 mapping technology provides an effective imaging method for observing the microscopic changes of paravertebral muscles in the early stage of DLBP.Acknowledgements
No acknowledgement found.References
[1] Lu Y, Guzman JZ, Purmessur D, et al.Nonoperative management of discogenic back pain: a systematic review[J].Spine.2014,39(16):1314-24.
[2] Ranger TA, Cicuttini FM, Jensen TS, et al. Are the size and composition of the paraspinal muscles associated with low back pain? A systematic review. The spine journal : official journal of the North American Spine Society. 2017;17(11):1729-1748.
[3] Fusellier M, Clouet J, Gauthier O, Tryfonidou M, Le Visage C, Guicheux J.Degenerative lumbar disc disease: in vivo data support the rationale for the selection of appropriate animal models[J].European cells & materials.2020,39:18-47.
[4] Goubert D, De Pauw R, Meeus M, et al. Lumbar muscle structure and function in chronic versus recurrent low back pain: a cross-sectional study. Spine J. 2017;17(9):1285-1296
Figures