2856
Simulations of the BOLD Non-Linearity Based on a Viscoelastic Model for Capillary and Vein Compliance
Joerg Peter Pfannmoeller1, Grant Addison Hartung1, Xiaojun Cheng2, Avery Berman1, David Boas2, and Jonathan Rizzo Polimeni1
1Athinoula A. Martinos Center for Biomedical Imaging, Massachusetts General Hospital, Charlestown, MA, United States, 2Neurophotonics Center, Boston University, Boston, MA, United States
1Athinoula A. Martinos Center for Biomedical Imaging, Massachusetts General Hospital, Charlestown, MA, United States, 2Neurophotonics Center, Boston University, Boston, MA, United States
Synopsis
The stimulus duration depended nonlinearity of the BOLD response is difficult to model, as it often requires stimulus-specific parameter values. Here we have extended an existing framework of BOLD response modeling based on biophysical simulations of realistic microvascular anatomy and dynamics to incorporate viscoelastic properties of individual blood vessels and tissue. We then applied this model to examine BOLD response nonlinearities to long-duration stimuli. We find that this model largely captures the differences in BOLD responses observed to short- and long-duration stimuli.
Summary of Main Findings
We extended an existing framework of BOLD modeling based on biophysical simulations to incorporate viscoelastic properties of individual blood vessels and tissue, and use it to examine BOLD response nonlinearities to short-duration stimuli.Introduction
Current dynamic models of the BOLD response, such as the “balloon model” framework (Buxton et al. 2012) capture the interplay between the various underlying components of the hemodynamic response and have provided insight into the biophysical mechanisms of the fMRI signals. There are some aspects of the BOLD response, however, that are challenging to capture, such as the nonlinearity of the BOLD response that emerges in the transition from long- to short-duration stimuli, roughly at 4 s. Some aspects of this nonlinearity appear to be vascular in origin (as opposed to neural); to capture this stimulus-length-dependent nonlinearity, it has been suggested that several parameters of the balloon model, such as the parameter controlling the viscoelastic properties of the venous balloon, should change as a function of stimulus duration (Uludag and Blinder 2018). Because it is not clear a priori how to adjust these parameters with stimulus configuration, this limits the usability of the Balloon model framework. Here we sought to investigate, from first principles, the mechanistic origins of this stimulus-dependent nonlinearity. We utilized a biophysical simulation based on realistic microvascular anatomy and dynamics (Gagnon et al. 2015) and extended this to model the viscoelasticity of individual compliant vessels embedded in the cortical tissue. We find that, by setting the viscoelasticity of each individual vessel based on its diameter and known mechanical properties, our model captures the nonlinear effects observed in measured BOLD data. Our results suggest that the stimulus-dependent parameter values needed in the balloon model can be replaced by a fixed viscoelasticity set for each vessel.Methods
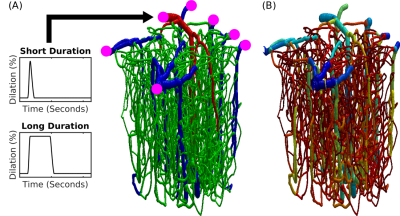
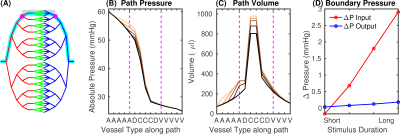
We used realistic Vascular Anatomical Network (VAN) models reconstructed from mouse cortex (Gagnon et al. 2015), see Fig. 1. To determine the boundary conditions for our realistic VAN models, we used a whole-brain vascular network (Boas et al. 2008) modified to achieve the ratio of diving arteries to ascending veins in mouse (1:3) (Fig.2). Our computations show a pressure increase in the entire network due to active arterial dilation corresponding to an intracortical arterial in the realistic VAN, which depends on stimulus duration. The results were used to generate a look-up table to set the pressures in the boundary nodes of realistic VAN simulations.We then modified the simulation framework to incorporate vascular and tissue elasticity and viscous damping for vessel-specific compliance of capillaries and veins (Park et al. 2019). Youngs modulus E is 7 kPa for pial veins and 20 kPa for brain tissue leading to 27 kPa for diving veins and capillaries (Gao et al. 2015). Vein and capillary wall viscosity was set to φ=140 kPa s/m (Zócalo et al. 2008) and vessel wall thickness was individually determined (Mueller et al. 2008). The resulting blood flow dynamics were used to computed advective and diffusive oxygen transport to determine susceptibility changes in the vessels (Fang et al. 2008) and magnetic field offsets which were in turn used to determine the BOLD signal in a Monte-Carlo tissue water diffusion simulation (Gagnon et al. 2015).
Results
A fit between the volume time course and the Balloon model equation (Simon et al. 2015) allowed to determine the Balloon model parameter τ for every vessel (Fig.3A). We found that τ = 20 s was typical for pial veins, while diving veins and capillaries had a τ of approximately 5 s. The blood volume shows the typical two-phase increase, where the fast increase and decrease is due to active arterial dilation and the slower one due to capillaries and veins (Fig.3B). The flow-volume α was found to depend on venous output pressure (Fig.3C) which was due to the non-linear volume increase in capillaries and veins for long stimulus durations.Pial veins drive the transition from linear to non-linear if stimulus length is increased (Fig.4), which is due to their delayed volume response. The slow decrease of the pial vein blood volume causes a post stimulus under shoot if response length and pressure increase are sufficiently large (Fig.4D). In our simulations the pial vein signal and the undershoot vanished for cortical depths > 150 μm.
Discussion
Blood pressure changes during functional activation and the viscoelastic reaction of the vessels in the brain are key mechanisms in the stimulus length driven BOLD nonlinearity. Some magnitudes of the BOLD non-linearity are small in our simulations due to the small number of pial veins and absence of periavascular (Virchow-Robin) spaces impacting diving vein elasticity in the upper cortical layers and potentially increasing the range of the post stimulus undershoot deeper into the cortex. We assumed similar elasticity of capillaries and diving veins although there are structural differences, e.g. pericytes may have an impact by regulating vessel tone. Overall, this biophysical model appears to generate realistic BOLD responses for both short- and long-duration stimuli with a fixed set of vascular parameters.Acknowledgements
We thank Drs. Timothy Secomb and Andreas Linninger for helpful discussions. This work was supported in part by the NIH NIBIB (grant P41-EB030006 and R01-EB019437), by the BRAIN Initiative (NIH NIMH grants R01-MH111419 and R01-MH111438), and by the MGH/HST Athinoula A. Martinos Center for Biomedical Imaging; and was made possible by the resources provided by NIH Shared Instrumentation Grant S10-RR023043 and the German Research Foundation (DFG PF 897/2-1).References
- Buxton R. Dynamic models of BOLD contrast. NeuroImage 2012;62: 953–961.
- Uludag K, Blinder P. Linking brain vascular physiology to hemodynamic response in ultra-high field Neuroimage 2018;168:279-295.
- Gagnon L, et al. Quantifying the Microvascular Origin of BOLD-fMRI from First Principles with Two-Photon Microscopy and an Oxygen-Sensitive Nanoprobe. The Journal of Neuroscience 2015; 35(8):3663–3675.
- Boas D, et al. A vascular anatomical network model of the spatio-temporal response to brain activation. Neuroimage 2008; 40(3): 1116–1129.
- Park C, et al. An efficient full space-time discretization method for subject-specific hemodynamic simulations of cerebral arterial blood flow with distensible wall mechanics. Journal of Biomechanics 2019;87:37–47.
- Zocalo Y, et al. Regional differences in veins wall viscosity, compliance, energetics and damping: analysis of the pressure-diameter relationship during cyclical overloads. Biol. Res. 2008;41:227-233.
- Mueller B, et al. High-resolution tomographic imaging of microvessels. Proc. of SPIE. 3008; 7078:70780B.
- Gao Y, et al. Mechanical restriction of intracortical vessel dilation by brain tissue sculpts the hemodynamic response. NeuroImage 2015; 115:162–176.
- Fang Q, et al. Oxygen advection and diffusion in a three- dimensional vascular anatomical network. 2008 Optics Express;16(22):17530-17541.
- Simon A, et al. Understanding the dynamic relationship between cerebral blood flow and the BOLD signal: Implications for quantitative functional MRI. NeuroImage 2015;116:158–167.
Figures

Fig.1 Realistic VAN model of mouse cortex. (A) Anatomical reconstruction of full vascular network (600 micron cube). Arteries (red), capillaries (green), veins (blue). The inputs and outputs to the network are indicated in magenta. The boundary conditions must be computed to emulate the behavior within the VAN as if it were connected to large feeding arteries and draining veins as it is in the brain. (B) The distribution of Young’s elasticity modulus indicating the characteristic difference between pial veins and the intra cortical diving veins and capillaries (logarithmic scale).

Fig.2 Determination of boundary conditions using a whole-brain stylistic VAN. (A) Vascular network for mouse brain (diving artery:vein ratio 1:3; arteries red, capillaries green, veins blue). Cyan indicates the path used for analysis, the area representing the realistic VAN is shaded, magenta dots show the VAN boundary nodes. (B) Pressure and (C) blood volume along the path in (A) for baseline and active conditions for short and long-duration stimuli. Magenta lines indicate the boundary nodes in (A). (D) Pressure increases at the boundary nodes for different stimulus durations.

Fig.3 Comparison of VAN simulations and Balloon model predictions. (A) To estimate the equivalent Balloon model parameters flow-volume α and viscoelastic τ from our simulations, we fit the Balloon model to our estimated BOLD response. (B) Contributions to the total blood volume. Capillaries and veins increase and decrease their diameter with a delay to the arterials. (C) Output boundary pressure dependency for the flow-volume relationship of all vessels, veins, and pial veins.

Fig.4 Transition between the linear and nonlinear regimes of the BOLD response. (A) BOLD response for a short-duration (2 s, blue) and a long-duration (20-s, red) stimulus. The short stimulus is expected to fall within the linear regime and the long stimulus within the nonlinear regime. (B) Pressure boundary condition at the at the arterial input. (C) Pial vein blood volume responses show an extreme delay to blood flow. (D) Corresponding BOLD responses. The long-duration-stimulus BOLD response exhibits a post-stimulus undershoot while the short-duration-stimulus does not.