2851
Improving the Bloch Fitting Method for the Analysis of acidoCEST MRI1Cancer Systems Imaging, UT MD Anderson Cancer Center, Houston, TX, United States
Synopsis
With the expansion of clinical CEST MRI, the analysis methods for Z-spectra need further validation and optimization. Fitting CEST spectra with the modified Bloch-McConnell equations provides the gold standard for chemical exchange rate (kex) quantification, but the current direct-fitting process requires fitting eight parameters. In this study, we have optimized the Bloch-fitting process and incorporated experimentally measured information. We tested the performance of the optimized algorithm using iopamidol phantoms of various pH levels and discovered that including experimentally determined T1, T2 and B0 information can increase the accuracy of the kex fitting results.
Introduction
Extracellular acidosis in tumors originates from dysregulated cellular production of lactic acid, a phenomenon known as the Warburg effect, and serves as an important biomarker for tumor staging and prediction of therapeutic effect.1-3 Therefore, imaging pH in vivo is of particular interest for tumor management and personalized medicine. AcidoCEST MRI can quantitatively measure extracellular pH (pHe) by probing the base-catalyzed proton exchange reaction between water protons and amide protons,4 and fitting the CEST Z-spectra with modified Bloch-McConnell equations provides the gold standard for extracting the chemical exchange rates (kex) for the exchanging protons.5 However, the current Bloch-fitting algorithm directly fits for eight parameters and requires long computation time. In this study, we developed an experimental acquisition pipeline that fixes a group of fitting parameters with experimentally measured values during the fitting process. We tested the performance of the new fitting algorithm on the Z-spectra of iopamidol phantoms and confirmed that incorporating experimentally determined information into the Bloch-fitting process increases the accuracy and precision of the fitting results.Methods
Two-hundred iopamidol (ISOVUE®, Bracco Diagnostics Inc.) phantom samples of five concentrations (5, 10, 15, 25 and 50 mM) were prepared. For each concentration, the iopamidol solutions were tuned to five T1 values using different concentrations of Magnevist and Gadovist (Bayer AG). For each concentration and each T1 value, eight solutions were prepared at eight pH levels equally spaced between 6.25 and 7.30 using sodium hydroxide and hydrochloric acid solutions. The deviation of the true pH level of each sample was controlled to be under 0.03 pH units from the desired pH level as verified by a calibrated laboratory pH sensor (Mettler Toledo). Thirty-six CEST scans were performed on each iopamidol phantom sample using a fast imaging with steady-state precession (FISP) sequence and a cross-combination of six saturation powers (0.5, 1, 2, 3, 4 and 6 μT) and six saturation times (0.5, 1, 2, 3, 4 and 6 sec) on a Bruker 7T preclinical scanner (Biospec USR70/30). For each CEST scan, 81 CEST images from -12 to 12 ppm plus multiple images at dummy frequencies were acquired. The set of 36 CEST scans was repeated for each phantom sample at five temperatures (43, 40, 37, 34 and 31 °C). In addition, T1 maps were acquired using a saturation recovery method. T2 maps were acquired using a fast spin-echo (FSE) type sequence. B1 maps were acquired using the dual-angle method. B0 maps were acquired using the WASSR method.6 Other parameters included field of view (FOV) = 70 mm x 70 mm, slice thickness = 1 mm and matrix size = 128 x 128. The image analysis and Bloch-fitting was performed with MATLAB (Mathworks).Results
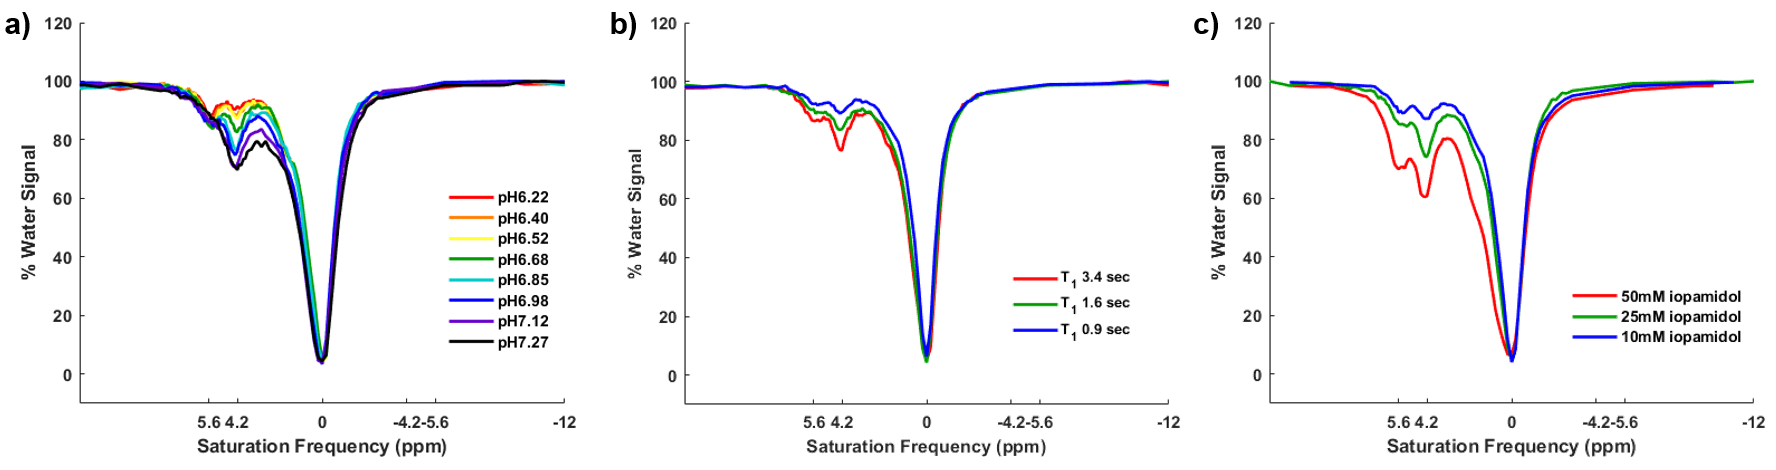
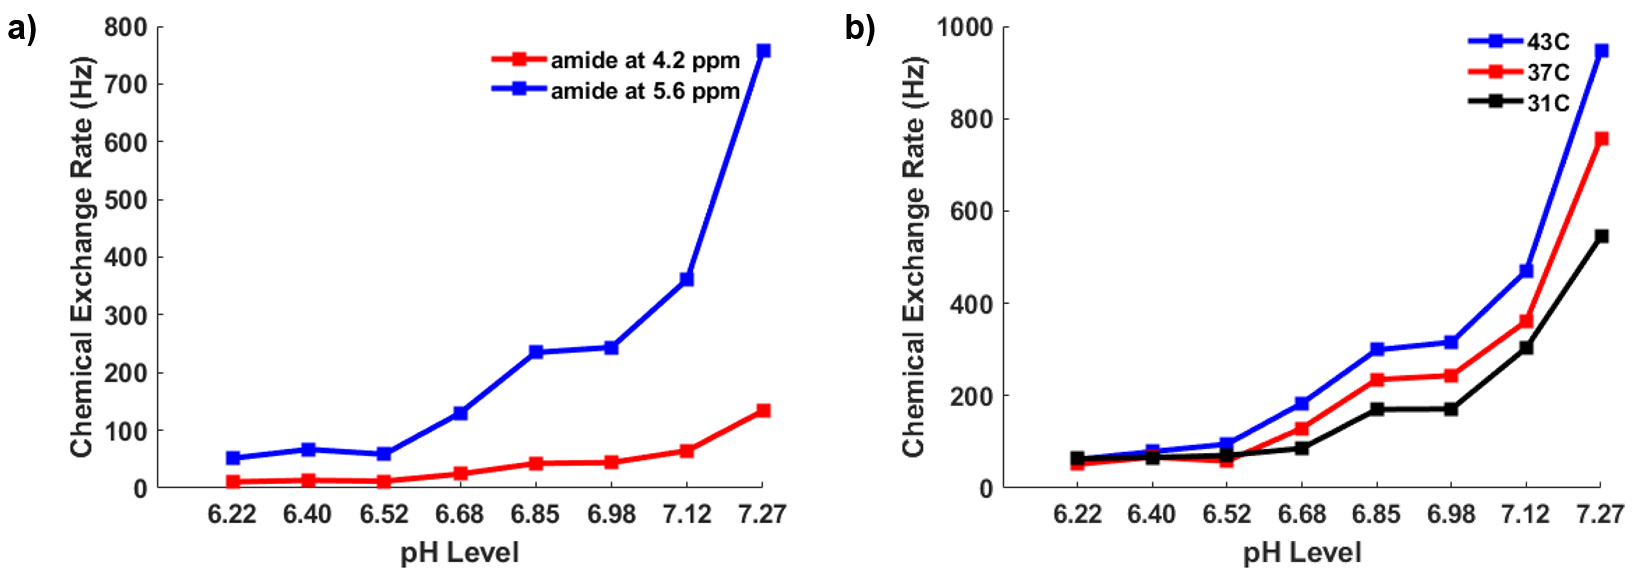
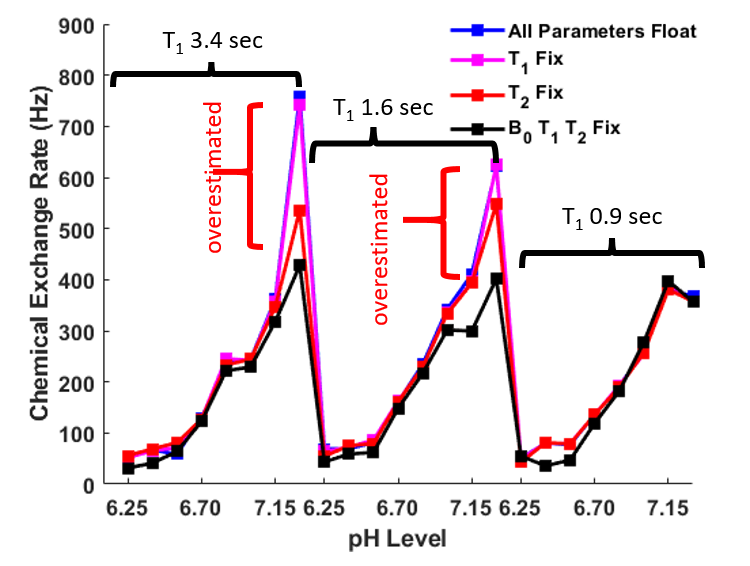
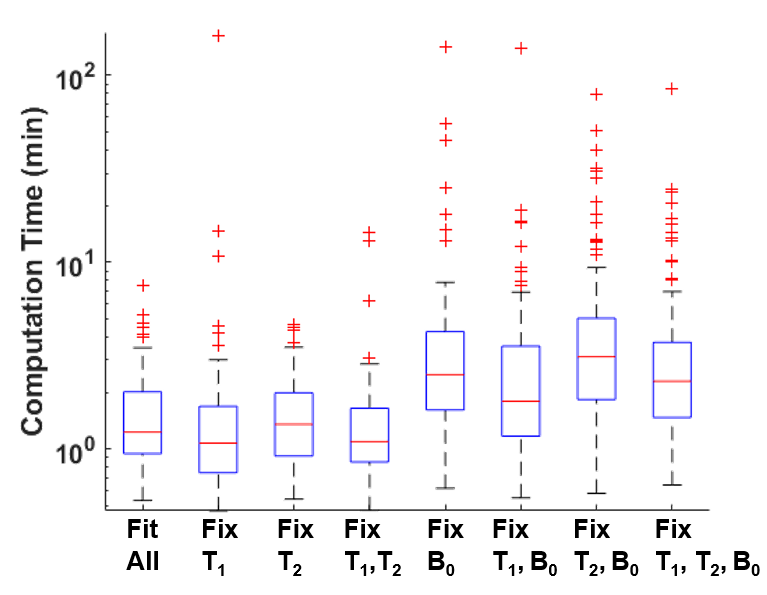
Example spectra of iopamidol samples at different pH levels, different concentrations and different T1 values are presented in Figure 1. As previously reported,7 the CEST contrast for the amide proton at 4.2 ppm increases with increasing pH between pH values of 6.25 and 7.30, whereas the CEST contrast for the amide proton at 5.6 ppm first increases and then decreases in the same pH range. The changes in the amplitudes of CEST contrasts for the amide protons with contrast concentrations and T1 values also agree with previously published results. The kex that we obtained from the Bloch-fitting algorithm for both amide protons show an increasing trend as sample pH and sample temperature increase (Fig. 2). Figure 3 shows the comparison for the fitted kex for the 5.6 ppm amide proton with different fitting conditions (i.e. different fitting parameters fixed with experimental values). The computation time for fitting the spectra of 24 iopamidol samples at five temperatures using different fitting conditions is summarized in Figure 4.Discussions
The changes in the iopamidol amide contrasts in Z-spectra with CEST agent concentrations, T1 values, sample pH values, saturation powers and saturation times match well with previous studies.4,7 Our Bloch fitting algorithm can detect the increase of amide kex with increasing sample pH and temperatures. Our results show that reducing the number of parameters fitted in the Bloch-fitting process by fixing the parameters with experimentally measured values can significantly affect the fitted kex of the iopamidol amide protons. Specifically, adding T2 and B0 information has the largest effect in increasing the accuracy and precision of the fitting results, as demonstrated by the decrease of the discrepancy in the fitted kex results caused by T1 shortening for iopamidol samples with the same pH. However, to our surprise, reducing the number of fitted parameters does not significantly shorten the computation time of the fitting process. In fact, including experimental B0 information significantly increases the fitting time. We suspect that adding experimental information may change the geometry of the optimization process and therefore requires more iteration steps to reach the convergence threshold.Conclusions
The Bloch-fitting algorithm that we developed is capable of detecting the changes of kex of iopamidol amide protons for samples at different pH levels and temperatures. We have shown that replacing fitted parameters with experimental values increase the accuracy and precision of Bloch-fitting.Acknowledgements
This work was supported by the National Institutes of Health grant no. 1R01CA169774. T.L. would like to also thank the MDA Small Animal Imaging Facility. S.Z. would like to thank Odyssey Program and Cockrell Foundation Award for Scientific Achievement at The University of Texas MD Anderson Cancer Center.References
1. Warburg O. On the origin of cancer cells. Science 1956;123:309-314.
2. DeClerck K, Elble RC. The role of hypoxia and acidosis in promoting metastasis and resistance to chemotherapy. Front Biosci. 2010;15:213-225.
3. Huber V, Camisaschi C, Berzi A, et al. Cancer acidity: An ultimate frontier of tumor immune escape and a novel target of immunomodulation. Semin Cancer Biol. 2017;43:74-89.
4. Randtke E, Granados JC, Howison CM, et al. Multislice CEST MRI improves the spatial assessment of tumor pH. Magn Reson Med. 2017;78:97-106.
5. Woessner DE, Zhang S, Merritt ME, et al. Numerical solution of the Bloch equations provides insights into the optimum design of PARACEST agents for MRI. Magn Reson Med. 2005;53:790-799.
6. Kim M, Gillen J, Landman BA, et al. Water saturation shift referencing (WASSR) for chemical exchange saturation transfer (CEST) experiments. Magn Reson Med. 2009; 61(6): 1441-1450.
7. Chen LQ, Howison CM, Jeffery JJ, et al. Evaluations of Extracellular pH within in vivo tumors using acidoCEST MRI. Magn Reson Med. 2014;72:1408-1417.
Figures