2850
Mechanism and quantitative assessment of saturation transfer for water-based detection of the aliphatic protons in carbohydrate polymers1Institute of Biomedical and Health Engineering, Shenzhen Institutes of Advanced Technology, Shenzhen, China, 2The Russell H. Morgan Department of Radiology, The Johns Hopkins University School of Medicine, Baltimore, MD, United States, 3F.M. Kirby Research Center for Functional Brain Imaging, Kennedy Krieger Institute, Baltimore, MD, United States
Synopsis
A three-pool relayed NOE (rNOE) model and its theoretical solution is formulated to describe the rNOE-based signal in CEST experiments and the analytical solution for rNOE transfer presented. We show that experimental data for glycogen solutions in D2O and H2O could be analyzed successfully using this analytical theory, which was further validated using numerical simulations with the Bloch equations. The study increases the understanding of the aliphatic components of Z-spectra of sugar polymers as well as of other macromolecules such as proteins and lipids.
Introduction
Previous CEST MRI studies on carbohydrate polymers such as glycogen1,2 and glycosaminoglycans3 reported strong magnetic connections between the aliphatic protons in these macromolecules and water protons. A three-pool relayed NOE (rNOE) model and an analytical solution for quantitative description of the magnetization transfer (MT) processes is presented. We show that the analytical solutions for the rNOE process from the simplified 2-step MT model agrees well with experimental measurements and numerical simulations based on the Bloch equations. This study provides insight into the origin of Z-spectra of carbohydrate polymers as well as a theoretical basis for CEST MRI effects related to carbohydrate polymers.Materials and Methods
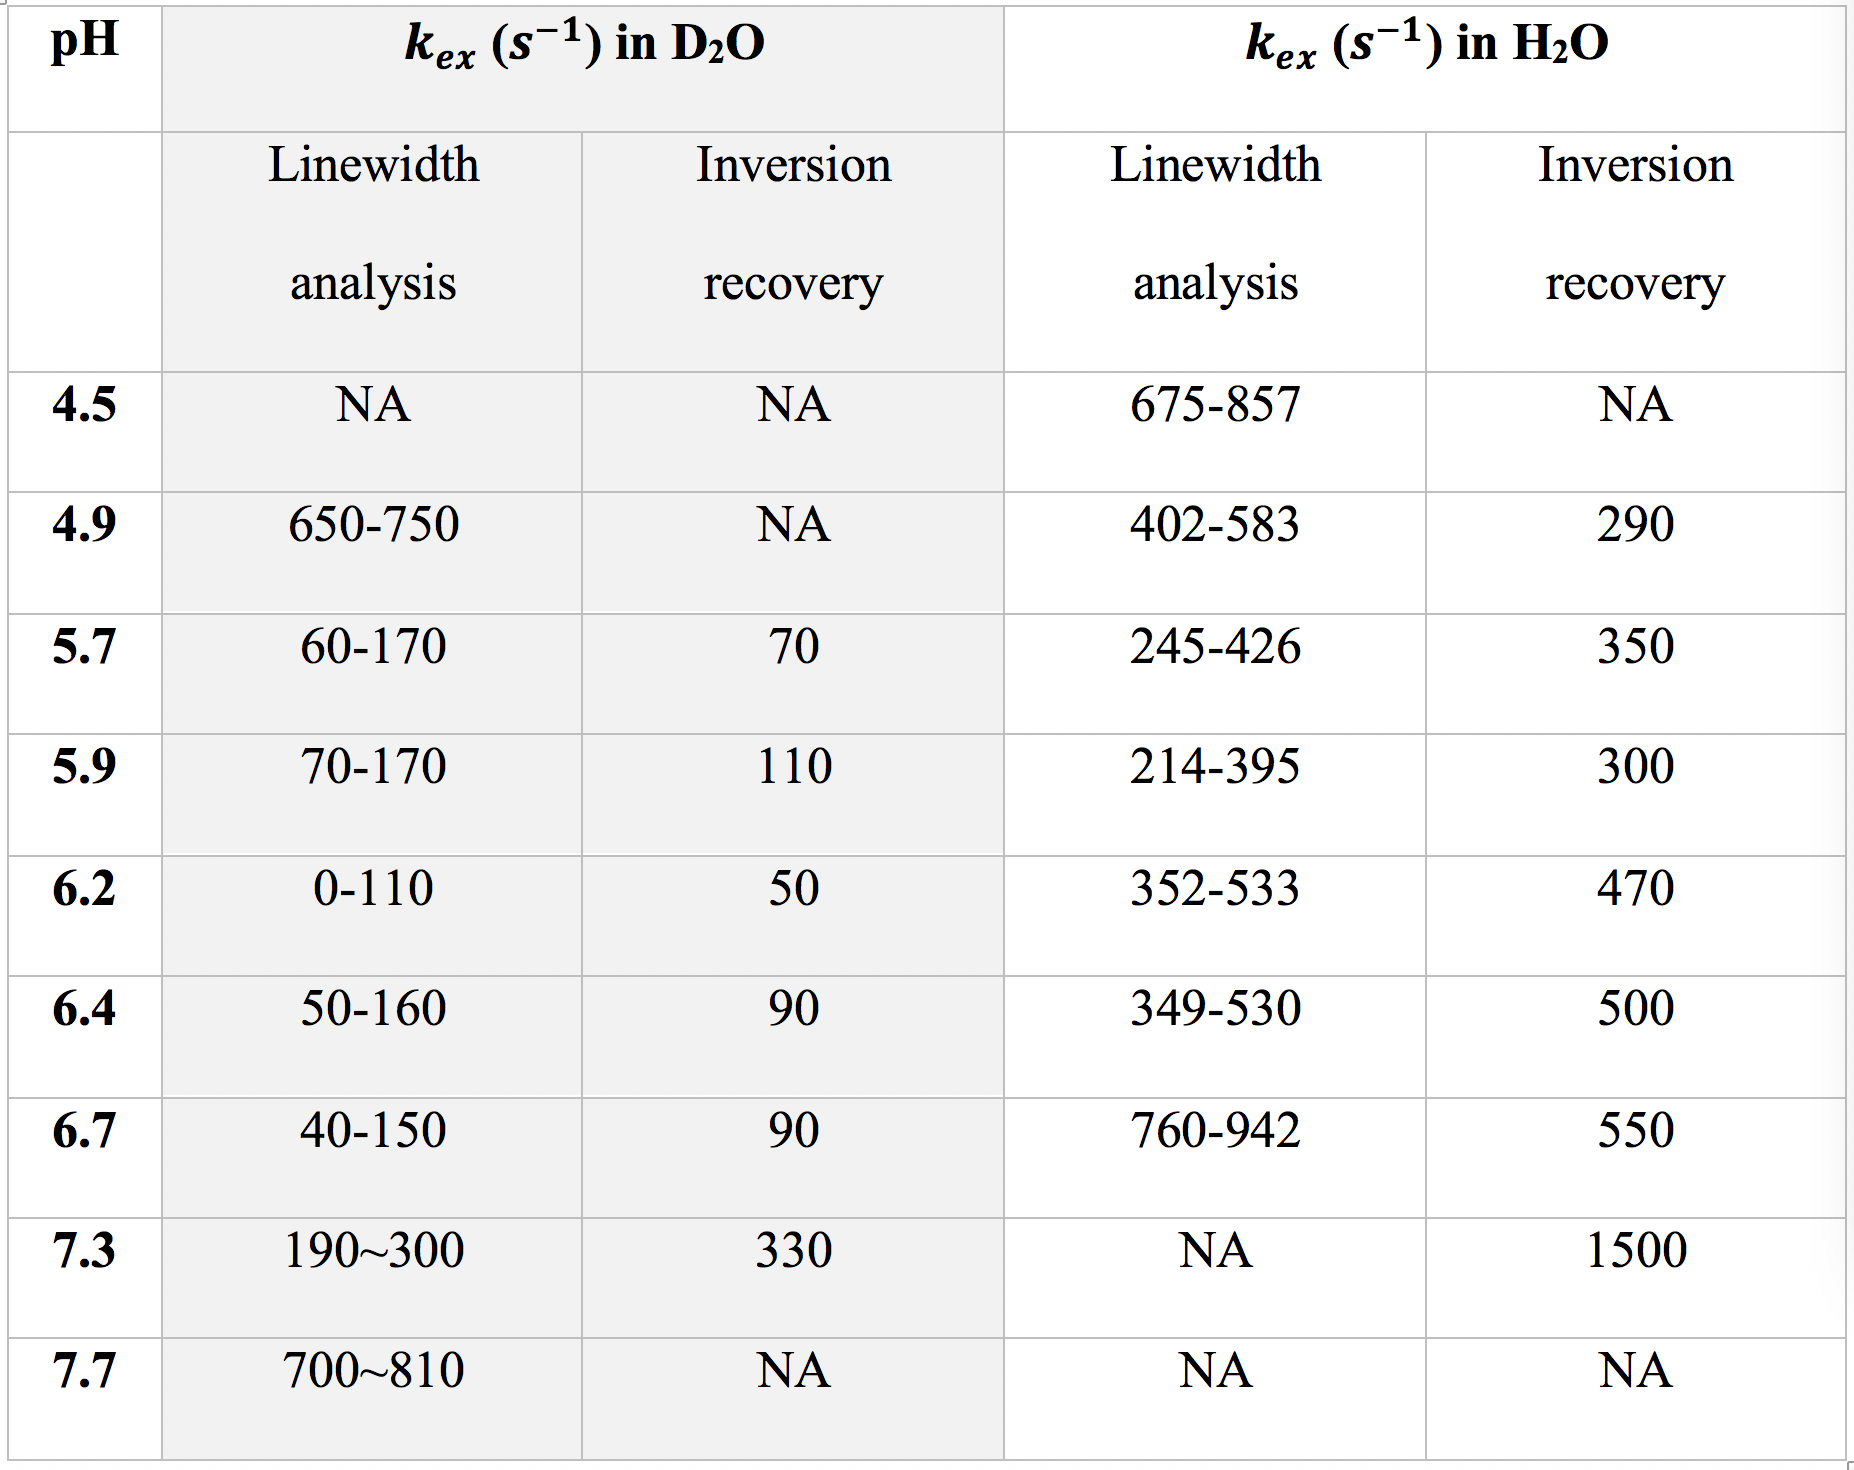
Three types of glycogen, from bovine liver, rabbit liver, and oyster (Sigma, St. Louis), were dissolved in phosphate-buffered saline prepared with either 95% H2O/5% D2O or 95% D2O/5% H2O and pH-adjusted. NMR experiments were conducted using a 17.6 Tesla (T) Bruker Avance III (Bruker, Ettlingen, Germany) scanner at 20°C.To measure the exchange rates of glycogen hydroxyl protons, linewidth and exchange rate analysis were used for the combined hydroxyl proton (OH2+OH3) signal at an offset of +1.2 ppm from water. A) Linewidth analysis: the half-height linewidth ($$$v_{1/2}$$$) depends on apparent T2: $$$v_{1 / 2}=\frac{1}{\pi T_{2}}=\frac{\left(R_{2}^{*}+k_{e x}\right)}{\pi}$$$ where $$$R_{2}^{*}$$$ is the apparent transverse relaxation rate from non-chemical-exchange contributions. B) Selective inversion recovery: the apparent longitudinal relaxation rate (R1) in selective inversion recovery of OH2+OH3 is : $$$R_{1}=\rho+k_{e x}$$$ where $$$\rho$$$ is the longitudinal relaxation rate from non-chemical-exchange contributions.
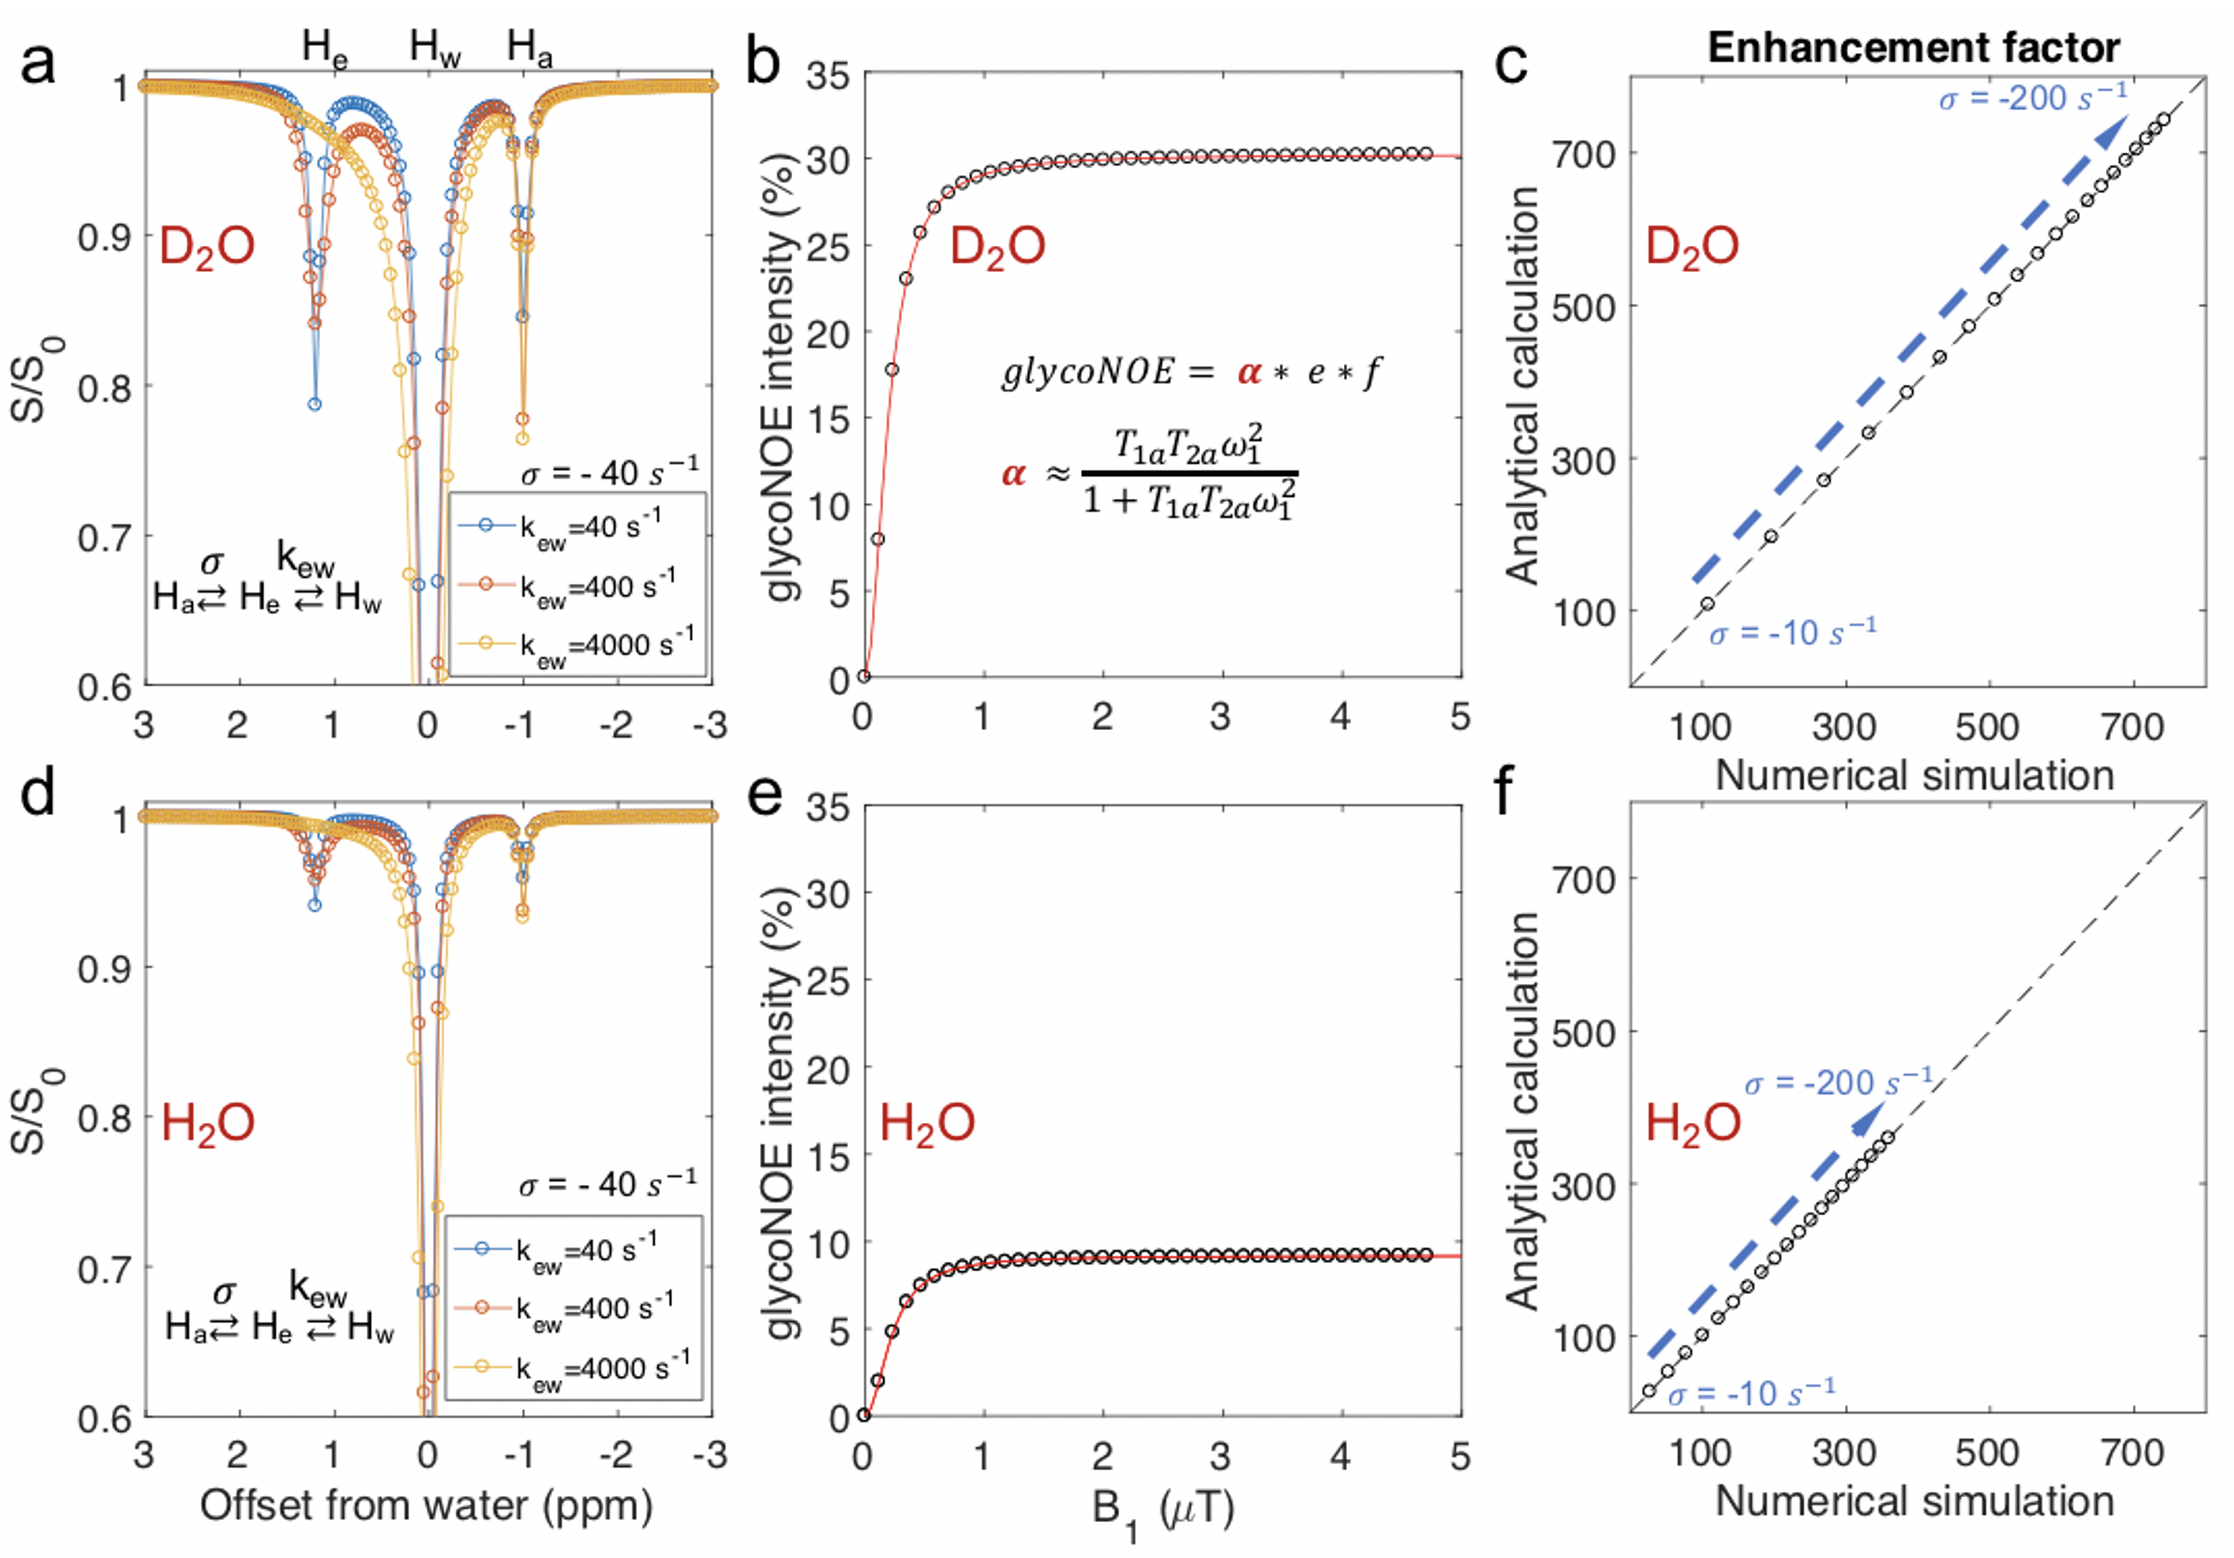
Numerical simulations: according to the three-pool model (M1), the x, y, z-magnetization evolutions of $$$H_{a}, H_{e} \text { and } H_{w}$$$, and under the irradiation of a continuous radio frequency (RF) pulse was described numerically by the a full set of modified Bloch equations.
Results
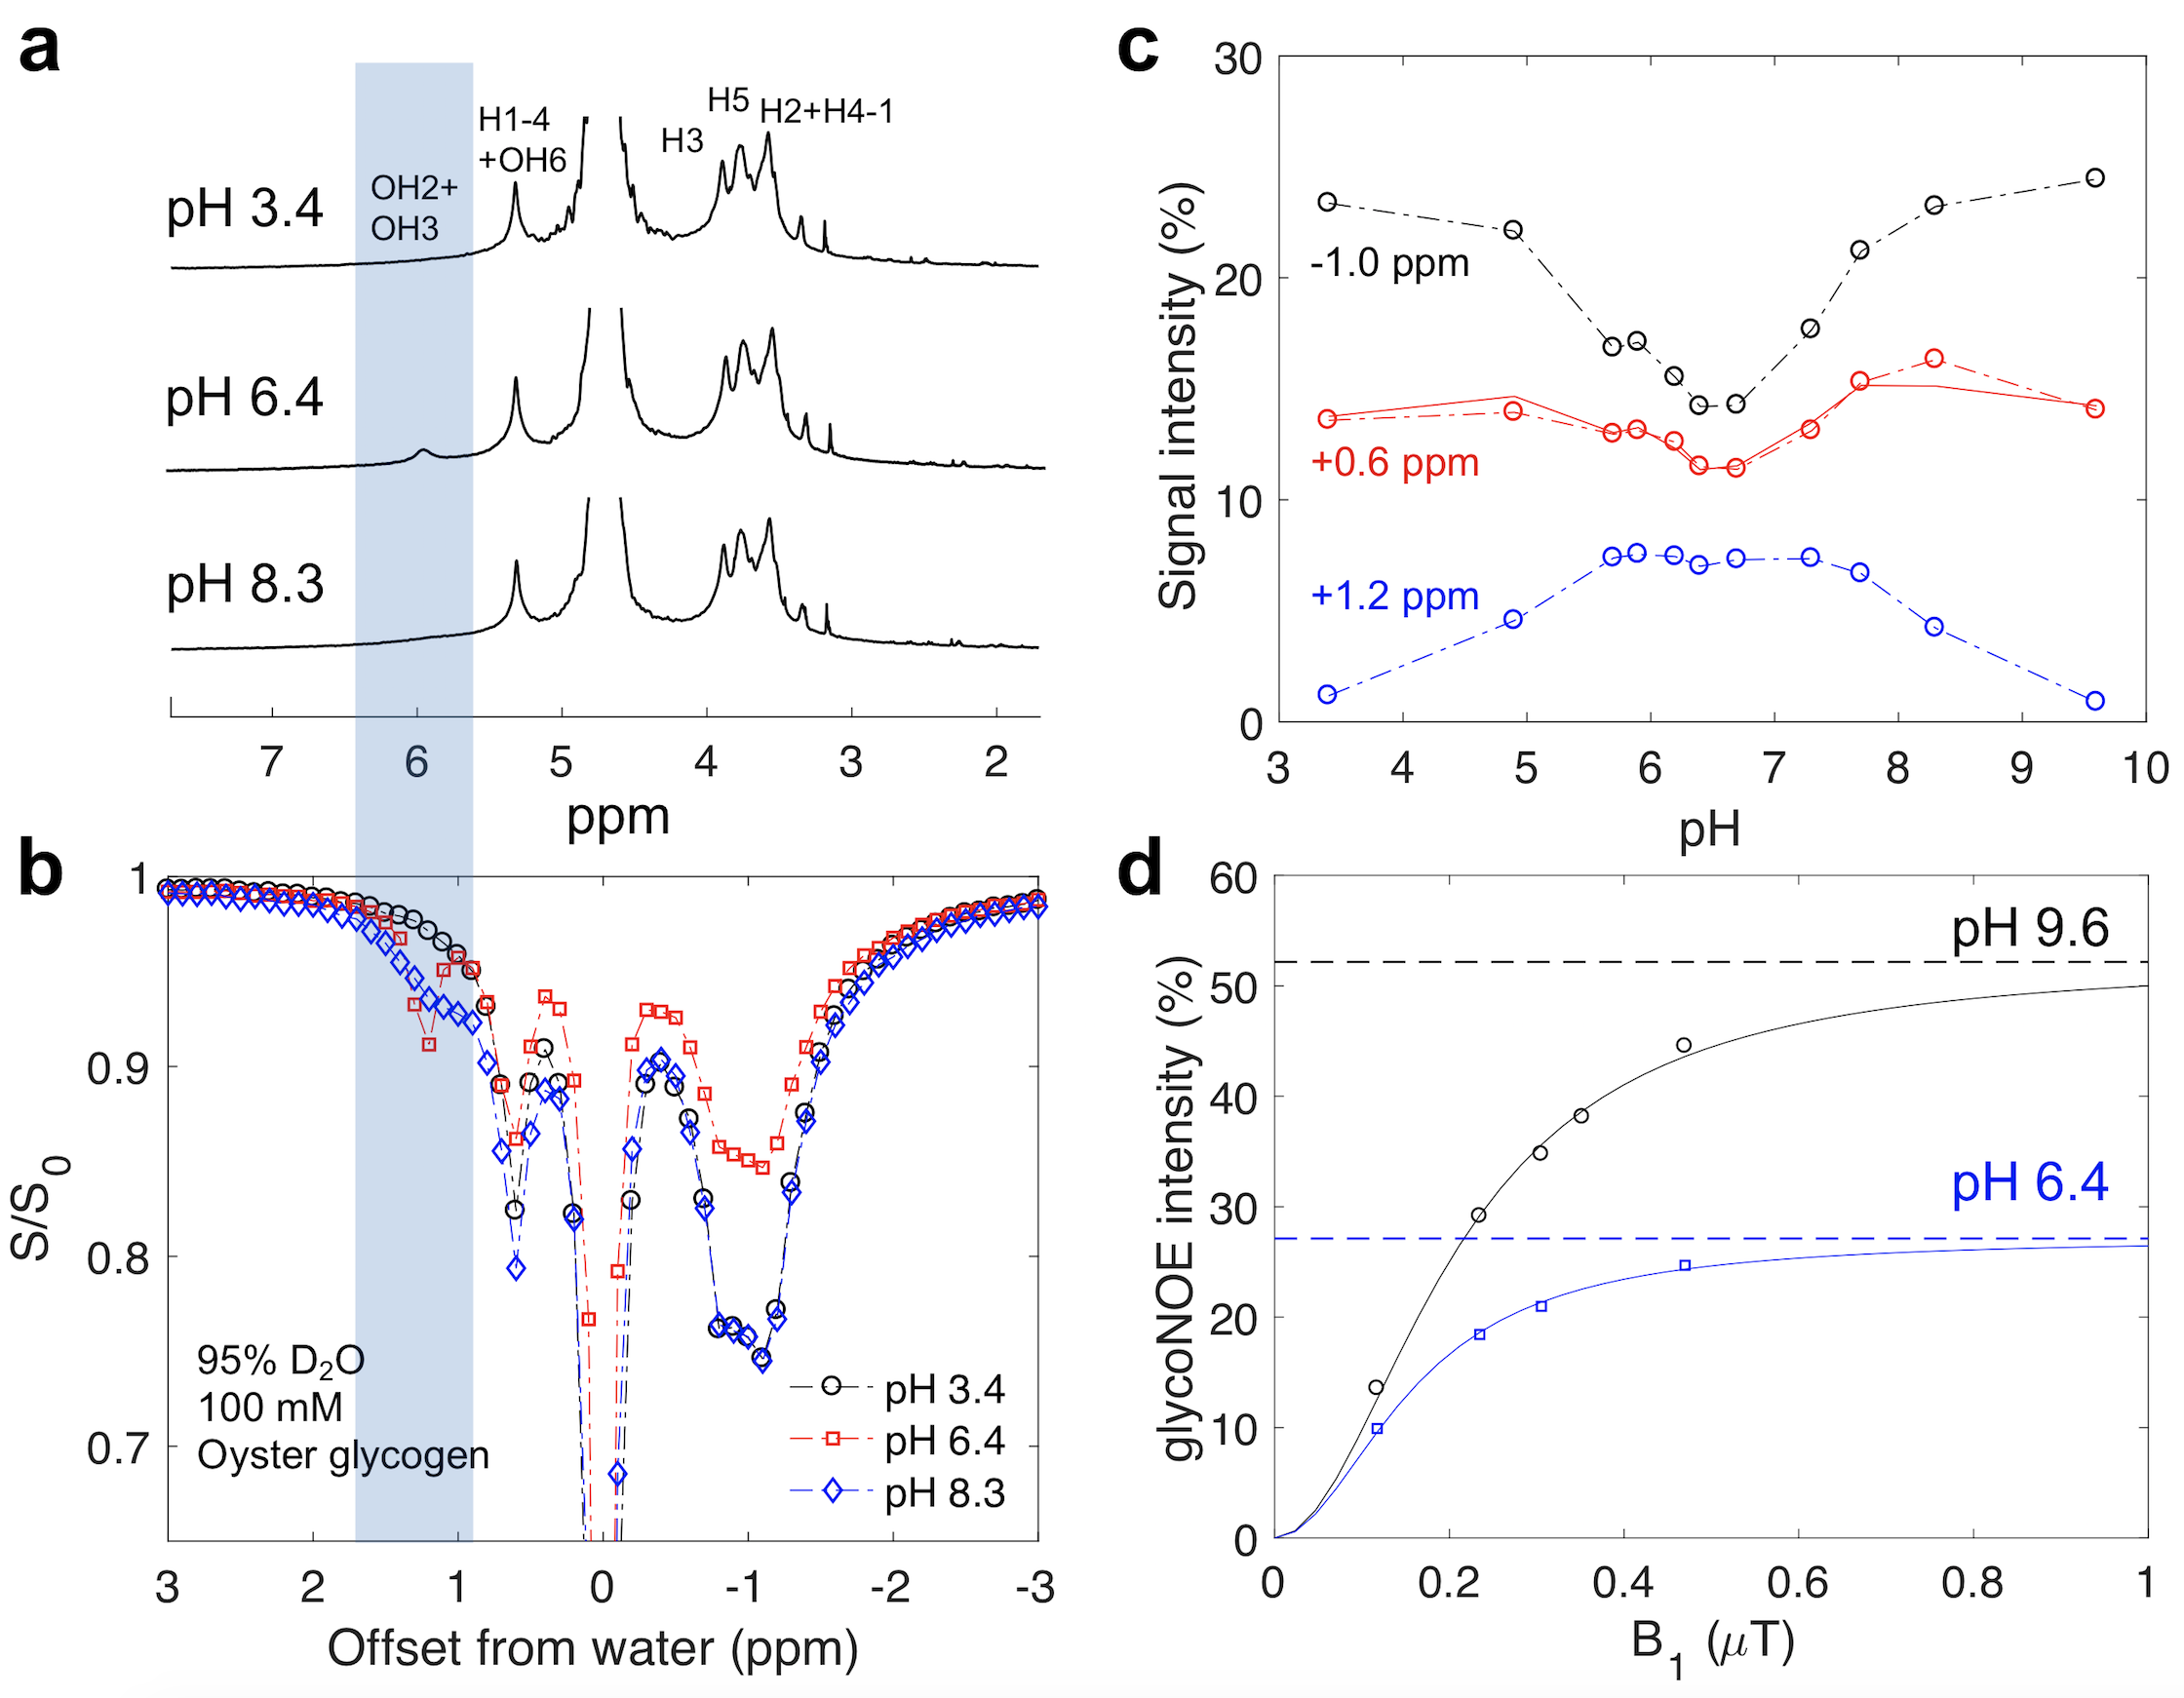
The hydroxyl proton exchange rate with water is known to be affected by solvent pH4 and the H2O/D2O ratio5. The line-shapes of glycogen hydroxyl peaks in 1D NMR spectra in D2O changed as a function solvent pH (Figure 1a), due to its varied chemical exchange rates (Table 1). Figure 1b shows the Z-spectra of glycogen in 95% D2O/5% H2O solution, the glycoNOE (−1 ppm in the Z-spectra) signal intensity is lowest in the pH range 5.7 to ~7 and increases at lower and higher pH (Figure 1c) , the same pattern as observed in the dependence of hydroxyl exchange rates on pH (Table 1).The following three-pool relayed NOE (rNOE) model and the theoretical description of magnetization transfer (MT) processes is used to understand rNOE-based signal of glycogen. \begin{array}{c}\sigma_{ae} \quad k_{ew} \\ H_{a} \leftrightarrow H_{e} \leftrightarrow H_{w} \\ \sigma_{ea} \quad k_{we}
\end{array} where $$$H_{a}, H_{e}$$$ and $$$H_{w}$$$ represent an aliphatic proton pool, a neighboring exchangeable (hydroxyl) proton pool and the free water proton pool, respectively. $$$\sigma_{ae}$$$ and $$$\sigma_{ea}$$$ are the “effective” NOE longitudinal cross-relaxation rates, $$$k_{ew}$$$ and $$$k_{we}$$$ are the exchange rates of the neighboring hydroxyl and the water protons, respectively. The analytical solution for the steady-state rNOE signal in CEST experiments was derived to be: $$\text {glycoNOE} \equiv \frac{\left(W_{z, 0}-W_{z}\right)}{W_{z, 0}}=\frac{-\sigma_{ae}}{\left(\rho_{e}+k_{ew}\right) \frac{\rho_{w}+k_{we}}{k_{ew}}-k_{we}} * \frac{A_{z, 0}-A_{z}}{A_{z, 0}} * \frac{A_{z, 0}}{W_{z, 0}}=e * \alpha * f \quad [1]$$
where $$$\rho_{a}$$$, $$$\rho_{e}$$$ and $$$\rho_{w}$$$ are the longitudinal relaxation rates (without chemical exchange contributions) for aliphatic protons (Ha), exchangeable protons (He) and free water protons (Hw); Here “e” is the “enhancement factor”, $$$e=\frac{-\sigma_{ae}}{\left(\rho_{e}+k_{ew}\right) \frac{\rho_{w}+k_{we} }{k_{ew}}-k_{we}}$$$, $$$\alpha=\frac{A_{z, 0}-A_{z}}{A_{z, 0}}$$$, is the “saturation efficiency”. $$$f=\frac{A_{z, 0}}{W_{z, 0}}$$$.
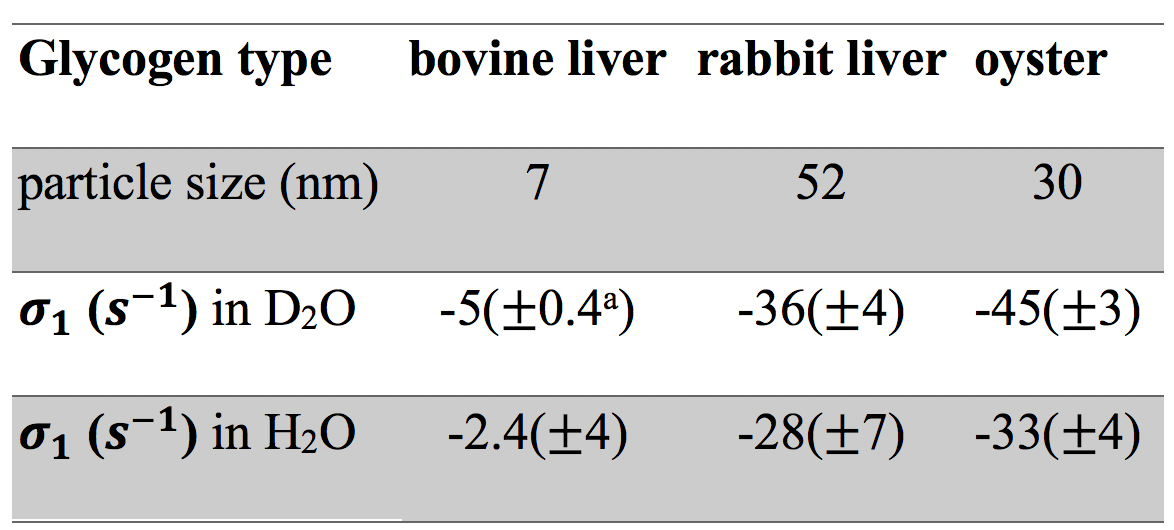
When the hydroxyl exchange rate is in the fast exchange regime ($$$k_{ew} \gg\left|\sigma_{ae}\right|$$$), i.e., at high or low pH, the OH2+OH3 (+1.2 ppm) and OH6 (+0.6 ppm) CEST signals become negligible in the Z-spectra at low B1 (see pH 3.4 in Fig. 1b) and the H1-4 NOE rate ($$$\sigma_{1}$$$) can be quantified from the +0.6 ppm peak in the Z-spectra using Eq. 1. Table 2 shows the values for different glycogen samples (pH of 9.6) in D2O and H2O.
Using the NOE rates (Table 2) and chemical exchange rates (Table 1), the overall glycoNOE signal intensities can be predicted based on Eq. 1. The predicted intensity of glycoNOE at pH 6.4 in D2O is about 60% of the maximum signal using the measured hydroxyl exchange rates for this range ($$$k_{ew} \approx\left|\sigma_{1}\right|$$$). This is in good agreement with the experimental data in Fig. 1d, which shows that for the pH of 6.4 in D2O, the glycoNOE intensities are about 50% of the maximum signal (measured at pH of 9.6). This suggests that the rNOE mechanism alone is sufficient to explain the predominance of the data, and that the contribution from direct NOE mechanism may be minimal.
To further validate the steady-state analytical solution, numerically simulated Z-spectra data were created and analyzed for different exchange regimes ranging from k𝑒𝑤 ≈|𝜎𝑎𝑒| to k𝑒𝑤 >>|𝜎𝑎𝑒|. Numerical simulations for the three-pool model agree with the steady state analytical results (Figure 2).
Discussion & Conclusion
The predominant mechanism underlying aliphatic signals in Z-spectra of mobile carbohydrate polymers is intramolecular relayed NOE (rNOE) transfer followed by proton exchange. The analytical solution from rNOE model is in good agreement with experimental data for glycogen, and is further validated by numerical simulations. The presented analytical solution is useful for quantitative assessment of rNOE signal in CEST experiments.Acknowledgements
No acknowledgement found.References
1 Zhou, Y. et al. Magnetic resonance imaging of glycogen using its magnetic coupling with water. Proceedings of the National Academy of Sciences 117, 3144-3149 (2020).
2 Chen, W., Avison, M. J., Zhu, X. H. & Shulman, R. G. NMR studies of proton NOEs in glycogen. Biochemistry32, 11483-11487 (1993).
3 Ling, W., Regatte, R. R., Navon, G. & Jerschow, A. Assessment of glycosaminoglycan concentration in vivo by chemical exchange-dependent saturation transfer (gagCEST). Proceedings of the National Academy of Sciences105, 2266-2270 (2008).
4 Liepinsh, E. & Otting, G. Proton exchange rates from amino acid side chains—implications for image contrast. Magnetic Resonance in Medicine 35, 30-42 (1996).
5 Eliav, U. & Navon, G. Multiple quantum filtered NMR studies of the interaction between collagen and water in the tendon. Journal of the American Chemical Society 124, 3125-3132 (2002).
Figures