2849
Towards an Unbiased Brain Template of Fiber Orientation Distribution Using Multimodal Registration1School of Biomedical Engineering, The University of Sydney, Sydney, Australia
Synopsis
Building a brain template of fiber orientation distribution (FOD) with Diffusion MRI is crucial for population study and disease research on white matter. The population template and “Fixel” based analysis pipeline is increasingly being used for group-wise statistics. The template generated based solely on symmetric diffeomorphic registration of FOD depicts the group-consistent major fiber bundles; however, spatial specificity is far from optimal in regions near cortical gray matter. In this work, we explore the possibility to leverage the complementary information from T1, T2 and Diffusion MRI and build an unbiased human brain FOD template with multimodal registration method.
Introduction
Multimodal MRI provides complementary information about brain structure. T1- and T2-weighted MRI depict fine details of the cortex and subcortical grey matter, while diffusion MRI (dMRI) grants us insight of white matter microstructure, especially the fiber orientation distribution (FOD). Population templates of single modal neuroimage have been widely used as references for statistical analysis, e.g., a large body of work about gray matter analysis and functional analysis are based on normalization to MNI T1 and T2 templates1. For quantitative white matter analysis, a well-defined FOD template is essential. The pipeline of FOD registration and population template construction from MRtrix2 has been a big success; however, the spatial specificity of the template is accurate on major fiber bundles at the core white matter, but lacks specificity near cortical gray matter, severely limiting its utility. Here, we propose to use multimodal data, including T1, T2 and dMRI to improve the registration and build an unbiased FOD template, which optimize spatial specificity of all brain structures.Method
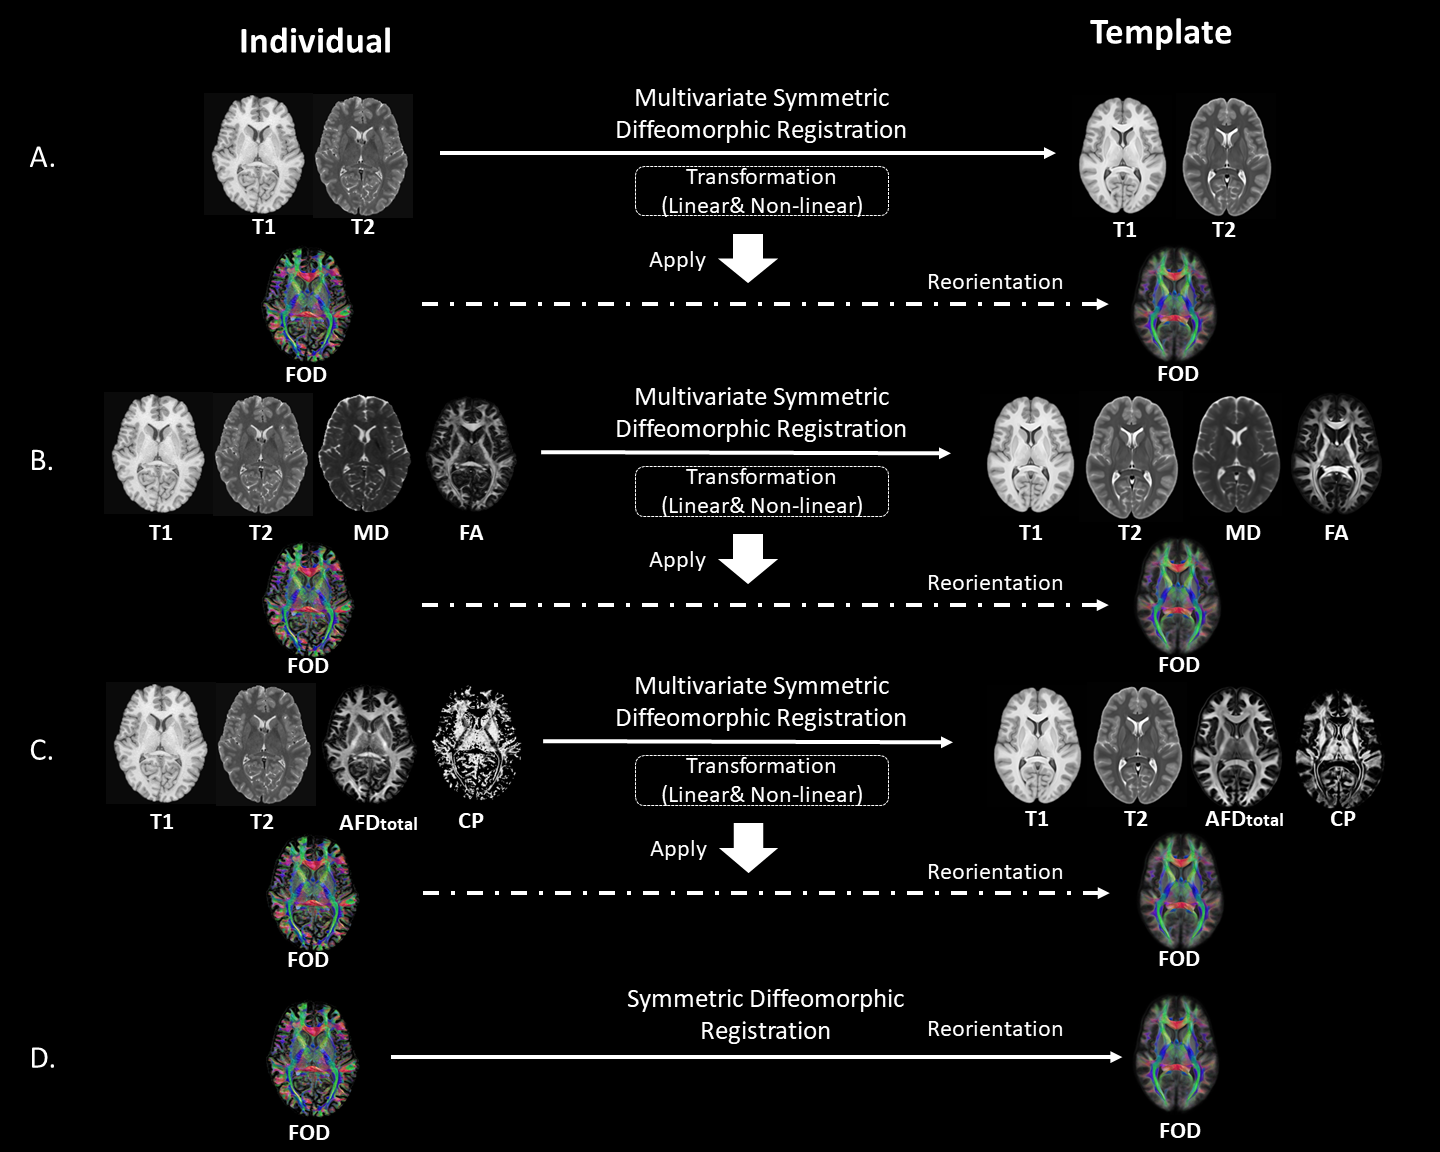
We used the multivariate symmetric group-wise normalization 3 method implemented in ANTS (https://github.com/ANTsX/ANTs) to generate multimodal templates from a group of subjects as shown in Fig.1A-C, Specifically, we use T1, T2 images and feature images derived from dMRI as multi-channels for registration3,4. The transformation combining information from all channels are used to warp the FOD into template space. Following reorientation 2, the FOD images are averaged across subjects to generate the FOD template. In Method A, we used only T1 and T2 images for template generation. While in Method B we added features of mean diffusivity (MD) and fractional anisotropy (FA) calculated with dMRI from the conventional tensor model. In Method C, the “Fixel”5 based features of total apparent fiber density (AFDtotal) and fiber complexity (CP)6 were combined with T1 and T2 to improve the template. These templates are compared with the single-modal FOD-based registration method 2(Fig.1D).To evaluate the four FOD templates, we calculate the average individual-template difference with three metrics: 1) root-mean-square (RMS) difference of spherical harmonics; 2) Angular correlation7; 3) Angular error of the top 3 peaks (Amplitude>0.1) 2.
T1, T2, and dMRI data of the randomly selected fifty subjects from the Human Connectome Project 8 were used to generate the four FOD templates and for template evaluation.
Results
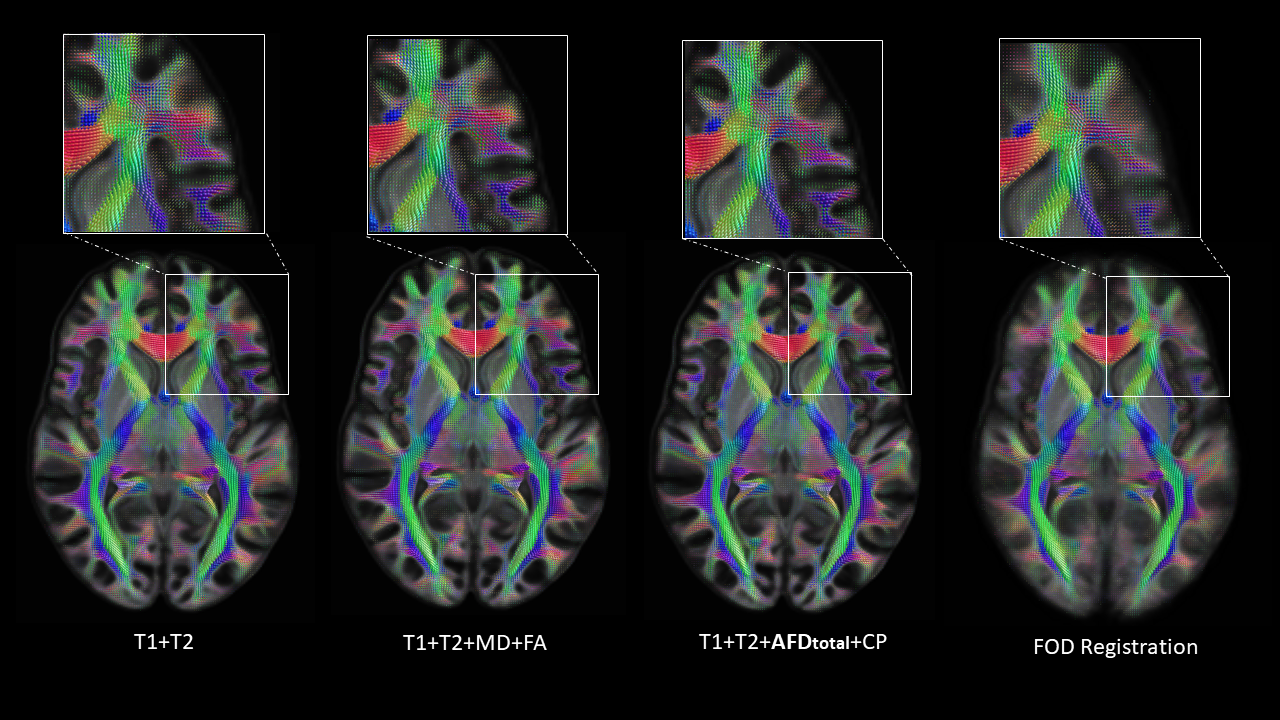
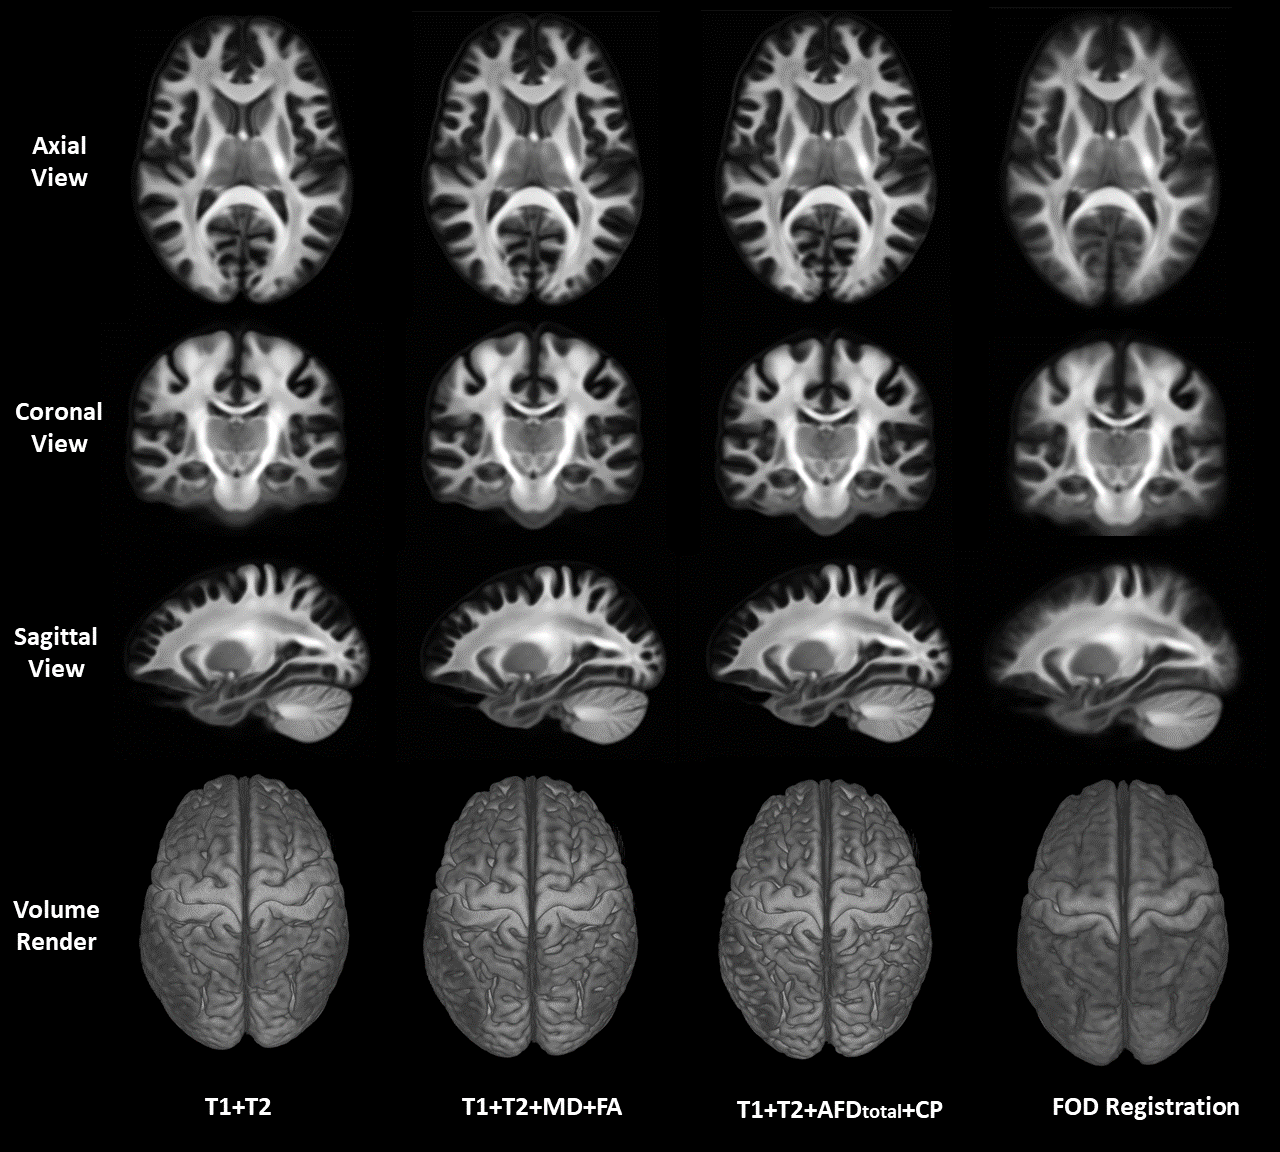
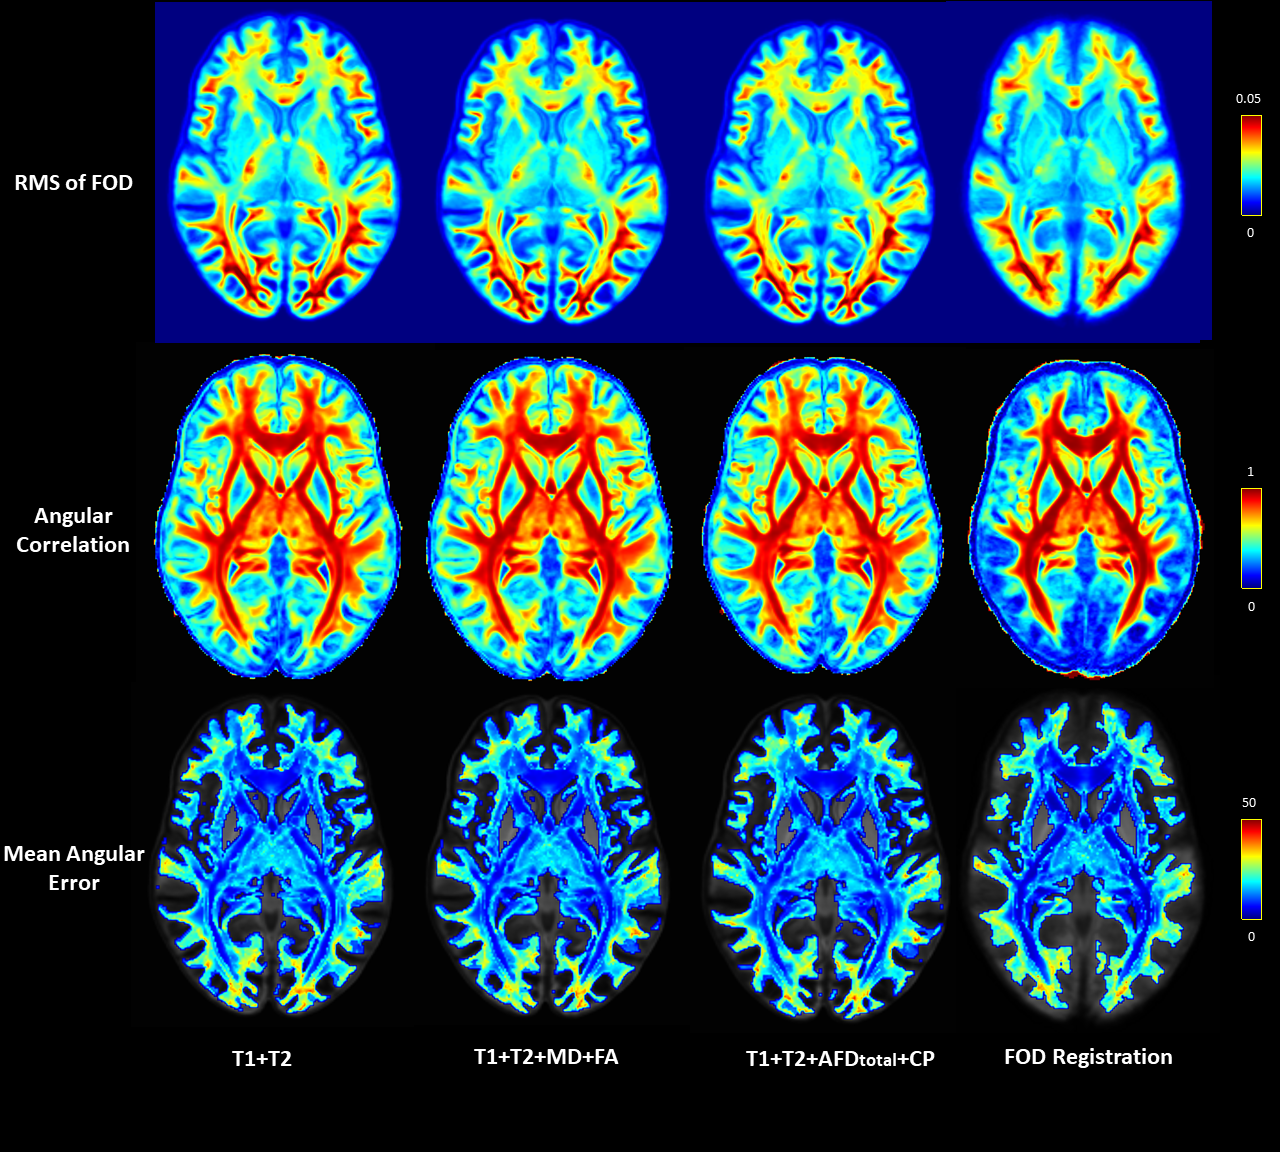
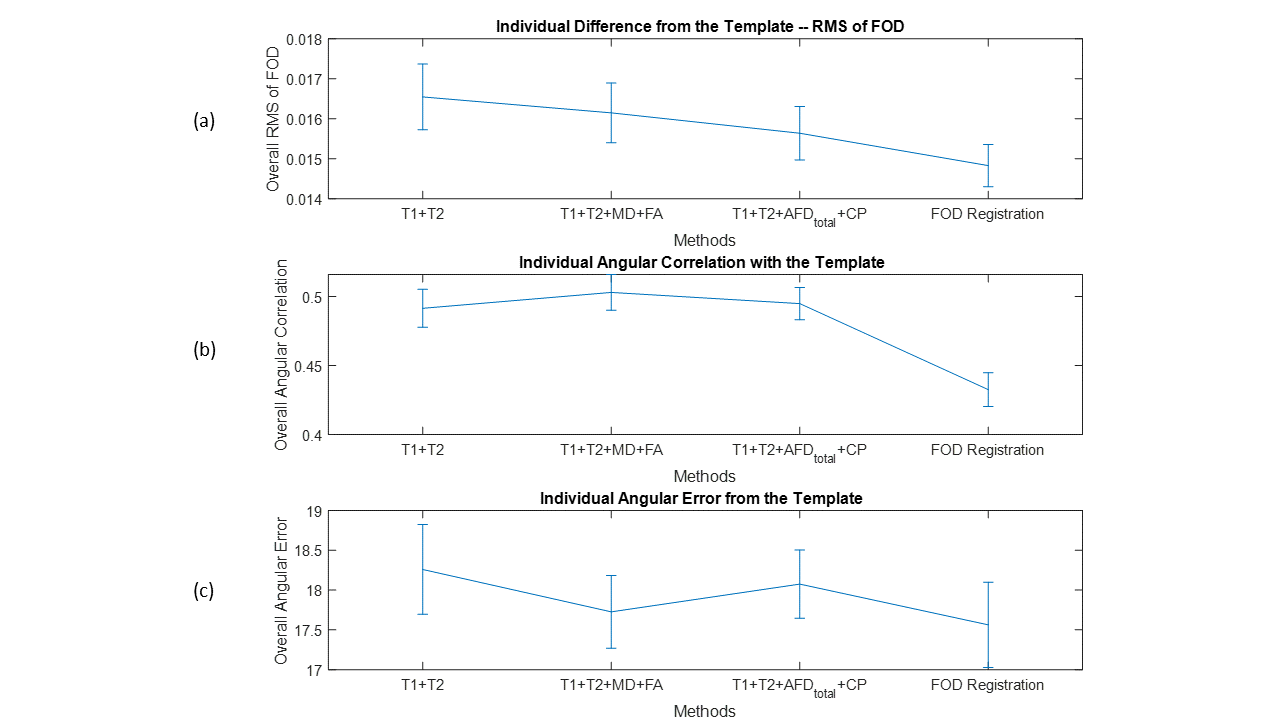
We qualitatively show a cross-section of the four FOD templates in Fig.2, overlayed on the L0 volume. FOD templates generated with the multimodal methods clearly preserve the gyrus and sulcus geometry and provide much higher spatial specificity about the near-cortex white matter than the FOD-based template. As highlighted in the white box, the multimodal methods also perform well at crossing fiber zones. We further visualized the L0 volume at Fig.3. It is evidential that the multimodal methods deliver sharp contrast on white-matter-gray-matter boundaries, in subcortical structures, like cerebellum and hippocampus, and preserve the folding patterns well.The three quantitative individual-template difference measurements were averaged across 50 subjects and visualized in Fig.4. For each subject, we also calculated the overall individual-template difference by averaging each metric across voxels within the brain mask. The average overall differences and the standard deviation are plotted in Fig.5. The FOD registration method derives the lowest overall RMS difference of FOD although at the expense of severely compromising cortical alignment. In contrast, the T1+T2 method delivered the highest overall RMS difference. Encouragingly, introducing features from dMRI helps reduce the overall RMS difference (Fig.5a), and “Fixel”-based features (AFDtotal+CP) outperforms the tensor-based features (MD+FA). In turn, FOD-based registration results in a template that had the lowest overall angular correlation with individuals (Fig.5b), but it guarantees the lowest overall angular error of top 3 peaks (amplitude>0.1). Similarly, the T1+T2 method was the worst with both angular metrics, however, introducing the dMRI features improves the angular alignment. Especially, both the T1+T2+MD+FA and T1+T2+ AFDtotal+CP methods lifts the angular correlation (Fig.5b) and suppress the angular error (Fig.5c) comparing with the T1+T2 method.
Inspecting the second row of Fig.4, we can find that the FOD registration method performs the highest angular correlation at major fiber bundles but also the worst at the near-cortex white matter, likely the reason for the lowest overall value in Fig.5b.
Conclusion
While the registration of T1 and T2 structure image guarantees alignment of cortical geometry1, it ignores the white matter microstructure due to lack of contrast. In contrast, FOD-based registration2 aligns the major fiber bundles well but compromises the spatial specificity at the near-cortex white matter. The multimodal registration could leverage the advantages of both the structure images and dMRI, optimize the transformation and thus deliver a FOD template with higher overall spatial specificity. By introducing scalar features calculated form dMRI (including FOD-based metrics), both the alignment of FOD amplitude and angular are improved, leading to a template with very good spatial specificity throughout the white matter (including near cortical boundaries). Our future work focuses on releasing a coherent pipeline for T1+T2+FOD registration and generation of the multimodal FOD template, and the assessment of the benefits it provides. We believe the unbiased multimodal templates will benefit joint gray matter and whiter matter analysis and joint structure and function analysis.Acknowledgements
No acknowledgement found.References
1. Evans, A. C., Janke, A. L., Collins, D. L. & Baillet, S. Brain templates and atlases. NeuroImage vol. 62 911–922 (2012).
2. Raffelt, D. et al. Symmetric diffeomorphic registration of fibre orientation distributions. Neuroimage 56, 1171–1180 (2011).
3. Avants, B. B., Duda, J. T., Zhang, H. & Gee, J. C. Multivariate normalization with symmetric diffeomorphisms for multivariate studies. Lect. Notes Comput. Sci. (including Subser. Lect. Notes Artif. Intell. Lect. Notes Bioinformatics) 4791 LNCS, 359–366 (2007).
4. Greene, C., Cieslak, M. & Grafton, S. T. Effect of different spatial normalization approaches on tractography and structural brain networks. Netw. Neurosci. 2, 362–380 (2018).
5. Raffelt, D. A. et al. Investigating white matter fibre density and morphology using fixel-based analysis. Neuroimage 144, 58–73 (2017).
6. Riffert, T. W., Schreiber, J., Anwander, A. & Knösche, T. R. Beyond fractional anisotropy: Extraction of bundle-specific structural metrics from crossing fiber models. Neuroimage 100, 176–191 (2014).
7. Anderson, A. W. Measurement of fiber orientation distributions using high angular resolution diffusion imaging. Magn. Reson. Med. 54, 1194–1206 (2005).
8. Van Essen, D. C. et al. The WU-Minn Human Connectome Project: An overview. Neuroimage 80, 62–79 (2013).
Figures