2846
Elaborating and Testing Activity MRI [aMRI] Diffusion Modeling1Advanced Imaging Research Center, Oregon Health & Science University, Portland, OR, United States
Synopsis
Activity MRI [aMRI] simulates diffusion-weighted data with three metabolic and cytometric tissue properties: kio (s-1), the mean steady-state cellular water efflux rate constant [measuring cellular metabolic activity], r, the cell density (cells/μL), and V (pL), the average cell volume. We explore the behavior of the aMRI model, and compare its results with pertinent experimental data. The model is well-behaved, and matches experimental data with parameter values in near absolute agreement with independent literature measurements.
Introduction
Considerable evidence has accumulated that cell membrane water permeability, expressed as the steady‑state cellular efflux rate constant [kio], has a significant contribution from cytolemmal Sodium Pump enzymatic turnover.1 The strongest evidence comes from in vitro and ex vivo model studies in which the extracellular paramagnetic contrast agent concentration, [CAo], can be made large enough for the shutter-speed to necessarily reach kio + koi, where koi is the influx rate constant. In vivo, this is more challenging, since [CAo] cannot be made large and, at the same time, koi is larger [often 4kio] than in models.1 A Monte Carlo random walk [RW] simulation of CA-free DWI data has been reported.2,3 It employs digital ensembles of randomly shaped/sized [“Voronoi”] cells characterized by realistic cell density [ρ] and average cell volume [V] values. The kio value is effectuated during the RW.2,3 Since kio reflects Na+,K+-ATPase [NKA] enzyme activity,1 this method is called activity MRI [aMRI]. We explore and test it.Results
Figure 1 shows aMRI-simulated single-diffusion-encoded [SDE] decay curves: ln[S/S0] vs. b [logarithmic ordinate scales]. Each parameter is varied alone: the others are held constant [(a) ρ = 1,200,000 cells/μL, V = 0.54 pL; (b) kio = 39 s‑1, V = 0.54 pL; (c) kio = 39 s-1, ρ = 1,200,000 cells/μL]. Diffusivity increases with increasing kio (a), and decreases with increasing ρ (b) and V (c). Importantly, sensitivity increases with larger kio values (a). Model studies4,5 find kio values exceeding 70 s‑1, far beyond the reach of in vivo CA’s [<10 s-1]. Except for pure water [ρ = 0 (b); V = 0 (c)], all Fig. 1 decays are non-linear [non-Gaussian].Each relatively featureless decay has two distinguishing properties: 1) its absolute location in b-space, and 2) its curvature. In the Kurtosis equation:6 ln(S/S0) = -bDap + b2Dap2Kap/6, the Dap and Kap parameters, respectively, measure properties 1) and 2). Figure 2 shows Kurtosis analyses of the Fig. 1 curves. Dap increases with increasing kio (a), and decreases with increasing ρ (b) and V (c), while Kap increases meaningfully [>0.8] for only kio <30 s-1 (d). The pure water Dap = 3 (μm)2/ms [37oC] and Kap = 0 [Gaussian] values [pale blue open circles] are smoothly approached as ρ (b,e) and V (c,f) vary toward zero [note the scale breaks]. kio is the main influencer of curvature, and only at small values. [The Kurtosis equation does not match the more highly curved decays well.]
How does aMRI fare upon encountering real DWI data with various noise levels? Figure 3 shows ~2% of entries [light gray curves] in a library of >4000 aMRI SDE simulations. These representative decays span most of b-space; the area between the pure water black line and the upper abscissa. Disparate experimental single voxel data are plotted from murine colorectal cancer [circles],7 and from human prostate lesion [stars] and normal-appearing [NA, triangles] tissues, brain gray matter [GM, diamonds] and bladder [squares] (our laboratory). There are library entries that match each of the data decays reasonably well: colorectal cancer [blue], prostate lesion [red], NA prostate [purple], brain GM [green], and bladder [black; pure water].
An aMRI strength is that its’ parameters are real quantities [with units], and thus have the potential to be independently, absolutely verified. Particularly ρ and V can be estimated from ex vivo histopathology results. Figure 4 shows a tabulation of the Fig. 3 colored curve parameters along with the most pertinent estimations from independent studies. The general agreement is encouraging. It is important to note relevant ex vivo histopathology methods [cited] are generally optimized for quantitative cell number counting. Accurate ρ and V estimations from these rely on careful tissue volume conservation in the excision and the fixing steps; not always particular goals for investigators. These steps can alter tissue volumes.19 MRI is inherently a volume-based method.
Discussion
aMRI shows promise for non-invasive measuring, and mapping, kio values not previously accessible in vivo – giving high-resolution MRI a new metabolic dimension. Moreover, cytometric ρ and V maps, necessarily obtained with the kio maps, may themselves be quite diagnostic. There is significant interest in producing ex vivo quantitative cytometric atlases20 useful for research. Analogous in vivo ρ and V maps may find important clinical utility.Acknowledgements
We thank the Brenden-Colson Center for Pancreatic Care for support. We thank Professor Martin Pike for stimulating discussions.References
Li X, Mangia S, Lee J-H, Bai R, Springer CS, “NMR Shutter-Speed Elucidates Apparent Population Inversion of 1H2O Signals Due to Active Transmembrane Water Cycling,” Magn. Reson. Med. 2019; 82: 411-424. [DOI: 10.1002/mrm.27725]
Baker, EM, Moloney B, Li X, Gilbert EW, Springer CS. “Random Walks in Stochastic Geometries.” Proc. Int. Soc. Magn. Reson. Med. 2019; 27: 3612.
Moloney B, Baker EM, Li X, Gilbert EW, Springer CS. “Fundamental cell biology properties underlying in vivo DWI.” Proc. Int. Soc. Magn. Reson. Med. (2020) 28: 4506.
Ruggiero MR, Baroni S, Pezzana S, Ferrante G, Crich SG, Aime S. “Evidence for the Role of Intracellular Water Lifetime as a Tumor Biomarker Obtained by In Vivo Field-Cycling Relaxometry.” Angew. Chem. Int. Ed. Engl. 2018a; 57: 7468-7472. [DOI: 10.1002/anie.201713318]
Ruggiero MR, Baroni S, Aime S, Crich SG. “Relaxometric Investigations Addressing the Determination of Intracellular Water Lifetime: A Novel Tumor Biomarker of General Applicability.” Mol. Phys. 2018b. [doi.org/10.1080/00268976.2018.1527045]
Jensen JH, Helpern JA, Ramani A, Lu H, Kaczynski K. “Diffusional kurtosis imaging: The quantification of non-Gaussian water diffusion by means of MRI.” Magn. Reson. Med. (2005); 53: 1432-1440.
Jiang X, Li H, Xie J, McKinley E T, Zhao P, Gore J C, Xu J. In Vivo Imaging of Cancer Cell Size and Cellularity Using Temporal Diffusion Spectroscopy. MRM 2017; 78: 156-164.
Reynolds H, Williams S, Zhang A, Ong CS, Rawlinson D, Chakravorty R, Mitchell C, Haworth A. “Measuring cell density in prostate cancer imaging as an input for radiotherapy treatment planning.” EPOS (2014a) R‑0262. [DOI: 10.1594/ranzcr2014/R-0262]
Tzur A, Kafri R, Le Bleu VS, Laher G, Kirchner MW. “Cell Growth and Size Homeostasis in Proliferating Animal Cells.” Science 2009; 325: 167-171.
Yuan Y, Failmezger H, Rueda OM, Ali HR, Graf S, Chin S-F, Schwarz RF, Curtis C, Dunning MJ, Bardwell H, Johnson N, Doyle S, Turashvili G, Provenzano E, Aparicio S, Caldas C, Markowetz F. “Quantitative Image Analysis of Cellular Heterogeneity in Breast Tumors Complements Genomic Profiling.” Sci. Trans. Med. 2012; 4: 157ra143.
Model MA, Schonbrun E. “Optical determination of intracellular water in apoptotic cells.” J. Physiol. (2013) 591.23: 5843-5849.
Li X, Priest RA, Woodward WJ, Siddiqui F, Beer TM, Garzotto MG, Rooney WD, Springer CS. “Cell Membrane Water Exchange Effects in Prostate DCE-MRI.” J. Magn. Reson. 2012; 218: 77-85.
Collins CE, Turner EC, Sawyer EK, Reed JL, Young NA, Flaherty DK, Kaas JH. “Cortical cell and neuron density estimates in one chimpanzee hemisphere.” Proc. Nat. Acad. Sci. 2016; 113: 740-745.
Azevedo FAC, Carvalho LRB, Grinberg LT, Farfel JM, Feretti REL, Leite REP, Filho WJ, Lent R, Herculano‑Houzel S. “Equal numbers of neuronal and nonneruonal cells make the human brain an isometrically scaled-up primate brain.” J. Compar. Neurolog. (2009) 513: 532-541.
Andrew RD, Labron MW, Boehnke SE, Canduff L, Kirov SA. “Physiological evidence that pyramidal neurons lack functional water channels.” Cerebr. Cortex (2017) 17: 787-802.
Quirk, JD, Bretthorst GL, Duong TQ, Snyder AZ, Springer CS, Ackerman JJH, Neil JJ. “Equilibrium Water Exchange Between the Intra- and Extracellular Spaces of Mammalian Brain.” Magn. Reson. Med. 2003; 50: 493‑499.
Bai R, Springer CS, Plenz D, Basser PJ. “Fast, Na+/K+ Pump Driven, Steady-State Transcytolemmal Water Exchange Found in Neuronal Tissue: A Study of Rat Brain Cortical Cultures.” Magn. Reson. Med. 2018; 79: 3207‑3217. [DOI:10.1002/mrm.26980]
Bai R, Springer CS, Plenz D, Basser PJ. “Brain Active Trans-Membrane Water Cycling Measured by MR is Associated with Neuronal Activity.” Magn. Reson. Med. 2019; 81: 1280-1295. [DOI:10.1002/mrm.27473]
Pallotto M, Watkins PV, Fubara B, Singer JH, Briggman KL. “Extracellular space preservation aids the connectomic analysis of neural circuits.” eLife (2015) 4: e08206. [DOI: 10.7554/eLife.08206]
Attili SM, Silva MRM, Nguyen T-v, Ascoli GA. “Cell numbers, distribution, shape, and regional variation throughout the murine hippocampal formation from the adult brain Allen Reference Atlas.” Brain Struct. Funct. (2019) 224: 2883-2897.
Figures

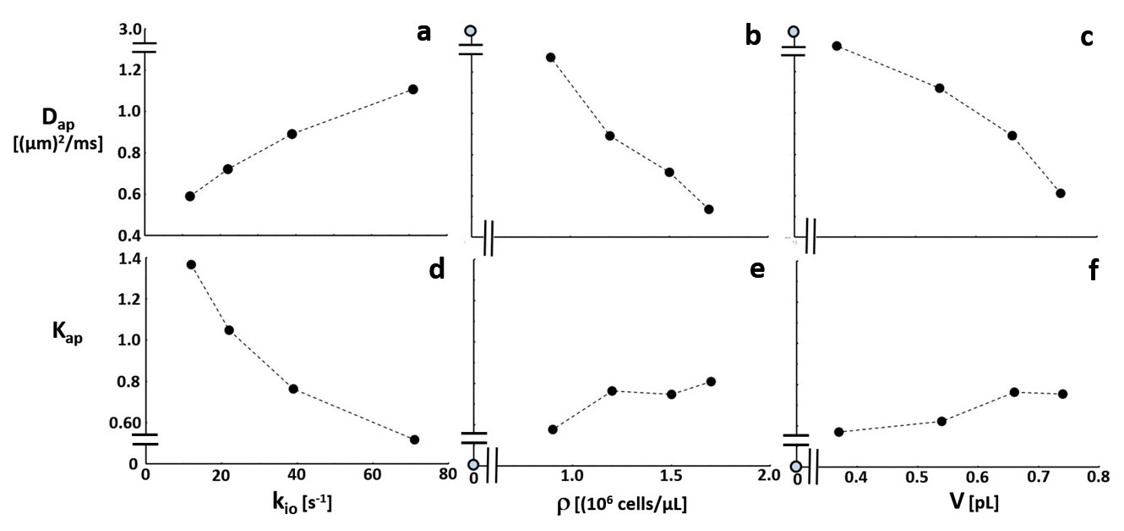
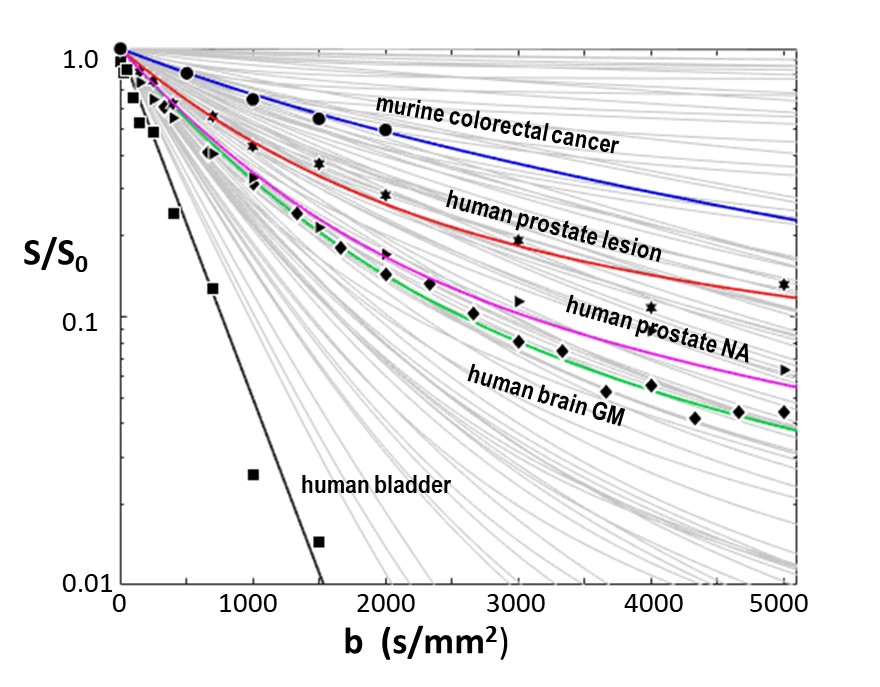
Figure 3. The light gray curves comprise samples of an aMRI library of >4000 simulated SDE b-space decays. Experimental data from murine colorectal tumor (circles),7 human prostate lesion (stars) and NA tissue (triangles), brain GM (diamonds), and bladder (squares) single voxels are shown. Different aMRI model kio, r, and V parameter sets produce the colored library simulated curves matching the disparate data. More importantly, the model parameters for each curve are in generally good agreement with measures from independent ex vivo studies of these tissues (Figure 4).
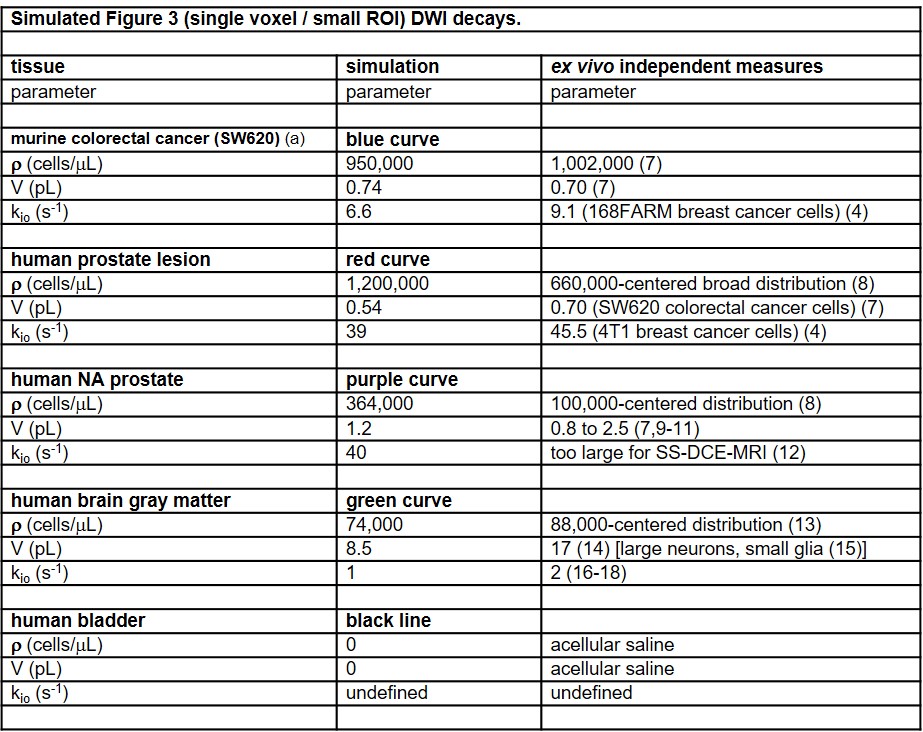
Figure 4. The aMRI parameter sets from the Fig. 3 colored data-matching library curves are given, with color-coding, in the middle column. Pertinent, independent literature ex vivo measurements are given in the right column. r and V measures are estimated from histopathology results, kio from model studies. The general absolute agreement is encouraging.