2844
A kinetic model to quantify 2-hydroxyglutarate when using hyperpolarized [1-13C]Α-ketoglutarate to detect mutant IDH1 in low grade gliomas1Department of Radiology, University of California San Francisco, San Francisco, CA, United States
Synopsis
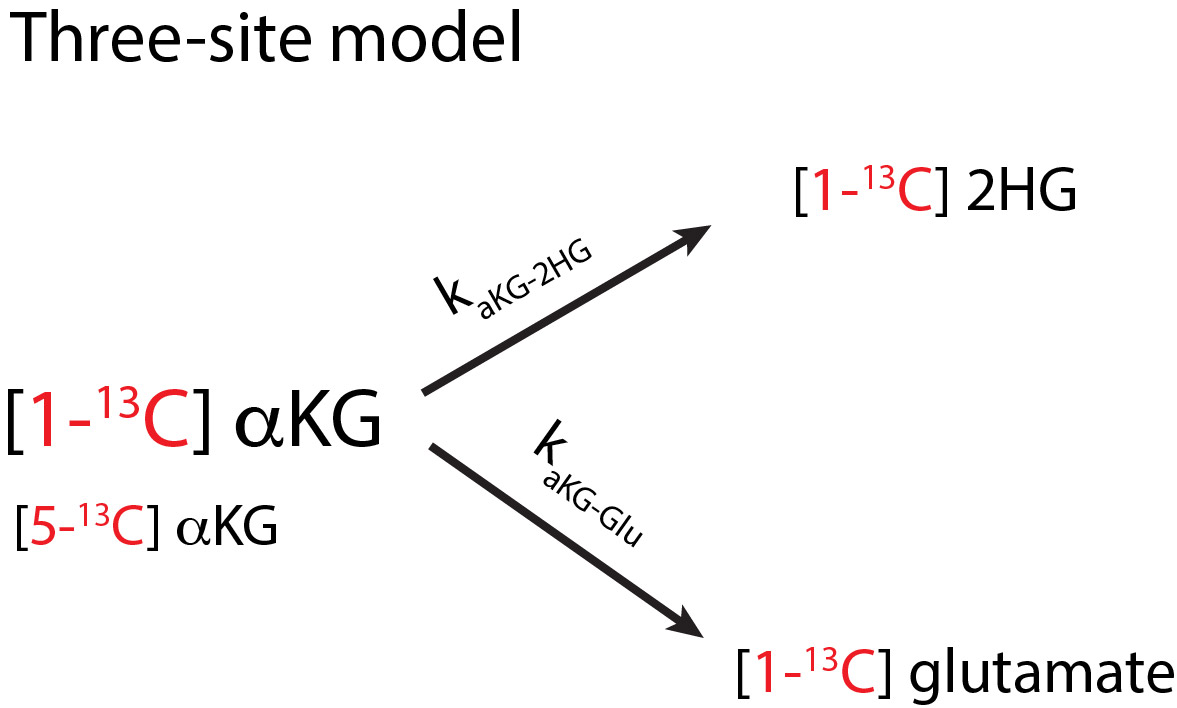
We introduce a kinetic modeling framework to detect glutamate and 2-hydroxyglutarate (2HG) production from hyperpolarized [1-13C]alpha-ketoglutarate (C1aKG). Detection of 2HG in vivo is often confounded with [5-13C]alpha-ketoglutarate (C5aKG), a natural abundance peak. We employ the model, based on the solution to differential equations of a three-site model, to separately detect 2HG from C5aKG. To test the model, we used cell lysate data where separate signal peaks of 2HG and C5aKG were experimentally measured. Cases with inputs of 2HG alone, 2HG+C5aKG, and C5aKG alone were evaluated to validate the model.
PURPOSE:
Metabolic conversion of hyperpolarized [1-13C] alpha-ketoglutarate (C1aKG) to 2-hydroxyglutarate (2HG) is useful for detecting mutant isocitrate dehydrogenase 1 (IDH1) status of low grade gliomas (1). Changes in flux of C1aKG to glutamate and 2HG can be used as markers for response to treatment (2). The detected spectrum of 2HG production is often contaminated with [5-13C] alpha-ketoglutarate (C5aKG), which is naturally occurring in the C1aKG substrate. The similar chemical shifts of 2HG and C5aKG, both approximately at 184 ppm, make it difficult to detect and quantify the production of 2HG in vivo (1). In this work, we apply a kinetic modeling framework to separate the product from C5aKG and quantify conversion to 2HG. We also compute the metabolic conversion rates of aKG to 2HG (kaKG-2HG) and glutamate (kaKG-Glu), which could be used to monitor treatment response and aggressiveness of the tumor.METHODS:
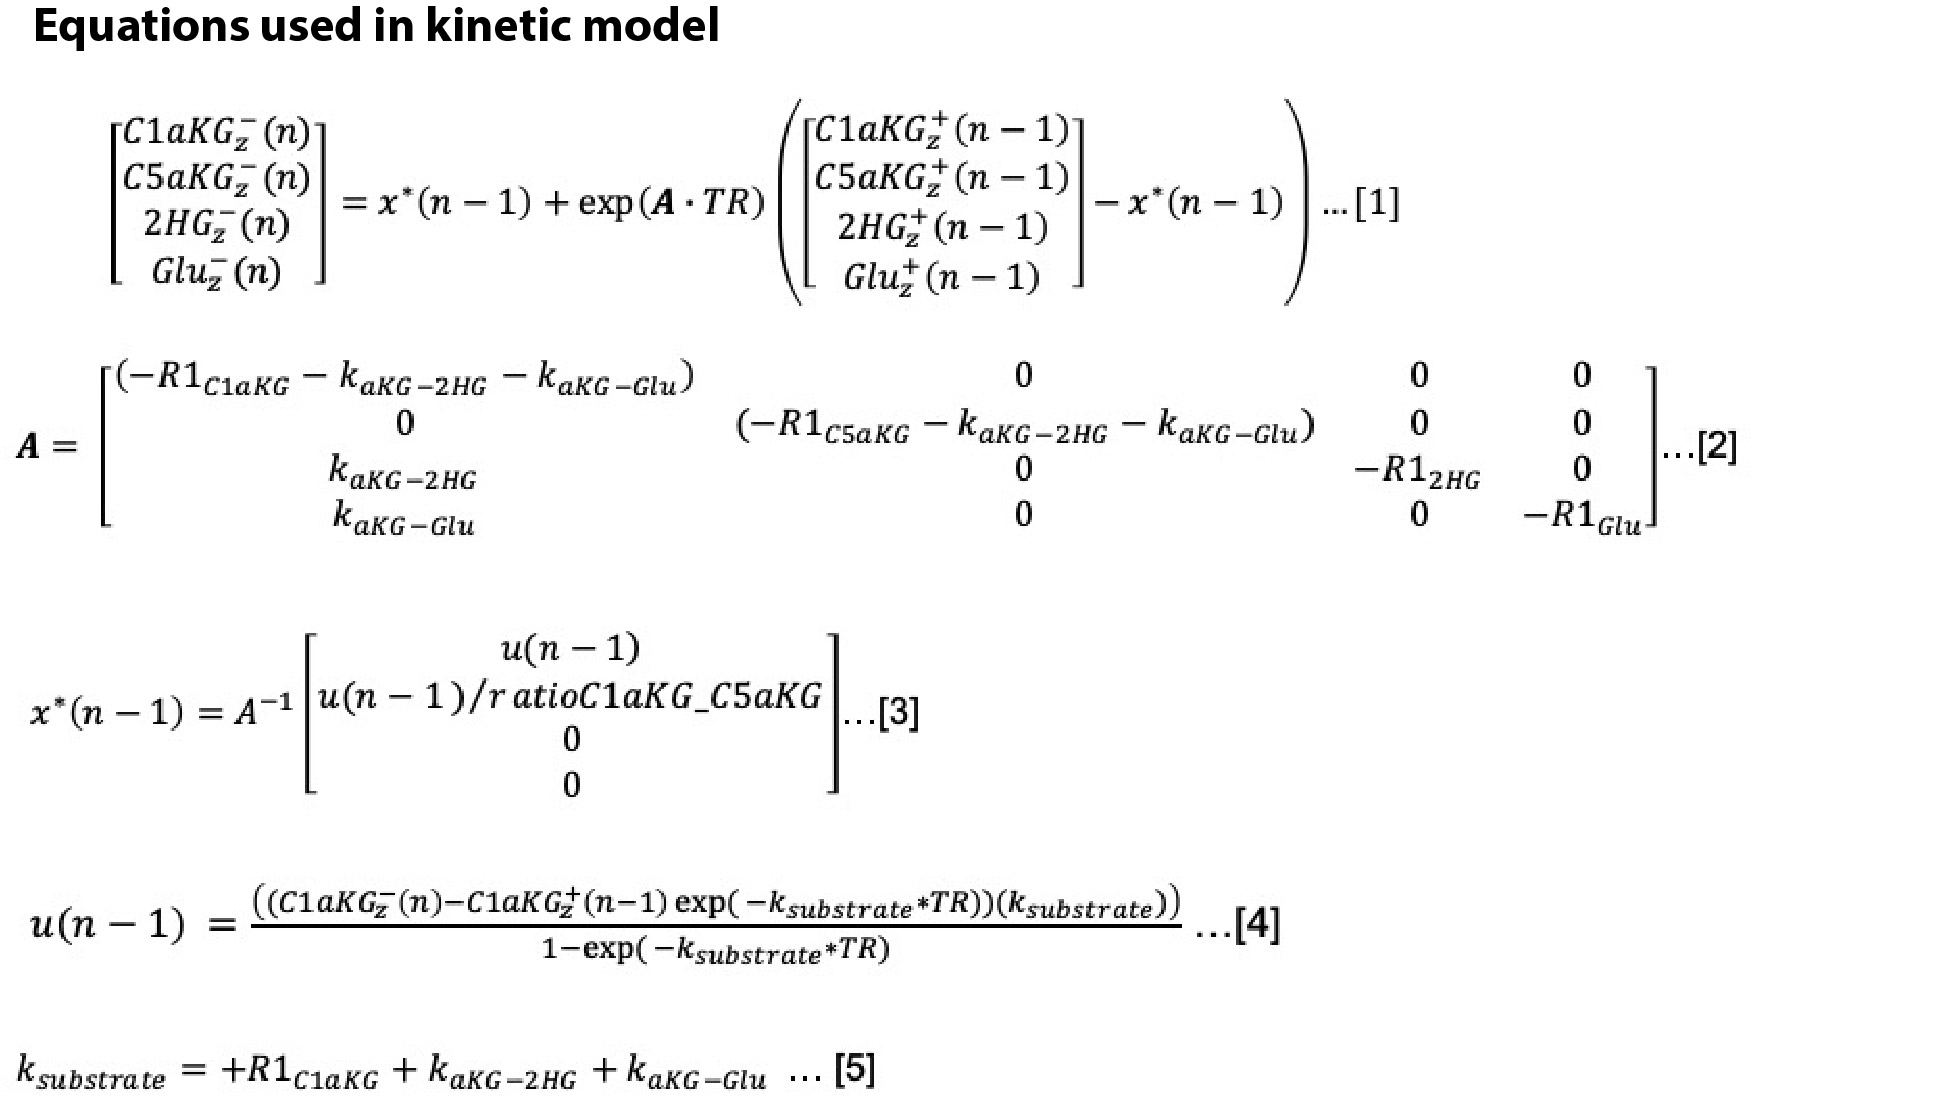
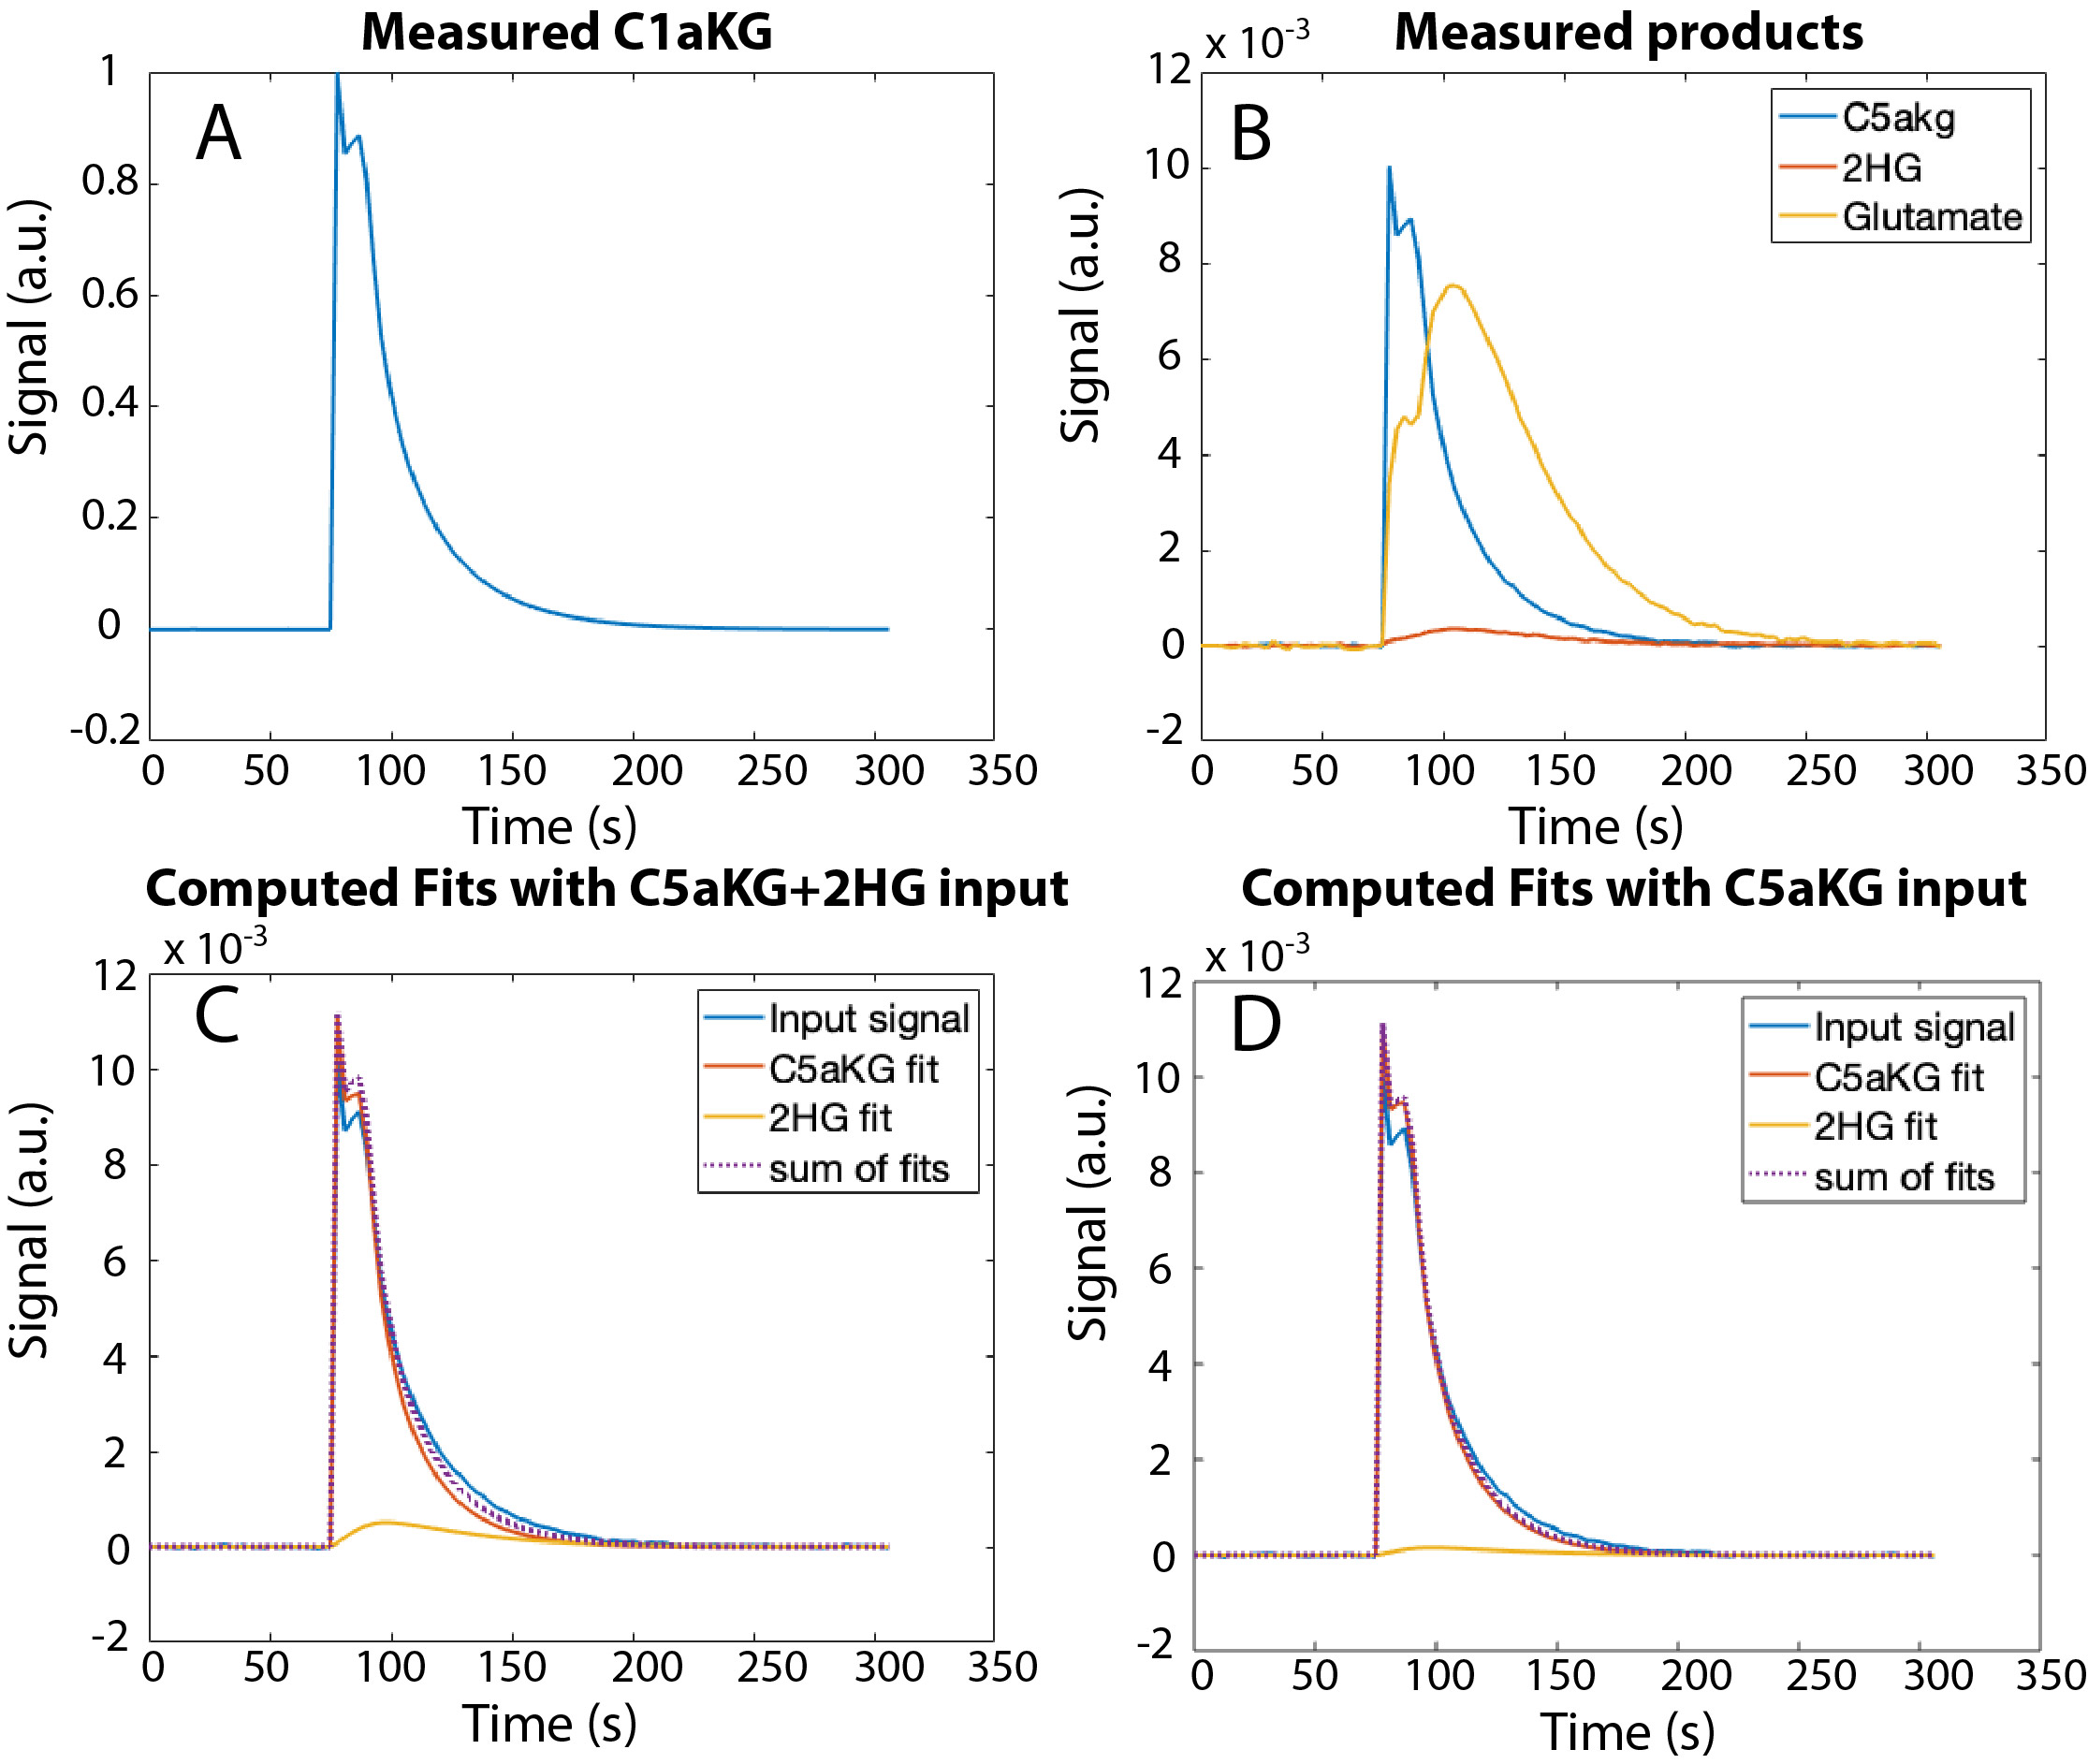
Kinetic model: For the three-site model shown in Fig 1, a kinetic model (3) was adapted to quantify magnetization of products, namely 2HG and glutamate, and determine the metabolic conversion rates. The estimated product magnetization at each time point was simulated based on the measured substrate magnetization at adjacent timepoints and the estimated product magnetization at the previous time point. The fitted values were solved based on a minimization of the least-squares error between the measured and the estimated product magnetization using a constrained, nonlinear least-squares solver in MATLAB. To separate 2HG from the C5aKG, individual metabolites were first estimated based on the solution to the differential equations (Fig 2), which include estimated and fixed parameters: T1 values, flip angles, C1aKG to C5aKG ratio, TR, starting magnetization values, and metabolic conversion rates. The added signal of simulated 2HG and C5aKG was then fitted to the measured product magnetization by iteratively adjusting estimated parameters.Cell lysate data: To validate the overlapped fitting method, we used cell lysate data (2). Greater B0 homogeneity for cell lysates and chemical shift at the high field strength allowed for detection of separate product peaks of 2HG and C5aKG. 13C spectra were acquired using an 11.7 T spectrometer (Agilent Technologies, USA) with flipangle = 13°, TR = 3s, scans = 100. The data was normalized to the cell number and the maximum substrate signal. The following cases were evaluated:
Overlapped fitting method: computes separate fits of both 2HG and C5aKG for the following inputs.
1) 2HG + C5aKG
2) C5aKG with no 2HG
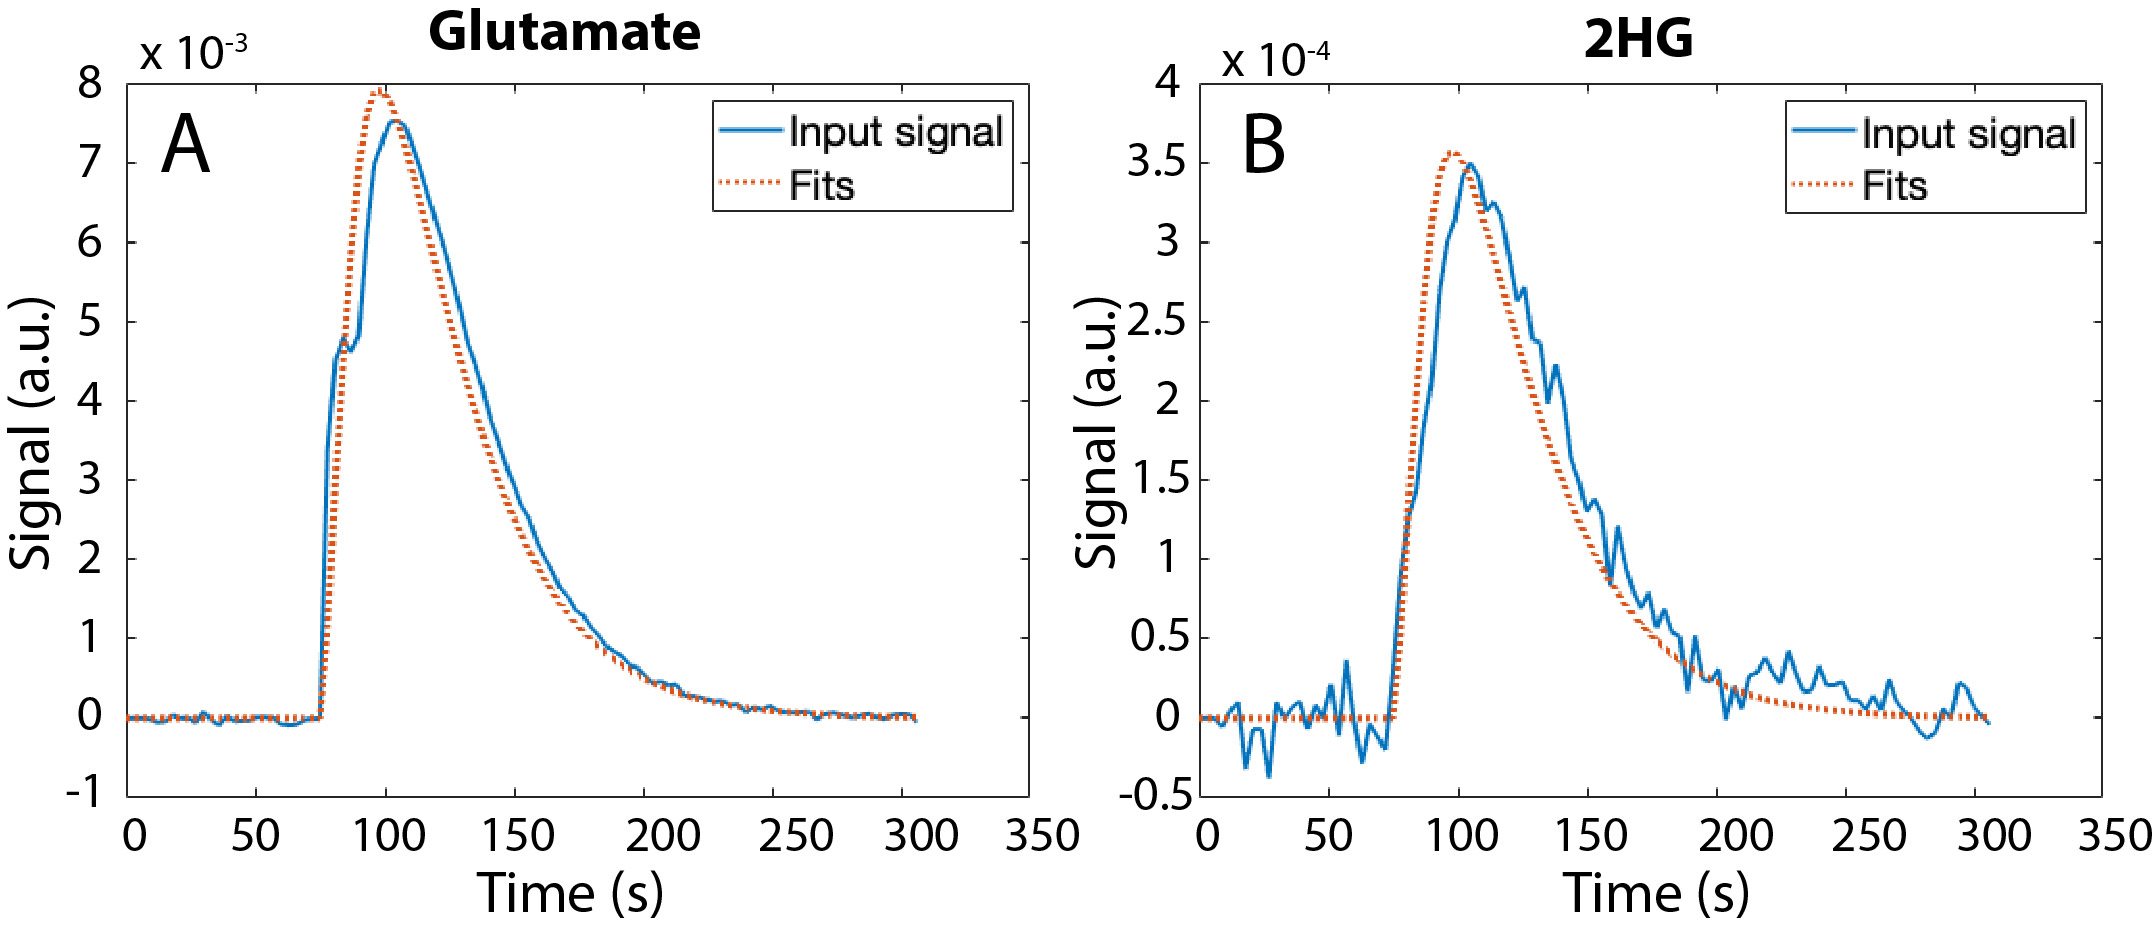
Conventional fitting method: computes the fit of a product from the experimentally measured product signal.
1) 2HG alone
2) Glutamate
RESULTS:
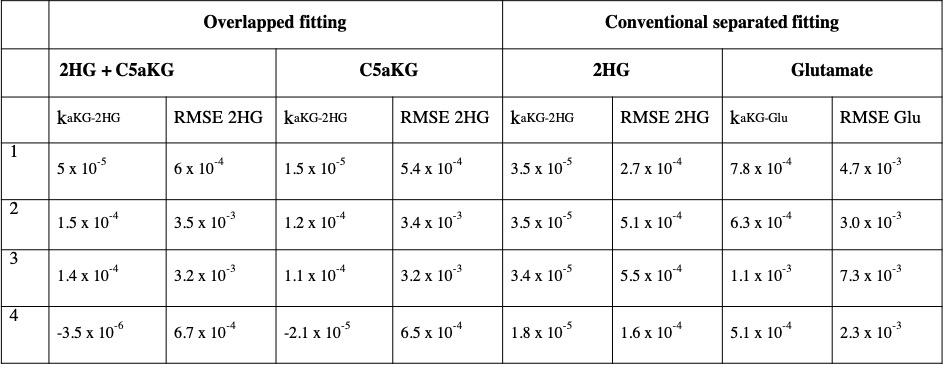
For the overlapped fitting method, the model was able to detect 2HG separately from the combined input (Fig 3C). Lower 2HG was detected for an input of C5aKG alone (Fig 3D), although no detection of 2HG would be expected for this case. The case where 2HG alone was used as input, with the conventional fitting method (Fig 4B), provided the best fit and consistent kinetic rates (Table 1). This served as the ground truth for other computations.DISCUSSION and CONCLUSIONS:
Our work demonstrates the feasibility of quantifying products and metabolic conversion rates of glutamate and 2HG production from C1aKG. In particular, the kinetic model was able to detect 2HG from naturally occurring C5aKG. Cell lysate data, which contained distinguishable signal peaks of all products, were used to test whether the model could detect the presence or absence of 2HG from an input of either C5aKG+2HG or C5aKG alone. Although the computed 2HG values reduced when measured signal of C5aKG alone was used as input, the model overestimated 2HG for most datasets. Consistent values of kaKG-2HG for the first three datasets, and low RMSE values for all datasets for the case when 2HG alone was used as input, suggested that the model performed well when using the conventional fitting method. While this served as a ground truth for other cases, 2HG measured signal cannot be distinguished from naturally occurring C5aKG in vivo based on ratio between C1aKG and C5aKG alone. In particular, using metabolite-specific, variable flip angle scheme in vivo to improve SNR (4) can differentially deplete magnetization for the various metabolites and 13C locations, which could make the fitting more challenging. Future work includes modifying estimated parameters and assumptions in the model to fully optimize the kinetic model, and implementing the model for data acquired in vivo.Acknowledgements
This work was supported by NIH Training Grant T32CA151022 and American Cancer Society Research Scholar Grant 18-005-01-CCEReferences
1. Chaumeil MM, Larson PEZ, Yoshihara HAI, Danforth OM, Vigneron DB, Nelson SJ, Pieper RO, Philips JJ, Ronen SM. Non-invasive in vivo assessment of IDH1 mutational status in glioma. Nat. Commun. 2013; 4:2429.
2. Molloy AR, Najac C, Viswanath P, Lakhani A, Subramani E, Batsios G, Radoul M, Gillespie AM, Pieper RO, Ronen SM. MR-detectable metabolic biomarkers of response to mutant IDH inhibition in low-grade glioma. Theranostics 2020; 10:19.
3. Larson PEZ, Chen HY, Gordon JW, Korn N, Maidens J, Arcak M, Tang S, Criekinge M, Carvajal L, Mammoli D, Bok R, Aggarwal R, Ferrone M, Slater JB, Nelson SJ, Kurhanewicz J, Vigneron DB. Investigation of analysis methods for hyperpolarized 13C-pyruvate metabolic MRI in prostate cancer patients. NMR Biomed. 2018; 31:11.
4. Hong D, Batsios G, Viswanath P, Gillespie AM, Vaidya M, Larson PEZ, Ronen SM. Acquisition and quantification pipeline for in vivo hyperpolarized 13C magnetic resonance spectroscopy. In preparation, 2020.
Figures