2843
Time Dependency of the Continuous-Time Random-Walk Diffusion Model at Long Diffusion Times in the Human Brain1Center for MR Research, University of Illinois at Chicago, Chicago, IL, United States, 2Department of Bioengineering, University of Illinois at Chicago, Chicago, IL, United States, 3Department of Medical Physics, University of Wisconsin-Madison, Madison, WI, United States, 4Department of Radiology, School of Medicine and Public Health, University of Wisconsin-Madison, Madison, WI, United States, 5Departments of Radiology and Neurosurgery, University of Illinois at Chicago, Chicago, IL, United States
Synopsis
It has been increasingly reported that the diffusion-weighted MRI signal depends on not only the b-value but also the diffusion time. Investigations of diffusion model parameters on diffusion time can provide information on interaction between water molecules and their environment, thus helping reveal tissue microstructures. In this study, we focused on two special cases of a continuous-time random-walk (CTRW) diffusion model; and investigated the diffusion-time dependency of the CTRW parameters in the human brain. Our results showed significant dependency of the CTRW parameters on diffusion times in the range of 100-1000 ms.
Introduction
It has been recognized that diffusion-weighted MRI (DWI) signal deviates from mono-exponential decay, particularly at high b-values (e.g., > 1500 sec/mm2 for human brain).1 Over the past two decades, several advanced diffusion models have been proposed to characterize this non-Gaussian diffusion behavior.1-6 One of these models is a continuous-time random-walk (CTRW) model,4 which provides two new parameters, fractional order time derivative α and spatial derivative β, that are related to temporal and spatial diffusion heterogeneities, respectively. In parallel to the development of non-Gaussian diffusion models, it has been increasingly recognized that diffusion parameters derived from various diffusion models exhibit dependence on diffusion time.7,8 Varying diffusion time enables exploration of the interaction between diffusing water molecules and the surrounding environment at different spatial scales,8 providing a new degree of freedom to estimate parameters that are related to the underlying tissue microstructures.9 In this study, we investigated the time dependency of the CTRW parameters on a long diffusion time regime in the human brain by employing a stimulated echo acquisition mode (STEAM)10 DWI sequence in which the diffusion time, Δ, and the associated mixing time, TM, were varied across a broad range.Theory
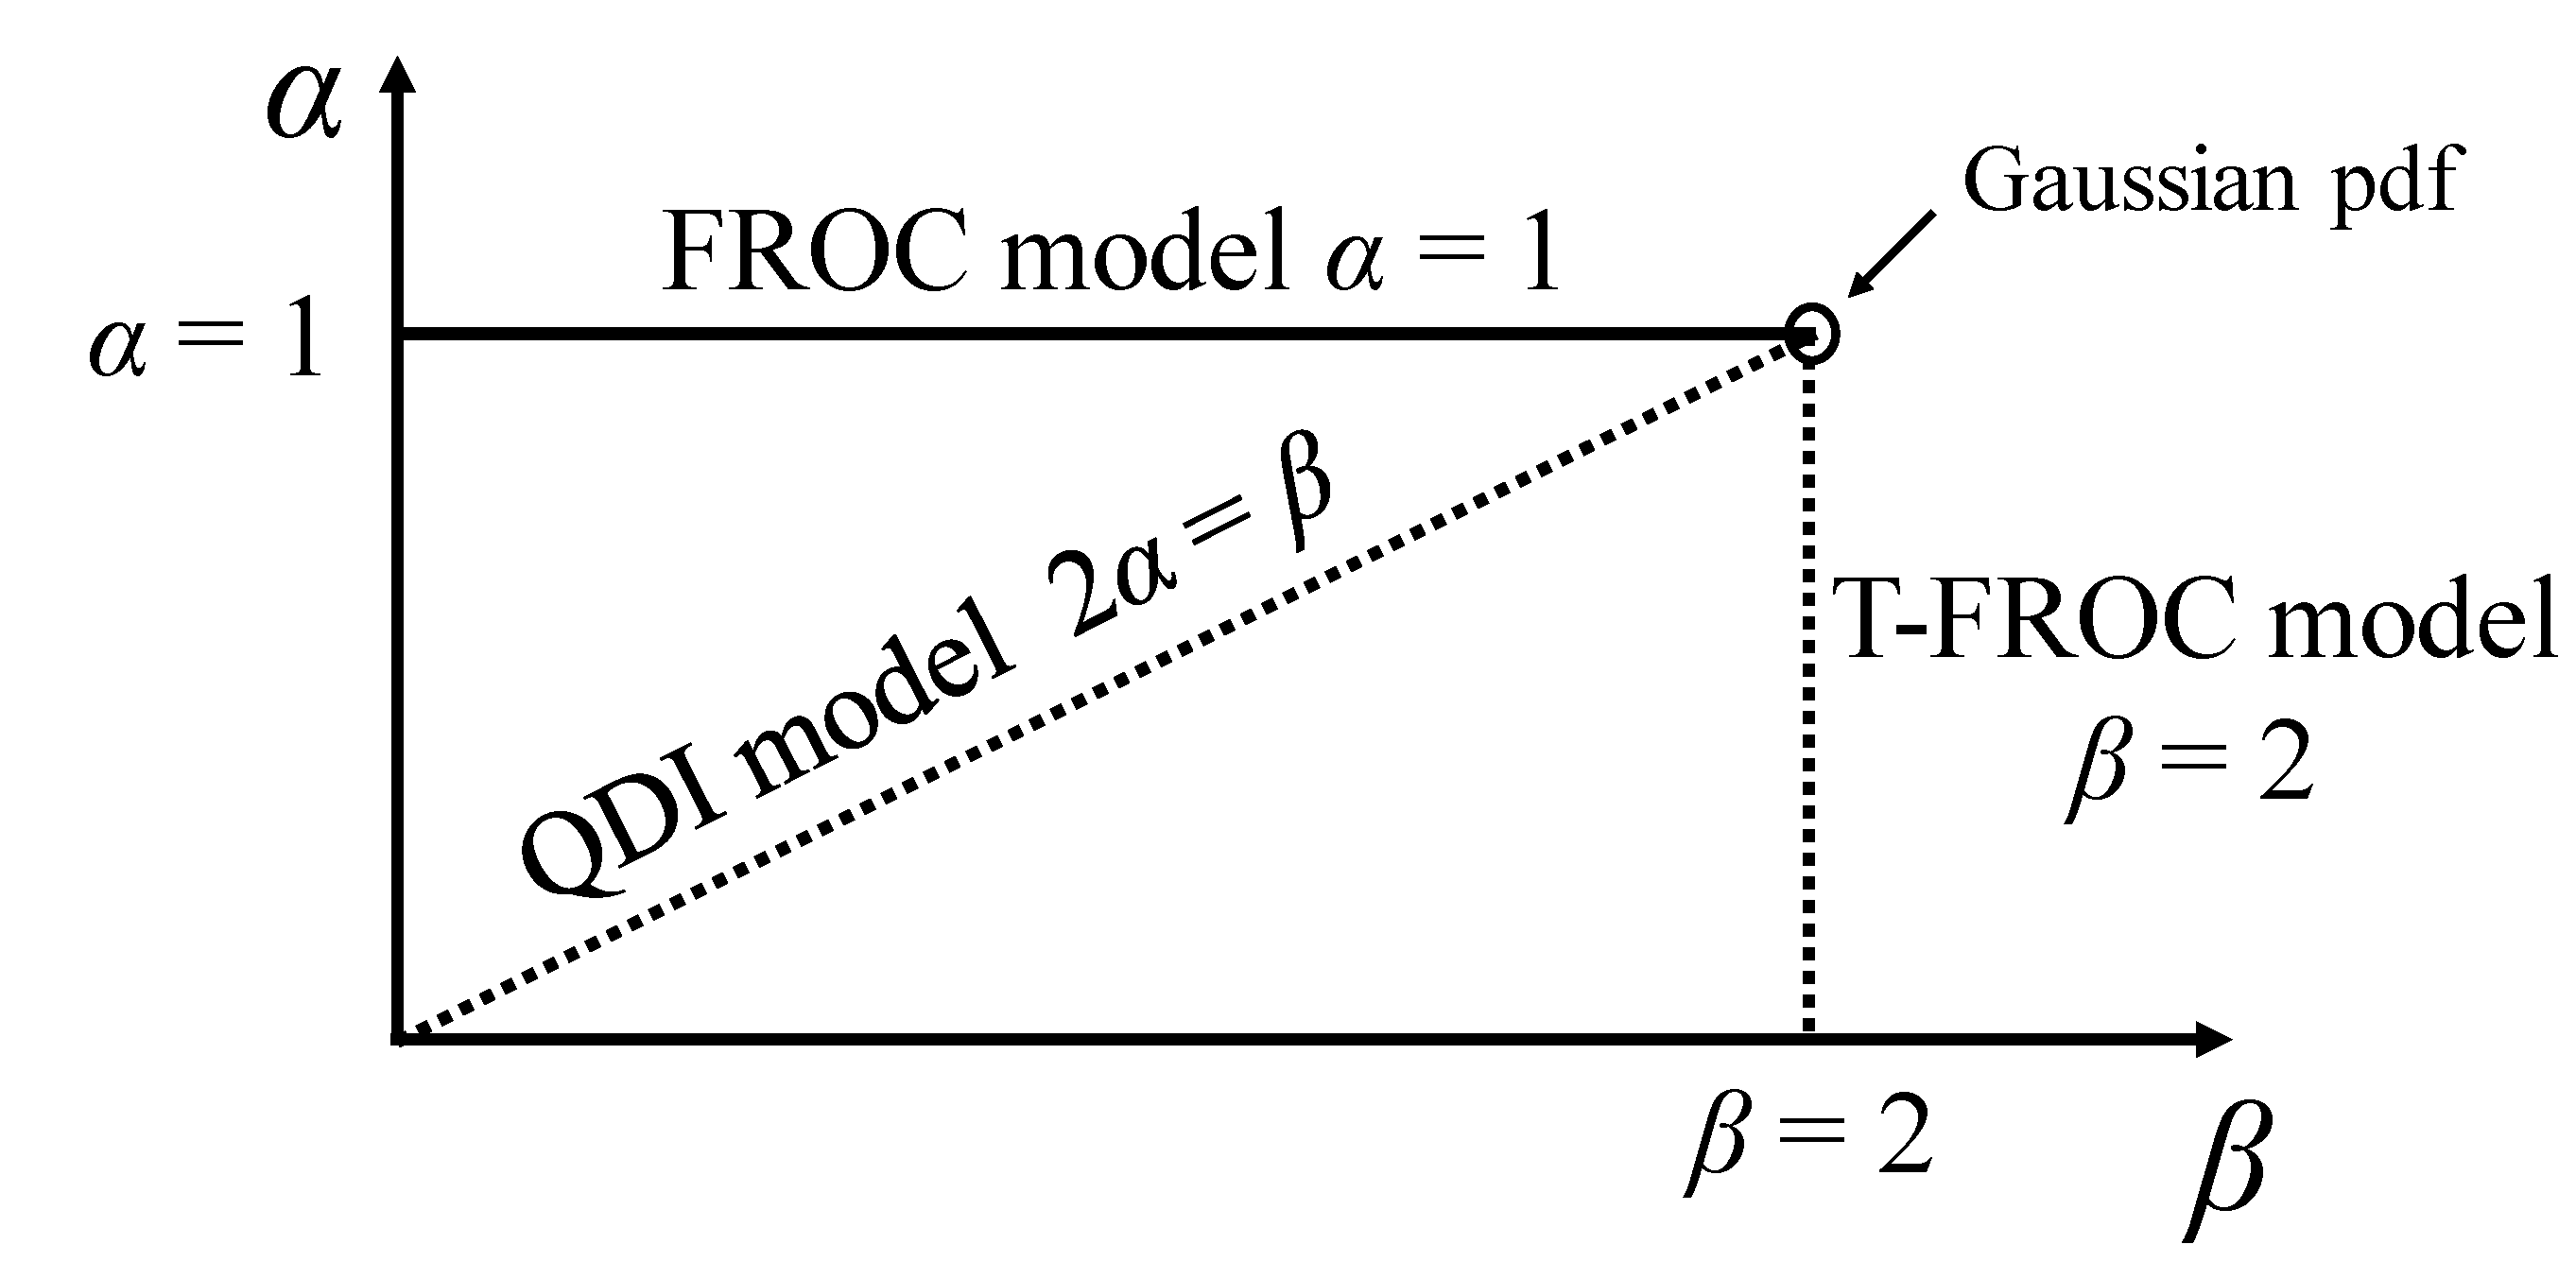
According to the CTRW model, the DWI signal under a Stejskal-Tanner diffusion gradient is described as $$S(q,\overline{Δ}) = S_0E_\alpha (-D_{1,2}\frac{\tau^{1-\alpha}}{\mu^{2-\beta}}q^{\beta}\overline{Δ}^{\alpha})\tag{1}$$ where$$$\overline{Δ} = Δ-δ/3$$$, $$$E_\alpha$$$ is a single-parameter Mittag-Leffler function, and µ and τ are spatial and temporal parameters to preserve the units, respectively.4 Since the time dependency of the spatial fractional order dynamics (α = 1 and 0 < β < 2) in Eq (1) was already investigated in the context of the fractional order calculus (FROC) model,11 we consider two other special cases of the CTRW model in the present study: (I) temporal fractional order dynamics, where 0 < α < 1 and β = 2, which we call T-FROC model; and (II) fractional order dynamic in space and time, where 2α = β, which is referred as quasi-diffusion imaging (QDI).12 The diffusion-weighted (DW) signal intensity in these two cases are given by Eqs. (2) and (3), respectively. $$S(q,\overline{Δ}) = S_0E_\alpha (-bD(Δ/\tau)^{\alpha-1})\tag{2}$$ $$S(b) = S_0E_\alpha -(bD)^{\alpha})\tag{3}$$Figure 1 shows a phase diagram of α and β for visualization of these two cases.Methods
Image Acquisition: Six healthy human subjects were scanned on a 3T MR scanner (Discovery MR750; GE Healthcare) with an 8-channel head coil by using a customized single-shot STEAM DWI sequence. DW images were acquired with 11 b-values from 0 to 3000 sec/mm2 in the three orthogonal directions successively. For each set of b-values, six different TMs were used: 100, 200, 400, 600, 800, and 1000 ms, corresponding to Δ values of 126.2, 223.3, 402.9, 619.8, 819.2, and 1018.7 ms, respectively.Image Analysis: Equations (2) and (3) were employed to fit to each set of multiple b-value DW images voxel-by-voxel by using an iterative Levenberg-Marquardt algorithm. In the fitting process, D was first estimated by a mono-exponential model at lower b-values (≤ 1500 sec/mm2), followed by a simultaneous estimation of α and/or β by using all b-values. Regions of interest (ROIs) were placed on multiple gray matter (GM) and white matter (WM) structures such as the putamen and genu of the corpus callosum, respectively. The mean parameter values were computed over the GM and WM ROIs. A one-way ANOVA analysis was performed to evaluate the statistical difference in each parameter at different TMs in GM and WM ROIs.
Results
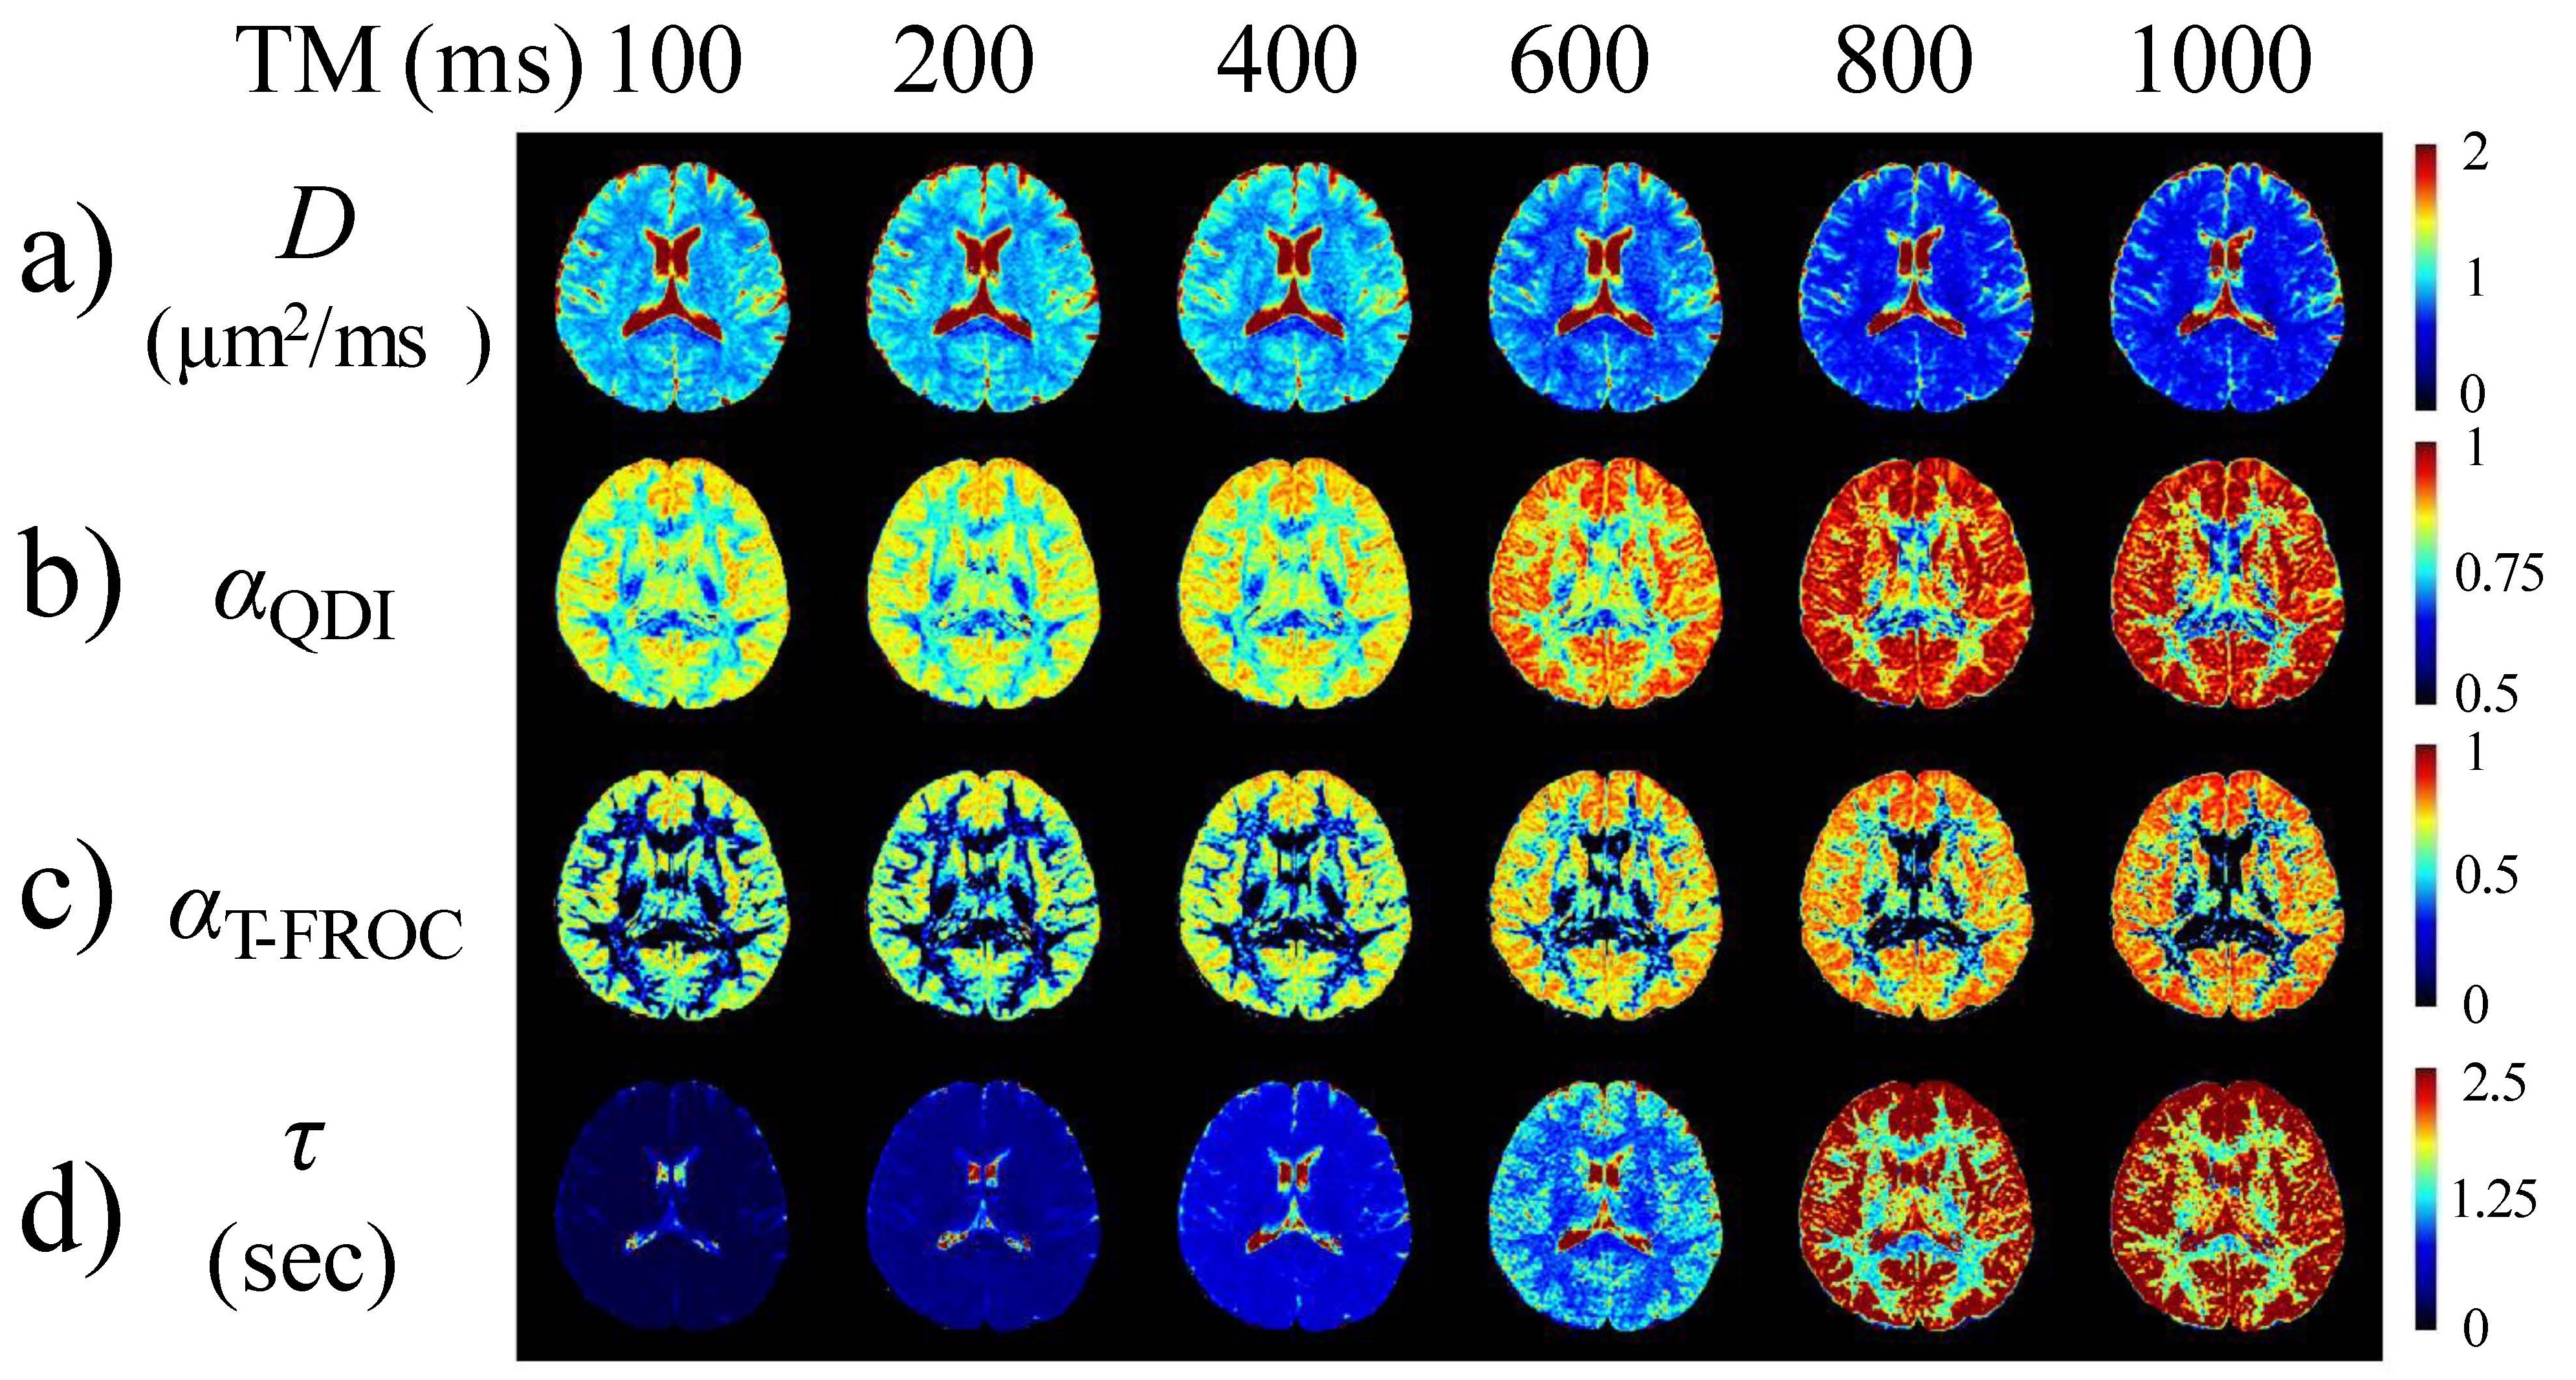
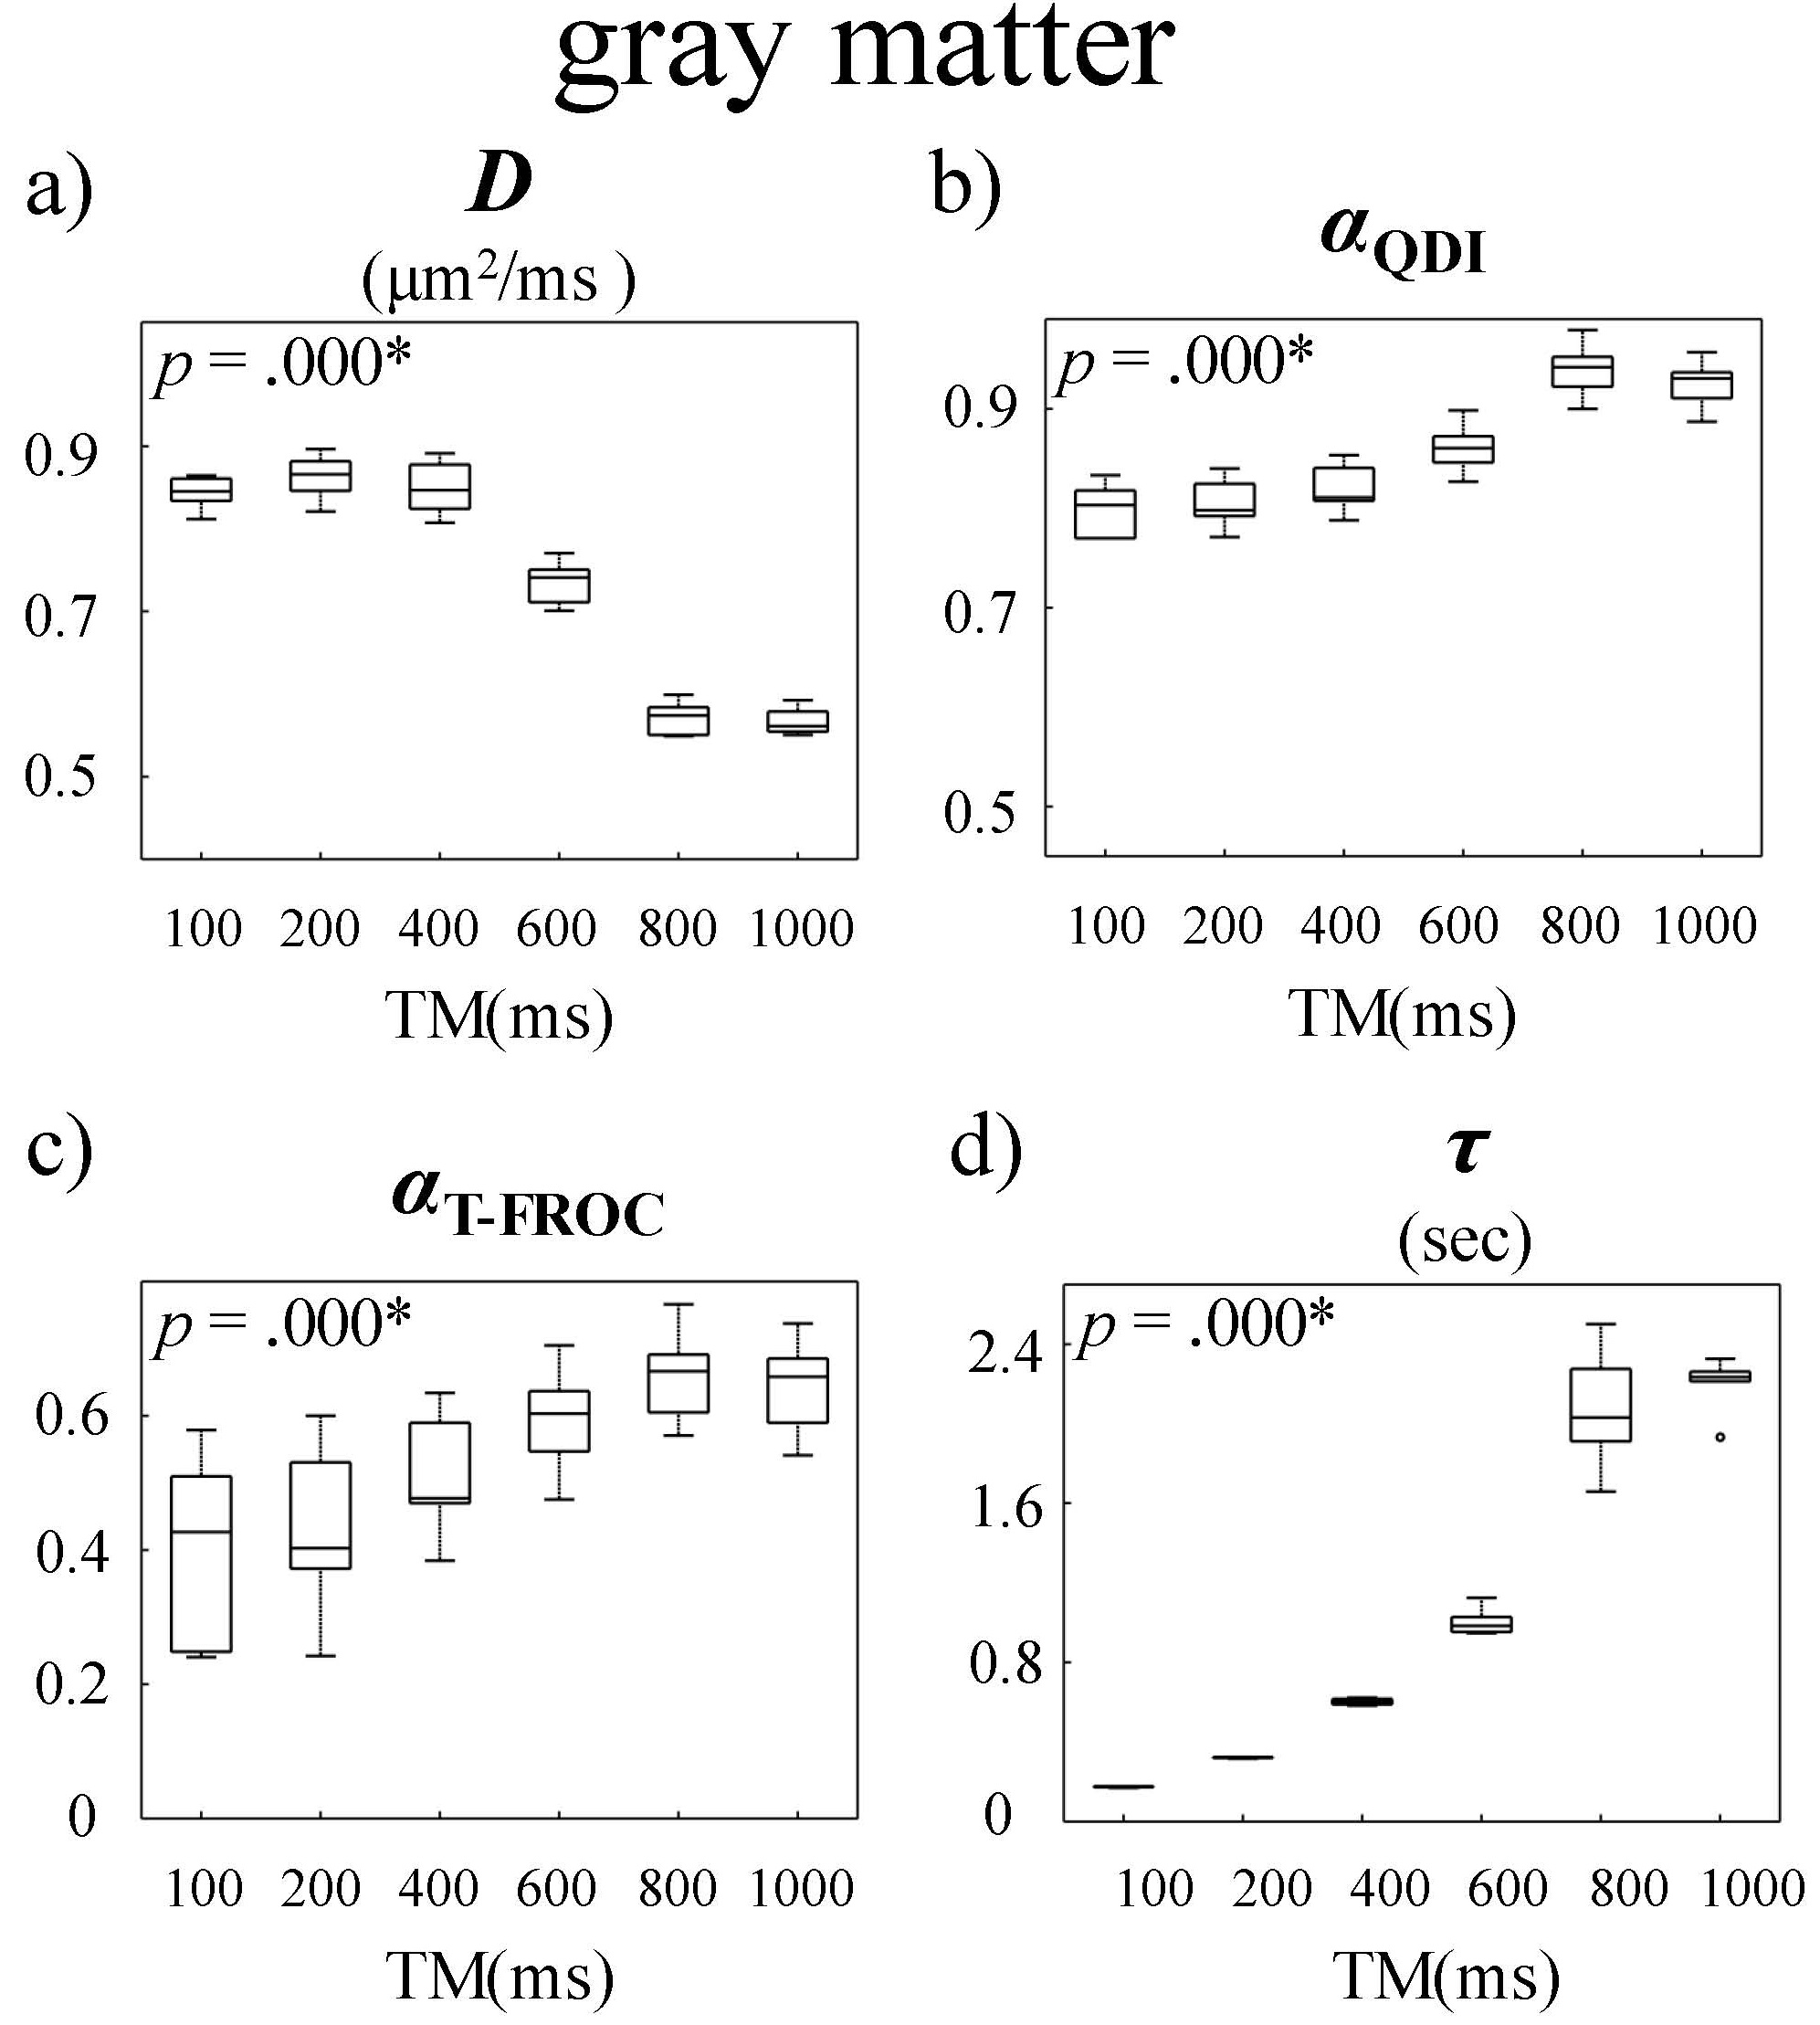
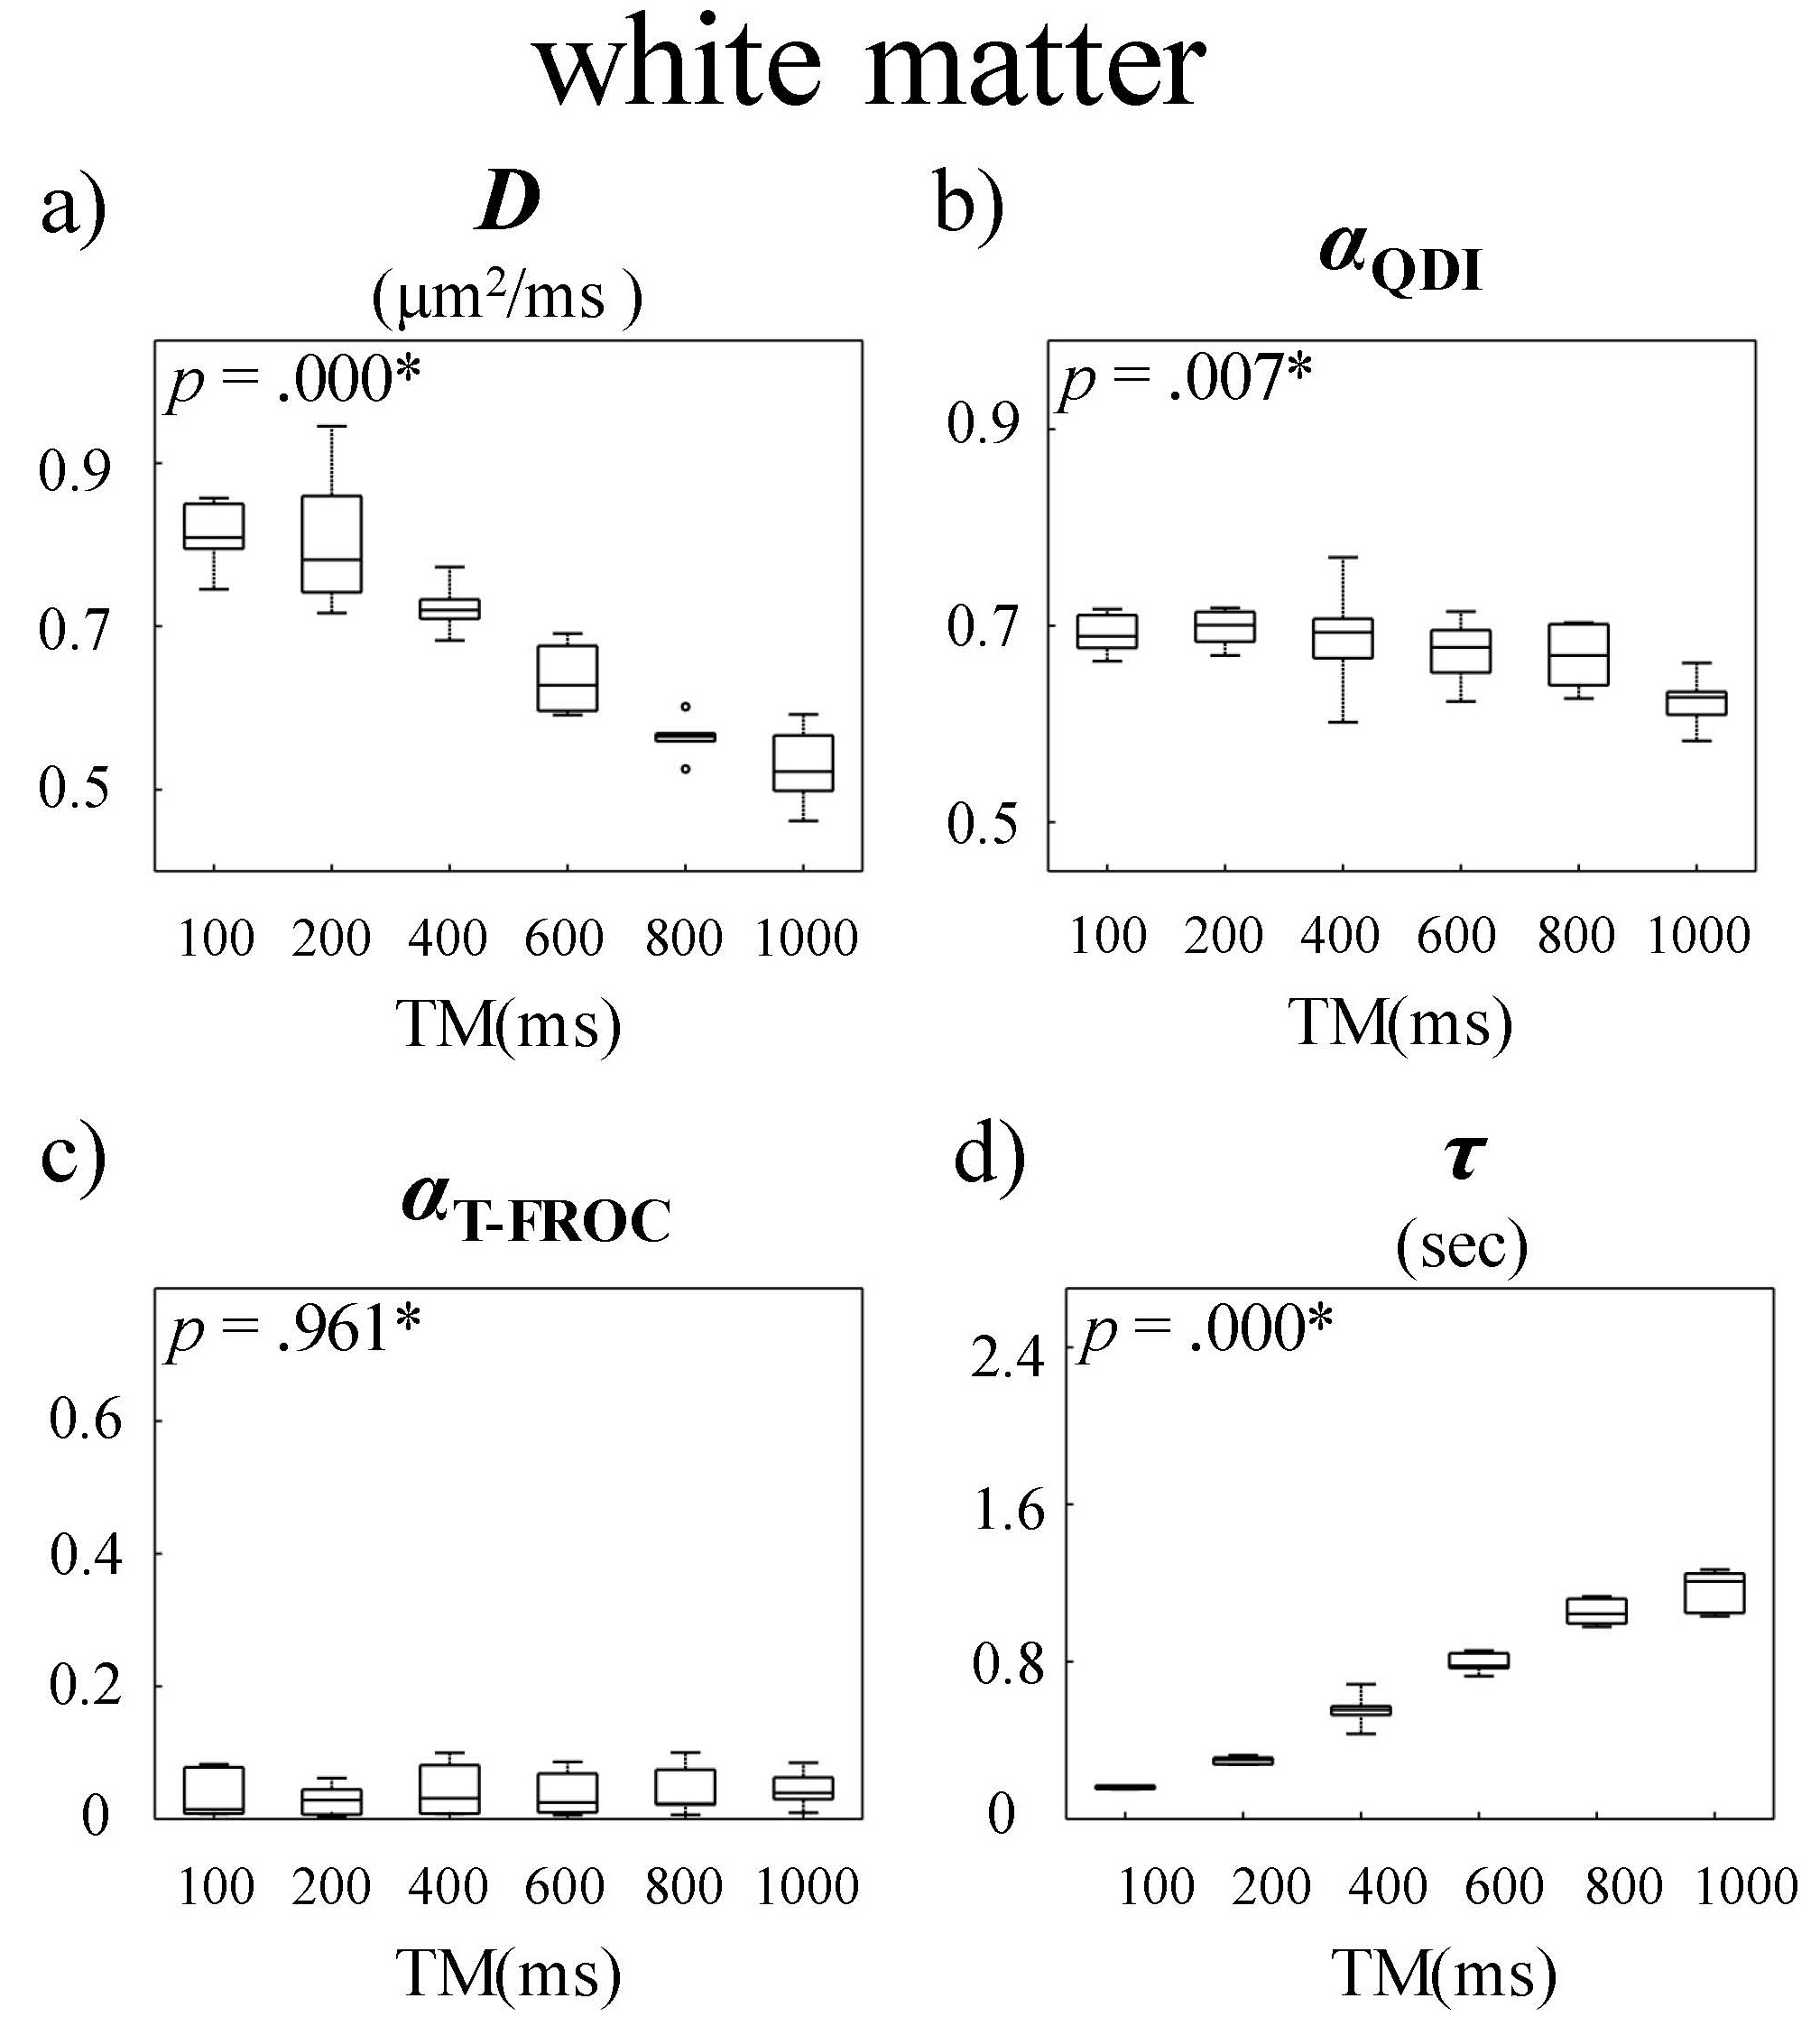
Figure 2 displays a set of representative D, αQDI, αT-FROC, and τ maps at six TMs, where αQDI and αT-FROC denote the α values estimated from the QDI and the T-FROC models, respectively. All parameters exhibited substantial changes with increased Δ or TM. Specifically, D decreased in both GM and WM ROIs as TM increased (Fig 2a) due to the elevated diffusion restriction experienced by the water molecules at longer diffusion times. On the other hand, we observed a steep increase in τ as TM became longer (Fig 2d). The other two parameters, αQDI (Fig 2b) and αT-FROC (Fig 2c), however, substantially increased with TM, only within an intermediate TM range (400ms ≤ TM ≤ 800ms). The time dependency of D, αQDI, αT-FROC, and τ is further illustrated in Figures 3 and 4 where mean GM and WM diffusion parameters from all subjects are shown as boxplots against TM. In GM, significant changes among TMs were observed in all parameters. In WM, statistically significant differences were seen in D, αQDI, and τ, but not in αT-FROC.Discussion and Conclusion
In this study, we demonstrated the substantial dependence of the CTRW parameters on diffusion time by employing a STEAM sequence. The decrease in D at longer diffusion times is consistent with previous studies.4,10 The striking increasing of τ agrees with the mathematical derivation that τ~Δ(1/α).4 In the literature, αQDI and αT-FROC have been related to the shape of the diffusion signal decay curve.12 The increases in αQDI and αT-FROC in the GM suggested that the diffusion signal likely approached the Gaussian regime at long Δ.13 However, this trend was not clearly observed in the WM. These observations can provide new insights into the ongoing efforts to probe tissue microstructures using advanced diffusion imaging models.Acknowledgements
This work was supported in part by the National Institutes of Health (5R01EB026716-01 and 1S10RR028898-01). We thank Dr. Arnaud Guidon from GE healthcare for facilitating pulse sequence exchange. We also thank Dr. Richard L. Magin for helpful discussions.References
[1] Bennett, Kevin M, et al. Characterization of continuously distributed cortical water diffusion rates with a stretched‐exponential model. Magn Reson Med. 2003;50(4):727-734.
[2] Jensen JH, Helpern JA, Ramani A, et al. Diffusional kurtosis imaging: The quantification of non-Gaussian water diffusion by means of magnetic resonance imaging. Magn Reson Med. 2005;53:1432-1440.
[3] Zhou XJ, Gao Q, Abdullah O, Magin RL. Studies of anomalous diffusion in the human brain using fractional order calculus. Magn Reson Med. 2010;63:562-569.
[4] Ingo C, Magin RL, Colon-Perez L, Triplett W, Mareci THH. On random walks and entropy in diffusion-weighted magnetic resonance imaging studies of neural tissue. Magn Reson Med. 2014;71:617-627.
[5] Karaman M, Sui Y, Wang H, et al. Differentiating low- and high-grade pediatric brain using a continuous-time random-walk diffusion model at high b-value. Magn Reson Med. 2016;76:1149-1157.
[6] Novikov DS, Kiselev VG, Jespersen SN. On modeling. Magn Reson Med. 2018;79(6):3172-3193.
[7] Pyatigorskaya N, Le Bihan D, Reynaud O, et al. Relationship between the diffusion time and the diffusion MRI signal observed at 17.2 tesla in the healthy rat brain cortex Magn Reson Med. 2014;72(2):492-500.
[8] Iima M, Nobashi T, Imai H, et al. Effects of diffusion time on non-Gaussian diffusion and intravoxel incoherent motion (IVIM) MRI parameters in breast cancer and hepatocellular carcinoma xenograft models. Acta radiologica open 2018;7(1):1-8.
[9] Reynaud O. Time-Dependent Diffusion MRI in Cancer: Tissue Modeling and Applications. Front. Phys. 2017;5:58.
[10] Zhang Y, Wells SA, Hernando D. Stimulated echo based mapping (STEM) of T1, T2, and apparent diffusion coefficient: validation and protocol optimization. Magn Reson Med. 2019;81:167-181.
[11] Dan, G, Zhang Y, Zhong Z, et al. A study on time dependency of the fractional order calculus diffusion model. In Proceeding of the 28th Annual Meeting of ISMRM. 2020;4384.
[12] Barrick TR, Spilling CA, Ingo C, et al. Quasi-diffusion magnetic resonance imaging (QDI): A fast, high b-value diffusion imaging technique. NeuroImage. 2020;211:116606.
[13] Novikov DS, Fieremans E, Jespersen SN, et al. Quantifying brain microstructure with diffusion MRI: Theory and parameter estimation. NMR Biomed. 2019;32(4):e3998.
Figures