2840
Fitting kinetic rate constants in metabolite-specific bSSFP hyperpolarized [1-13C]pyruvate MRI
Sule Sahin1,2, Shuyu Tang3, Manushka Vaidya2, and Peder E.Z. Larson2
1Graduate Program in Bioengineering, University of California, Berkeley and University of California, San Francisco, Berkeley, CA, United States, 2Radiology, University of California, San Francisco, San Francisco, CA, United States, 3HeartVista, Inc., Los Altos, CA, United States
1Graduate Program in Bioengineering, University of California, Berkeley and University of California, San Francisco, Berkeley, CA, United States, 2Radiology, University of California, San Francisco, San Francisco, CA, United States, 3HeartVista, Inc., Los Altos, CA, United States
Synopsis
An alternate to AUC ratio, fitting pyruvate to lactate rate constants (kPL) can be a powerful tool for quantification of hyperpolarized [1-13C]pyruvate studies. In this work, a model was developed to fit kPL values to a novel acquisition method where lactate was acquired with a stack-of-spiral bSSFP sequence. The model was utilized to fit kPL on three sets of in vivo data: healthy rat kidneys, mouse prostate tumors and human kidney tumors. It was shown that the fit kPL values matched those fit using an established GRE fitting method for complimentary GRE-acquired data sets.
Introduction
In hyperpolarized [1-13C]pyruvate imaging, one method of quantification for the modality is determining kinetic rate constants between pyruvate and its’ metabolites (lactate, alanine etc.) to characterize tissue metabolism. Recently, Tang et al. acquired metabolite-specific 3D images using a stack-of-spiral balanced steady state free precession (bSSFP) sequence to acquire lactate1. This resulted in a 2.5-fold SNR improvement for lactate imaging. The acquired data were quantitatively evaluated by observing area under the curve (AUC) ratio but has yet to be fit for the pyruvate to lactate kinetic rate constant (kPL) due to additional relaxation mechanisms and metabolic conversion during the bSSFP acquisition1. In this work, a model was developed and used to fit ROI-averaged time course data acquired using this bSSFP sequence on in vivo datasets in healthy rat kidneys, mouse prostate tumors, and human kidney tumors. Mapping the rate constants of these studies may give us new metabolic information, better specificity of healthy and cancerous tissues, and allow us to take advantage of the higher SNR achieved using this novel acquisition method.Methods
Two different acquisition methods were used for hyperpolarized [1-13C]pyruvate imaging. In “lactate-bSSFP” experiments (figure 1 and 2), lactate was acquired with a 3D stack-of-spiral bSSFP sequence while pyruvate was acquired with a 3D spoiled gradient-recalled echo (GRE) sequence. The flip angles for pyruvate and lactate were 3° and 60° for the animal studies and 20° and 60°, respectively, for the human studies. In “GRE-all” experiments, both pyruvate and lactate were acquired with a 3D GRE sequence. The flip angles in this experiment for pyruvate and lactate for the animal studies were 3° and 7.67°, and for the human studies, 20° and 30°, respectively1. The images acquired were dynamic with 30 time points and 4 second temporal resolution for the animal studies and 3.5 second temporal resolution for the human studies.A model was developed to simulate the “lactate-bSSFP” experiment based on simplifications to the Bloch equations in matrix form. Assumptions made to simplify the model include no off-resonance, instantaneous RF pulses, metabolic conversion only in the longitudinal magnetization components and a negligible lactate to pyruvate rate constant. To model the bSSFP acquisition of lactate, the acquisition was broken up into two parts (figure 2 and 3). In (A), the RF pulses were modelled as a rotation matrix about the y-axis with flip angle α. Only the transverse (x and y) components of the lactate signal were considered since the pyruvate transverse magnetization is spoiled with GRE acquisition. In (B), the T1 and T2 relaxation and metabolic conversion over the rest of TR was considered.
The state matrix, S, and the equation for part (B) in figure 3 were derived from the differential equations relating the rate constants to the rates of the metabolites2. For each excitation these two steps were repeated, and the magnitude values were averaged to determine one value for each time point. The pyruvate signal was modelled with a similar state matrix but without considering T2 relaxation and simplified using the cosine and sine of the flip angle.
This model was transformed into a fitting function using nonlinear least squares. The fitting was evaluated on three sets of “lactate-bSSFP” experiment data: healthy rat kidneys (N=6, 3 rats with two kidneys each), transgenic adenocarcinoma of mouse prostate (TRAMP) (N=3), and human patients with kidney tumors (N=3) to determine kPL values. ROI-averaged (tumor ROIs, for the TRAMP and human patients) time courses were used for the fitting (figure 4) with fixed T1 values of 20 seconds for lactate and pyruvate and fixed T2 value of 1 second for lactate3,4. As a control, both “lactate-bSSFP” and “GRE-all” experiments were also fit for kPL values using a inputless GRE kPL fitting function2. MATLAB and Python were used for modelling and fitting5.
Results and Conclusions
The bSSFP fitting for “lactate-bSSFP” experiment data was successful and the average R squared value for pyruvate and lactate over all the data was 0.87 and 0.943 respectively (figure 4). Additionally, the kPL values from fitting “lactate-bSSFP” experiment data with the bSSFP model better matched the kPL values of the “GRE-all” experiment data fit with the GRE model compared to fitting “lactate-bSSFP” experiment data with the GRE model (figure 5). This was as expected due to mismatch between the model and data acquisition, motivating the use of this bSSFP model for “lactate-bSSFP” experiments.This work describes a novel fitting model for lactate acquired with a stack-of-spiral bSSFP sequence in hyperpolarized [1-13C]pyruvate imaging and demonstrates that the attained kPL values are equivalent to those attained if GRE acquisition and fitting were used, allowing for quantification of kinetic rates with this highly efficient pulse sequence.
Acknowledgements
This work was supported by NIH Grant P41EB013598 and American Cancer Society Grant RSG‐18‐005‐01‐CCE.References
- Tang, S. et al. A metabolite‐specific 3D stack‐of‐spiral bSSFP sequence for improved lactate imaging in hyperpolarized [1‐ 13 C]pyruvate studies on a 3T clinical scanner. Magn. Reson. Med. 84, 1113–1125 (2020).
- Larson, P. E. Z. et al. Investigation of analysis methods for hyperpolarized 13C-pyruvate metabolic MRI in prostate cancer patients. NMR Biomed. 31, 1–17 (2018).
- Bahrami, N., Swisher, C. L., Von Morze, C., Vigneron, D. B. & Larson, P. E. Z. Kinetic and perfusion modeling of hyperpolarized (13)C pyruvate and urea in cancer with arbitrary RF flip angles. Quant. Imaging Med. Surg. 4, 24–32 (2014).
- Yen, Y. F. et al. T2 relaxation times of 13C metabolites in a rat hepatocellular carcinoma model measured in vivo using 13C-MRS of hyperpolarized [1-13C]pyruvate. NMR Biomed. 23, 414–423 (2010).
- Hyperpolarized-MRI-Toolbox. Available online at: https://github.com/LarsonLab/hyperpolarized-mri-toolbox DOI: 10.5281/zenodo.1198915
Figures
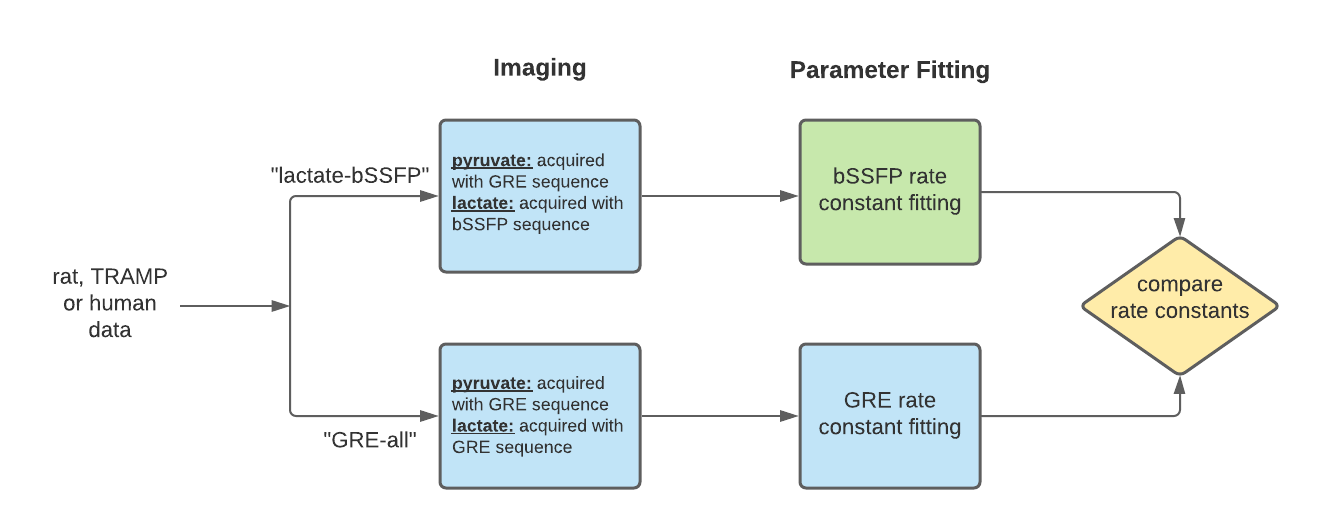
Figure 1: Flow chart describing the “lactate-bSSFP” and “GRE-all” experiments.
The novelty in this work is the bSSFP rate constant fitting (green
square).
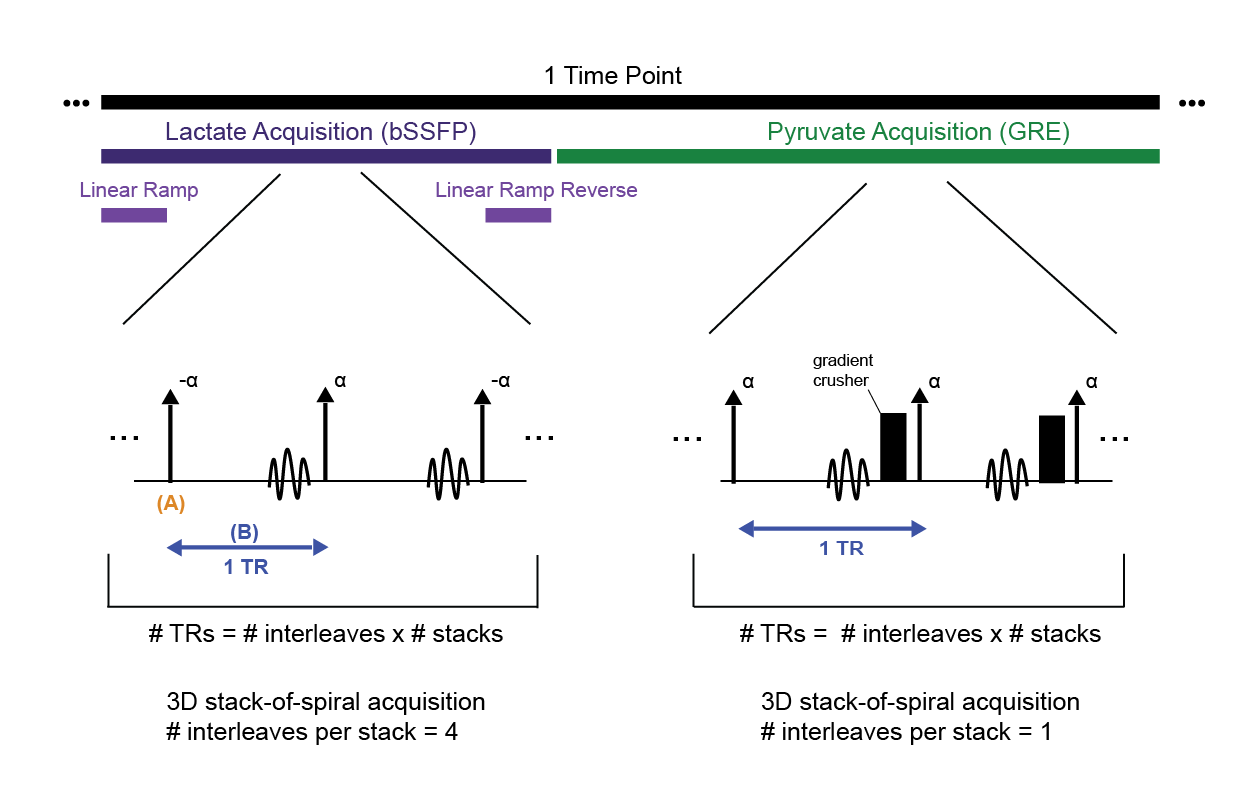
Figure 2: Timeline of one timepoint during the acquisition of “lactate-bSSFP”
experiment. Simple pulse diagrams of lactate and pyruvate acquisition shown.
(A) and (B) describe the two steps to the model. In (A), the RF pulses are
modelled as a rotation matrix about the y-axis with flip angle α or -α. In
(B), the metabolic conversion and T1, T2 relaxations are accounted for in the
model. Pyruvate acquisition includes a gradient crusher at the end of each TR
that spoils transverse magnetization.
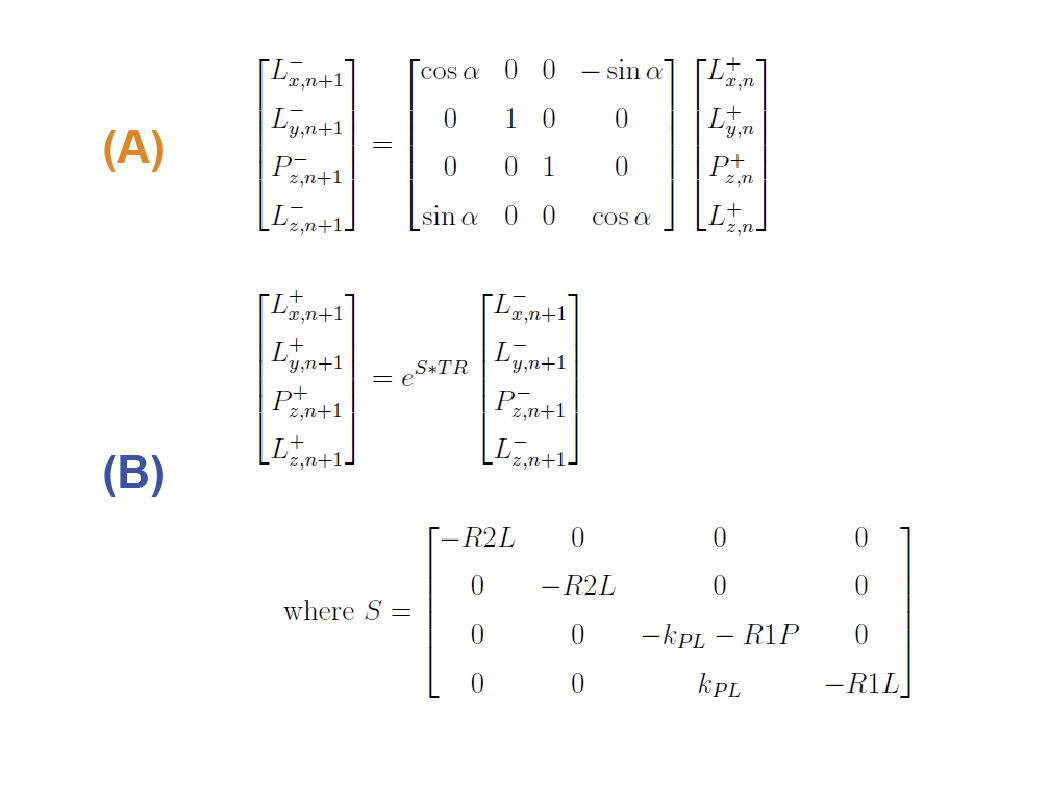
Figure 3: The equations describe the bSSFP model developed. (A) is the
RF pulse modelled as a rotation matrix about the y axis and (B) accounts for
relaxation and metabolic conversion over TR. Lx, Ly, Lz, Pz denote the
transverse and longitudinal magnetization of lactate and pyruvate, n is the
current excitation and the ‘-/+’ denote before/after metabolic conversion. R1P,
R1L are the inverse T1 relaxation terms for pyruvate and lactate, and R2L is the
inverse lactate T2 relaxation term.
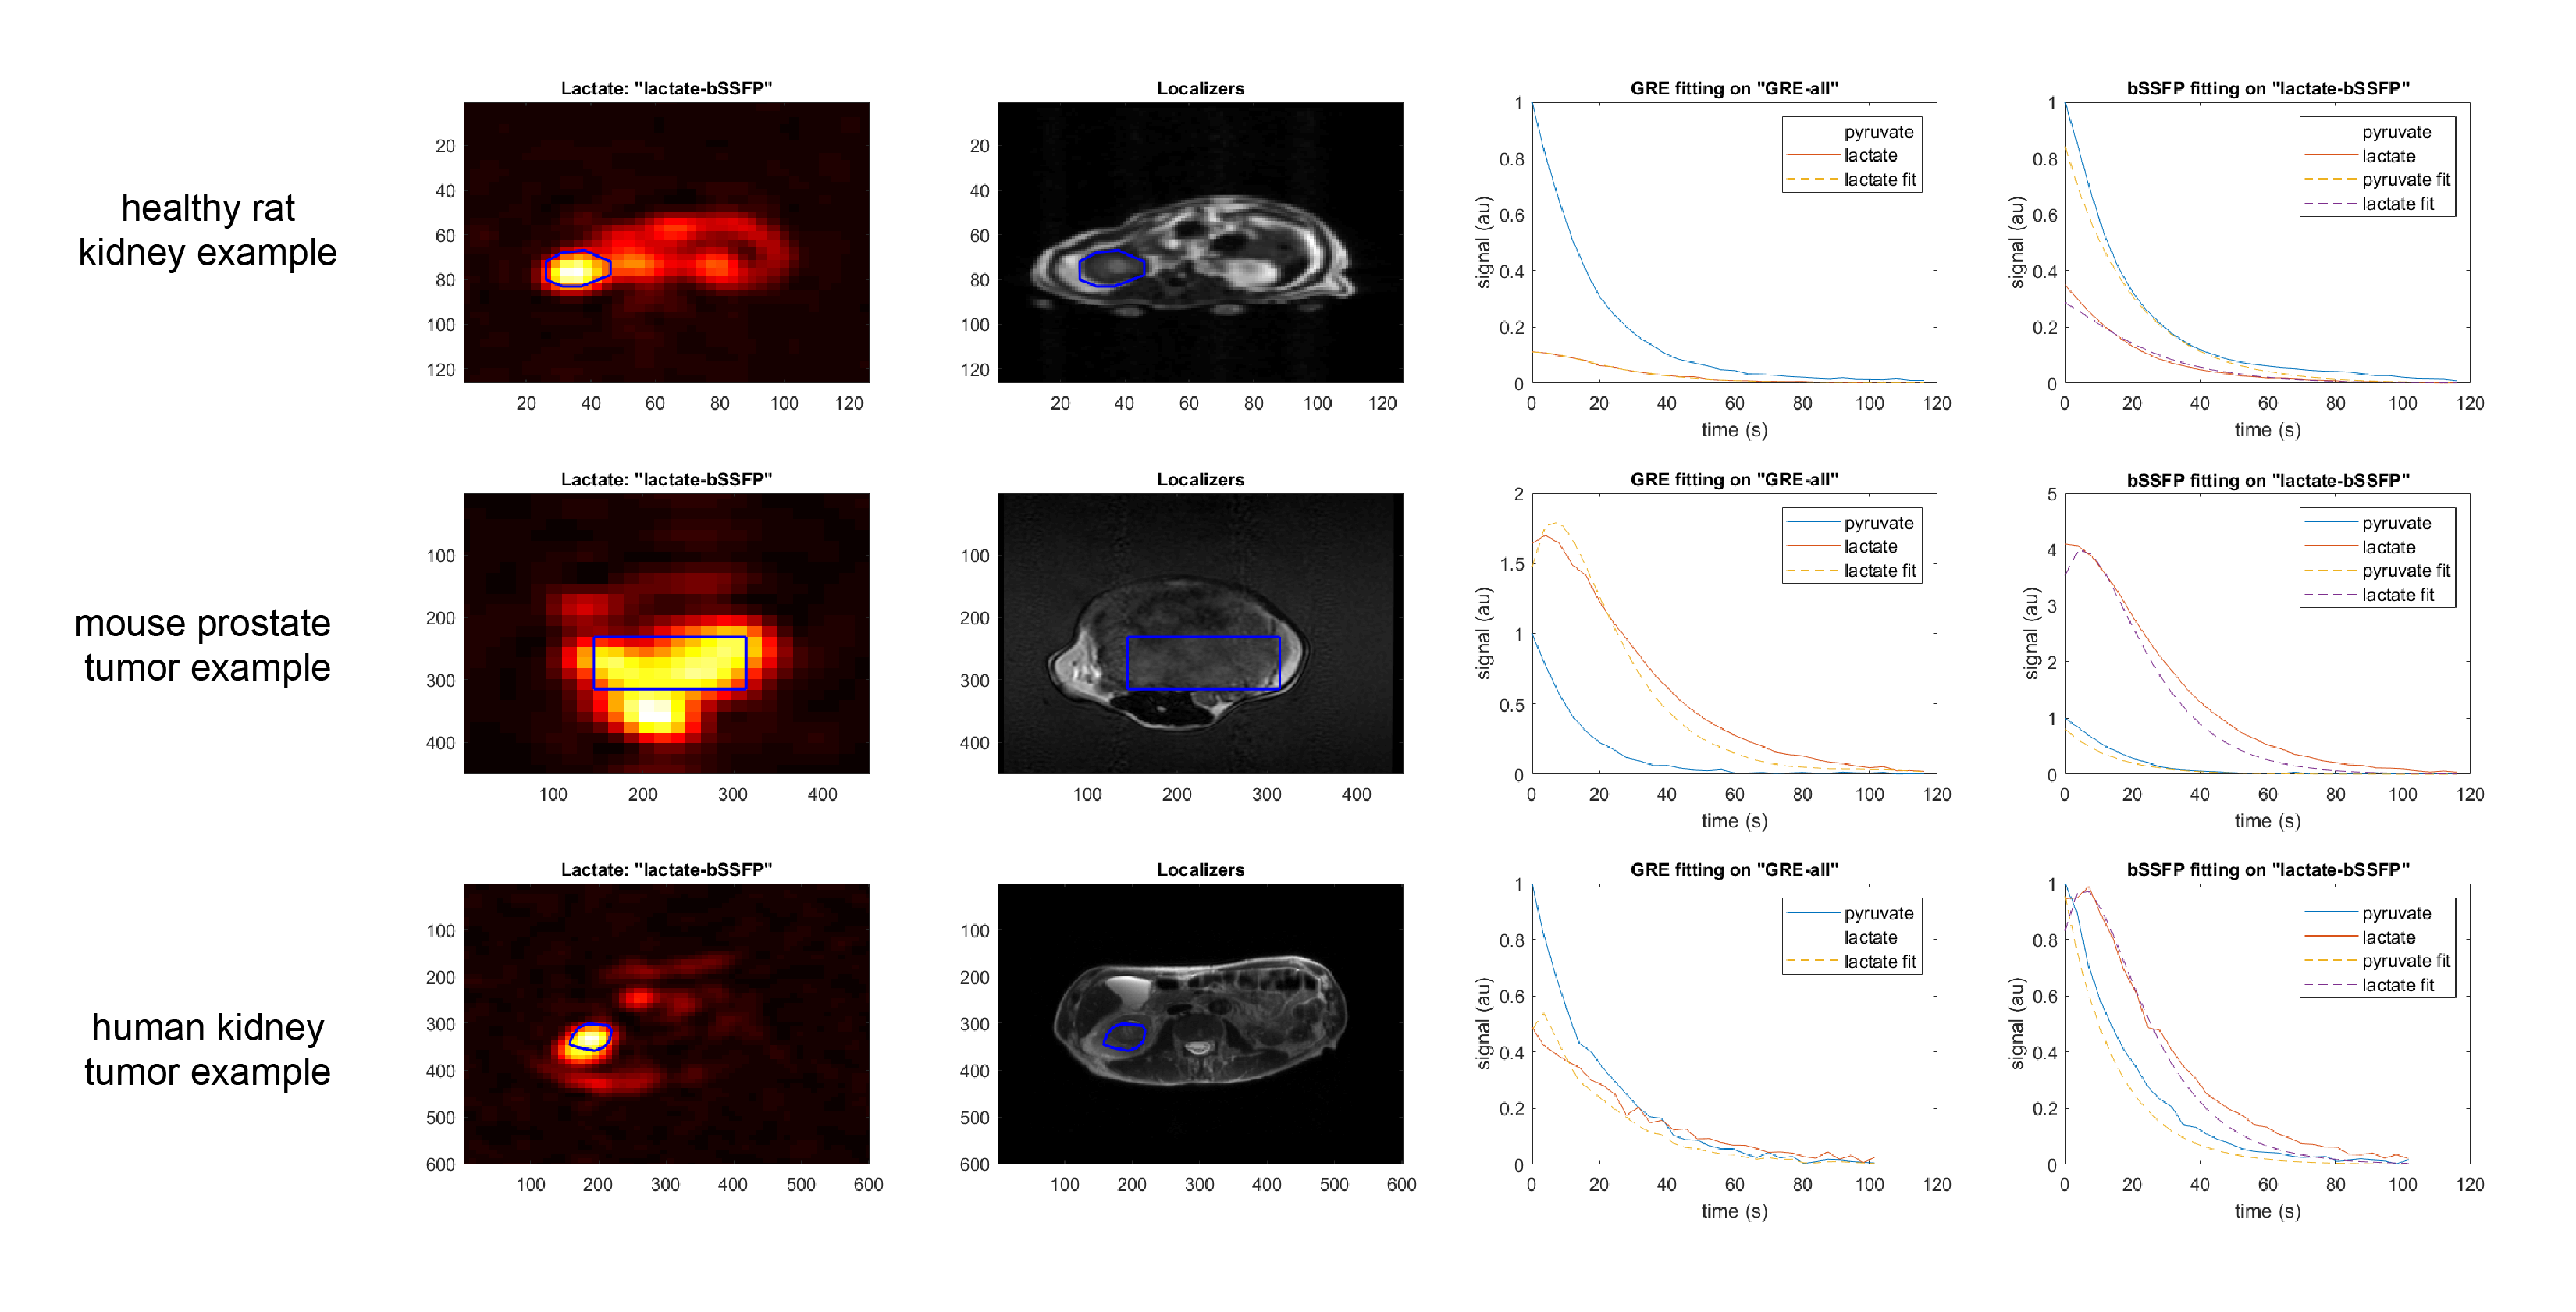
Figure 4: For all three types of in vivo data, an example of a lactate image
acquired in the “lactate-bSSFP” experiment and the corresponding localizers. The
kidney ROI for healthy rats and the tumor ROI for mouse prostate and human
studies are outlined in blue. The signal from the ROI was averaged to get the
time courses. The plots show “GRE-all” time courses fit using the GRE fitting
and the “lactate-bSSFP” experiment time courses fit with the bSSFP fitting.
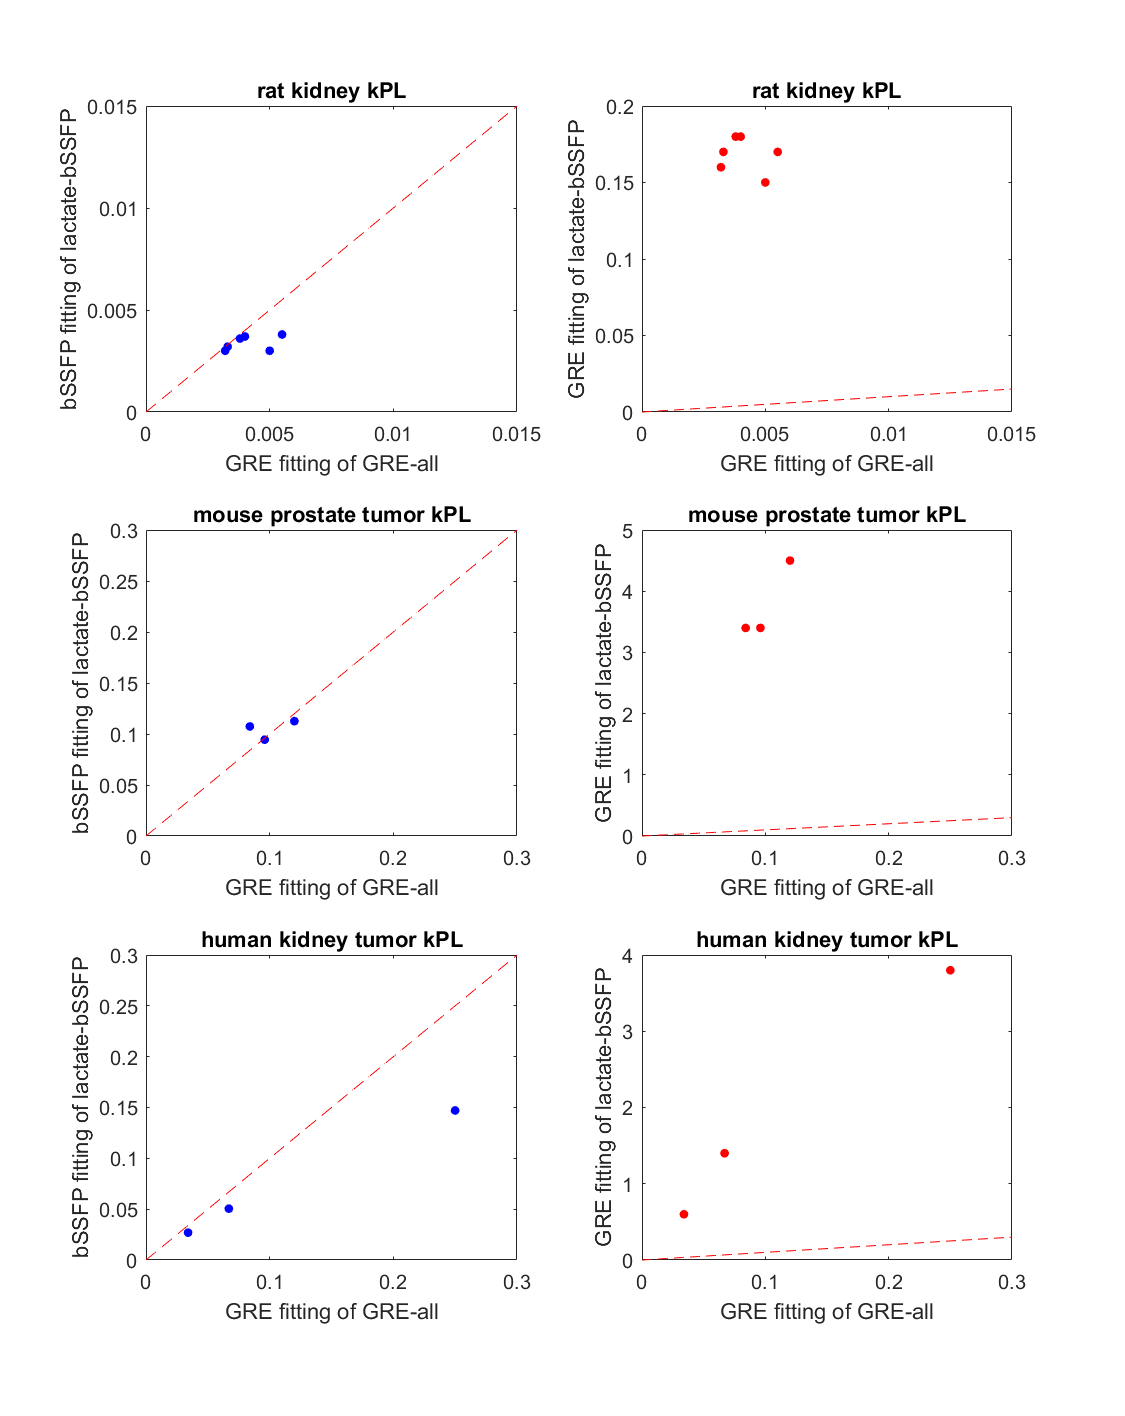
Figure 5: For three sets of in vivo data, kPL values of GRE fitting “GRE-all” vs. kPL
values of bssfp fitting “lactate-bSSFP” (column 1) and kPL values of GRE fitting “GRE-all” vs. kPL
values of GRE fitting “lactate-bSSFP” (column 2). The fitting results from both
experiments should correlate when an appropriate model is used and lie near the
1:1 red dotted line. The GRE model performs poorly when applied to the bSSFP
data.